

Introduction
Peanut shelling companies will have at least one of their shelling facilities processing peanuts almost year round to minimize any carryover of farmers' stock peanuts from one crop year to the next. In the shelling process, farmers' stock peanuts are cleaned removing foreign material, and then shelled, separating the kernels from the hulls. After additional processing to segregate the shelled peanuts into various commercial sizes and sorting to remove additional foreign material and damaged kernels, the shelled peanuts are loaded into flexible intermediate bulk containers (totes). Each tote holds approximately 1 t (1000 kg) of similarly sized and type peantus (e.g. Medium Runners). Totes are assembled, labelled, and positively identified into a single lot consisting of 20 totes. Each tote in the lot is sealed and labelled with a coded adhesive tag around the filler neck of the tote then placed in dry storage or in a cold storage facility where the entire lot remains until they are shipped to the peanut product manufacturer. Once the tote is labelled and sealed with the Federal-State Inspection Service lot identification tag, the tote may not be opened until it reaches the buyer.
As early as 2005, researchers were made aware of complaints of shelled peanuts received by some European customers having spots on the surface of the kernels after oil roasting. In response to the complaints, scientists determined that the spots were caused by injury to the kernel due to fungal invasion (Sobolev, Dorner et al. 2007). Additional studies investigated the temperature and humidity conditions that may have caused the spotting (Dorner, Butts et al. 2007), when the conditions may have occurred during overseas transit (Butts, Dorner et al. 2007), and proper sampling to detect the spotting (Whitaker, Sanders et al. 2007).
More recently, complaints of mold being found on the peanuts in the tops of the totes by domestic and international customers have been received. Butts and Lamb (2014) found that peanuts were rehydrating after being placed into cold storage. After performing some tests and monitoring temperature and humidity conditions during transit in shipping containers, they recommended changing the breathability specifications so that the side, top, and bottom fabric panels all have a minimum breathability of 40 cfm (APC 2010). While this measure adopted by the peanut industry reduced the number of complaints, they have not been completely eliminated.
During the shelling process, peanuts reach a temperature that is in equilibrium with the ambient temperature in the shelling plant due to the large amount of moving air used in the shelling, sorting, and sizing processes. As the shelled peanuts are loaded into the totes, ambient air accompanies the peanuts into the bag. The totes are placed into cold storage facilities maintained according to the good management practices between 1 and 5 C and 55 and 70 relative humidity (APC 2009). There is no documented research stating how these temperature and humidity ranges were selected. However, it is well known that chemical reaction rates, including that of lipid oxidation, decrease as temperature decreases. It is also known that reproductive life cycles of postharvest insect pests such as indian meal moth (Plodia interpunctella (HBNER)), are considerably slower at temperatures less than 21 C and progression may stop at the recommended cold storage temperatures (Redlinger and Davis 1982)
The psychrometric chart is a graphical representation of the thermodynamic properties of moist air and can be used to visualize how the temperature and humidity conditions change when air is heated, cooled, or mixed with air of differing conditions. Figure 1 shows a psychrometric chart with cold storage conditions of 3 C and 65 relative humidity. Also indicated on the graph is a temperature and humidity condition, 29 C and 70 relative humidity and represents a daily average temperature and humidity that may occur during the summer months in a peanut shelling plant. The straight line connecting these two points is the path that the temperature and humidity of the air in the top of the tote would take as it mixes with the air in a cold storage facility. As the mixing occurs, the relative humidity in the top of the tote would reach 80 when the temperature reaches about 24 C. The relative humidity remains at least 80 until the temperature in the top of the tote reaches 7 C. During the transition, the relative humidity exceeds 90 for a significant portion of the time. To minimize risk under these conditions, the time required for the transition to occur must be minimized. This was the effect of the increasing the breathability of the fabric used to make the totes and the forced ventilation used by Butts and Lamb (2014).
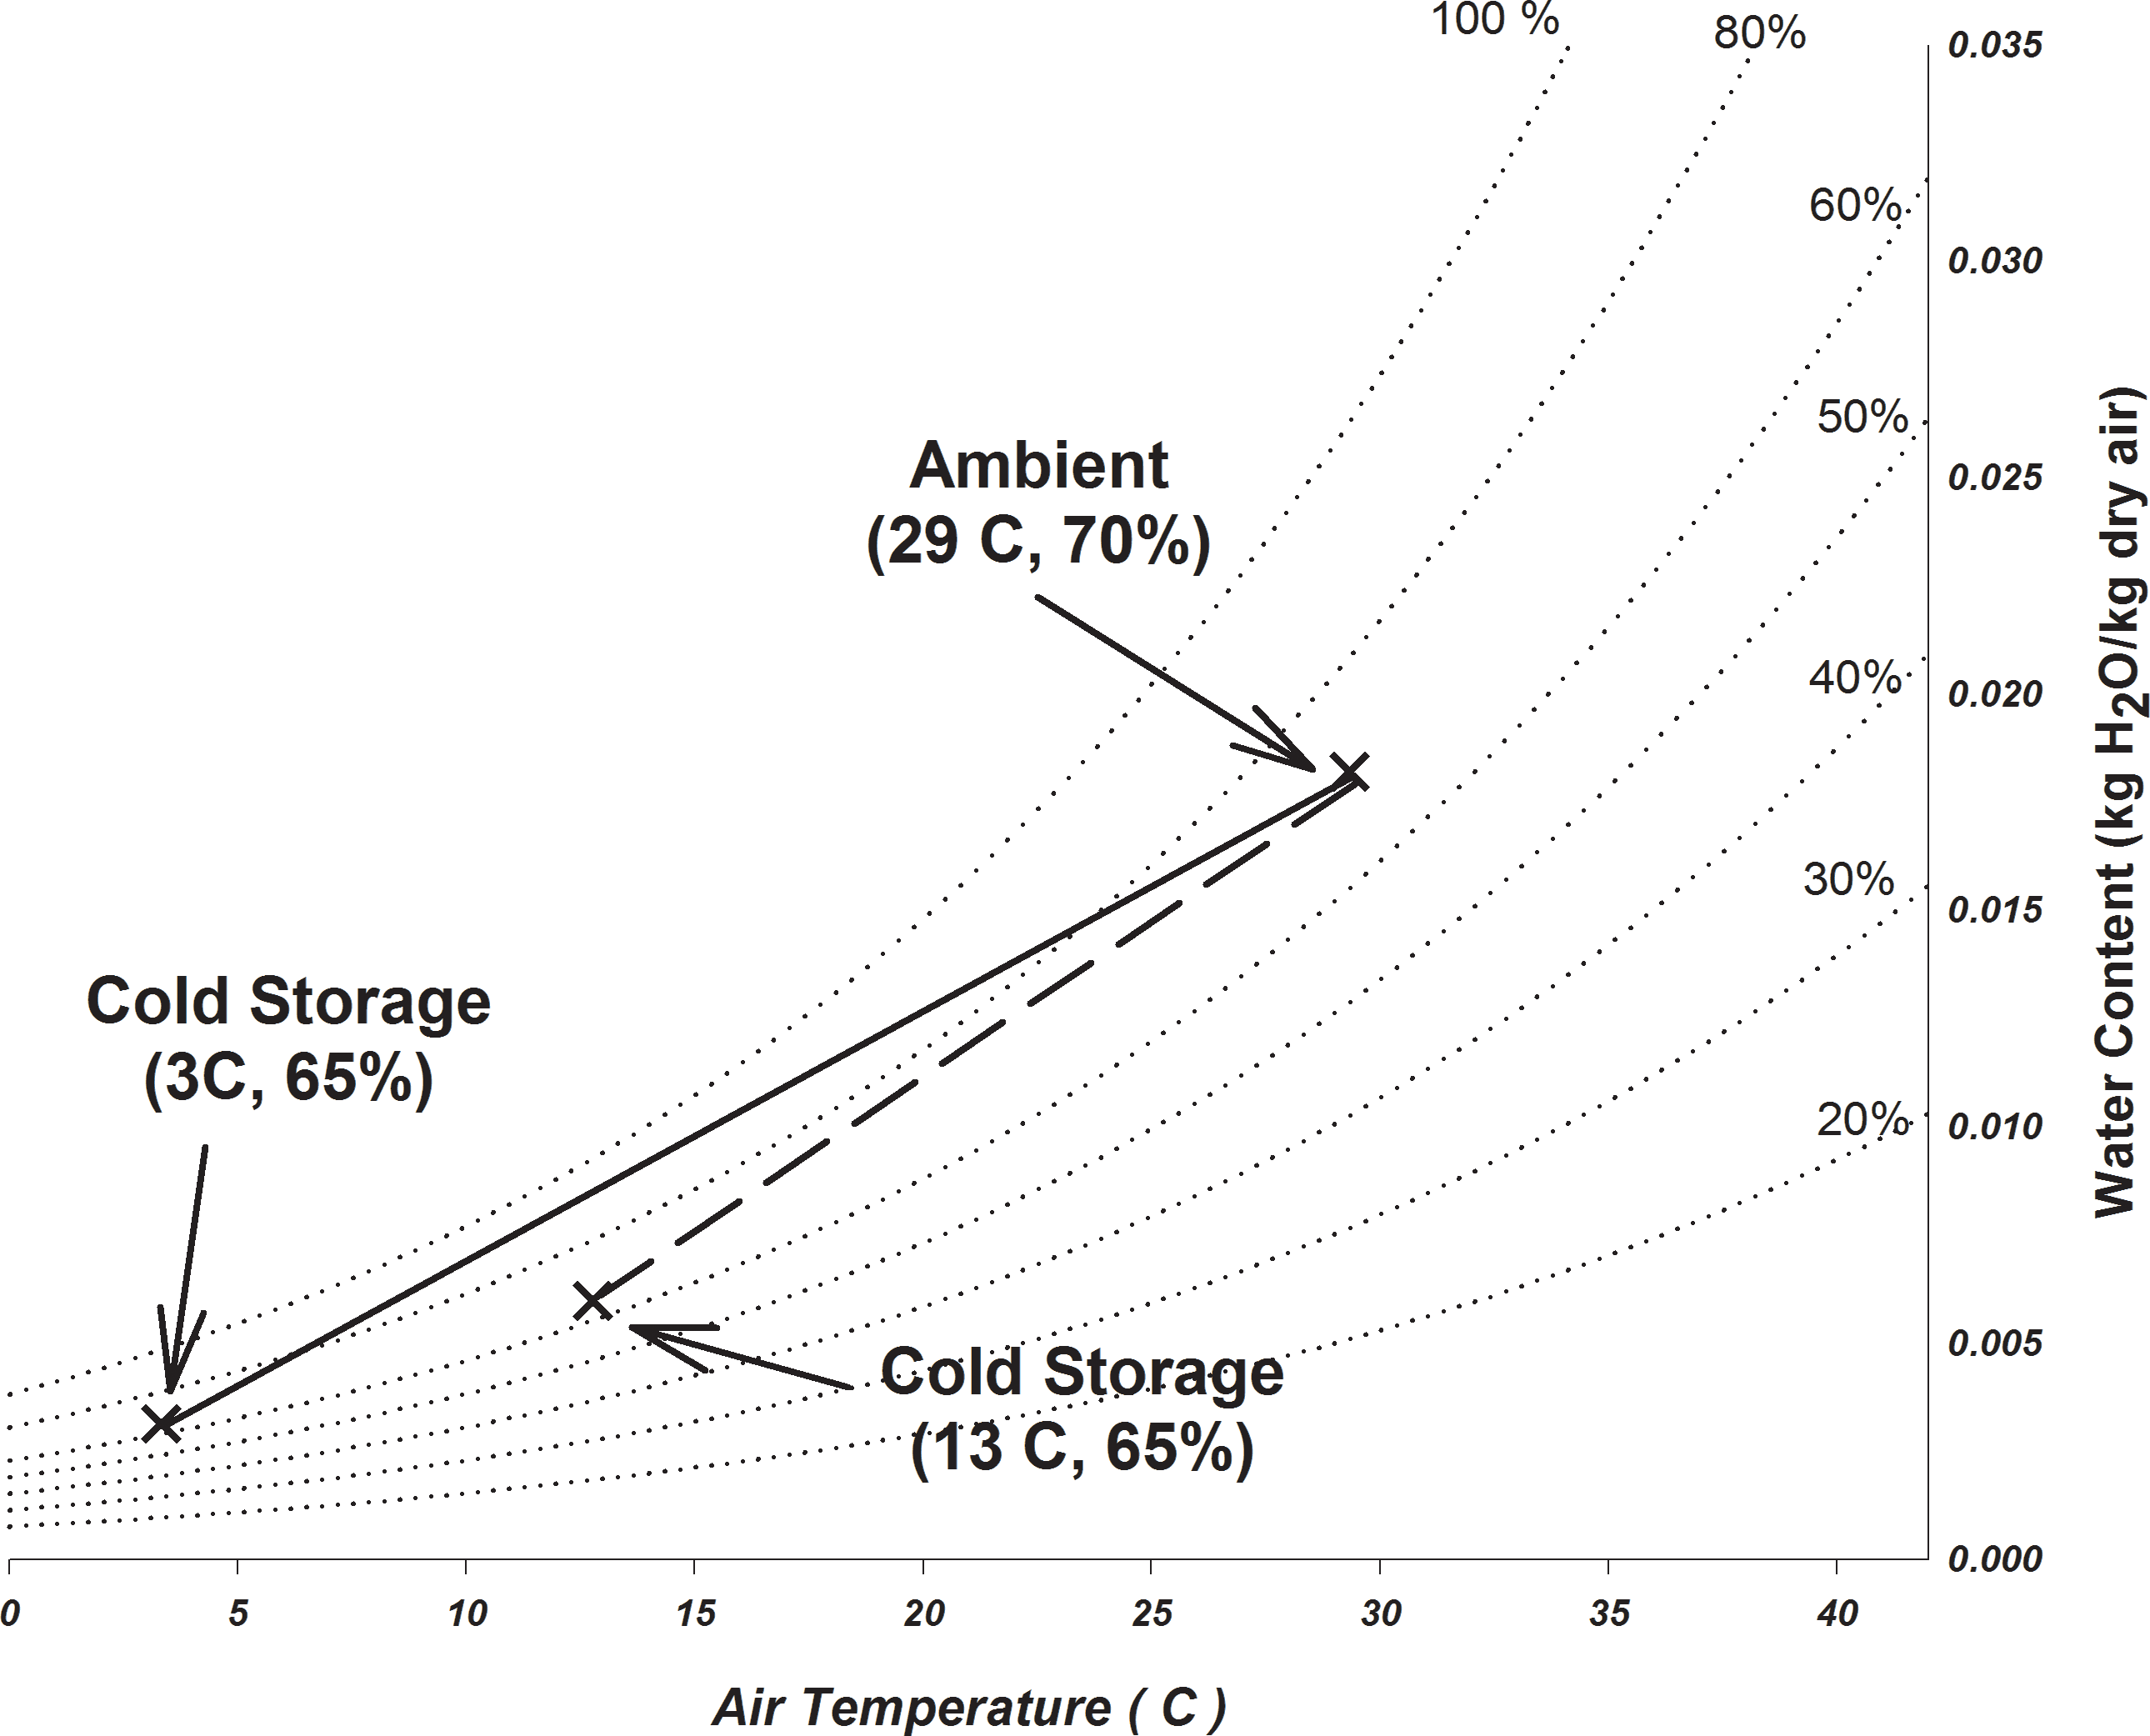
Psychrometric chart showing thermodynamic properties of air as it transitions from ambient conditions (29 C, 70 relative humidity) to typical cold (3 C, 65) and alternative (13 C , 65) storage conditions.
If the conditions for cold storage were changed from 3 to 13 C with the same relative humidity condition of 65 (Figure 1), the relative humidity in the top of the tote should remain below 80 throughout the transition period. However, there are no published data on the stability of the flavor, oil chemistry, or seed germination of peanuts stored at 13 C. Increasing the storage temperature might increase the activity of insects or rodents. Using the cooling degree day calculator on the University of Georgia Weather Network website (UGA 2017), the average annual cooling degree days from Albany, Attapulgus, Dawson, and Vienna were determined using 3 and 13 C as the base temperature. If the storage temperature were increased from 3 to 13 C, the average (2009 2016) cooling degree days, would be reduced from 5629 to 2525 C-days. This is a potential reduction of 55 of the energy required to operate a cold storage facility.
The primary objective of this research was to investigate the effect of alternative temperature environments for storing shelled peanuts on peanut quality and storage facility pest management. Specific objectives were two-fold:
-
1.
Determine the effect on peanut water activity, seed germination/vigor, free fatty acids, peroxide values, and flavor over time at various temperature and humidity conditions.
-
2.
Monitor temperature, humidity, and peanut wetness in totes of shelled peanuts in commercial storage facilities held at conventional cold storage conditions (3 C, 65) and alternative storage conditions (13 C, 65).
Materials and Methods
Small Chamber Experiments.
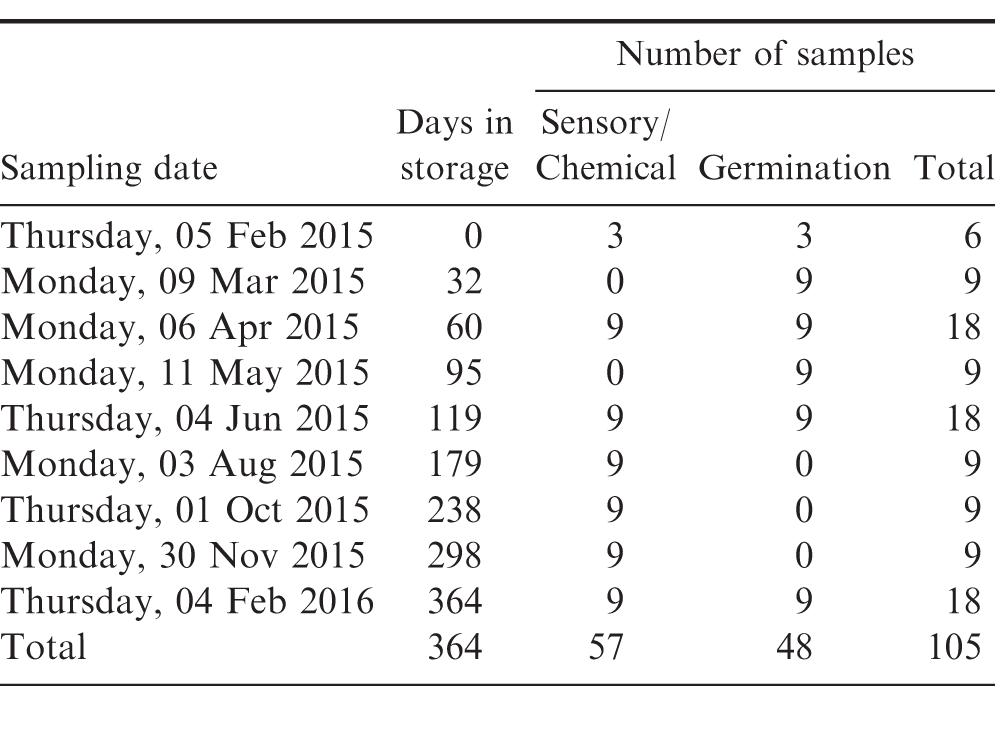
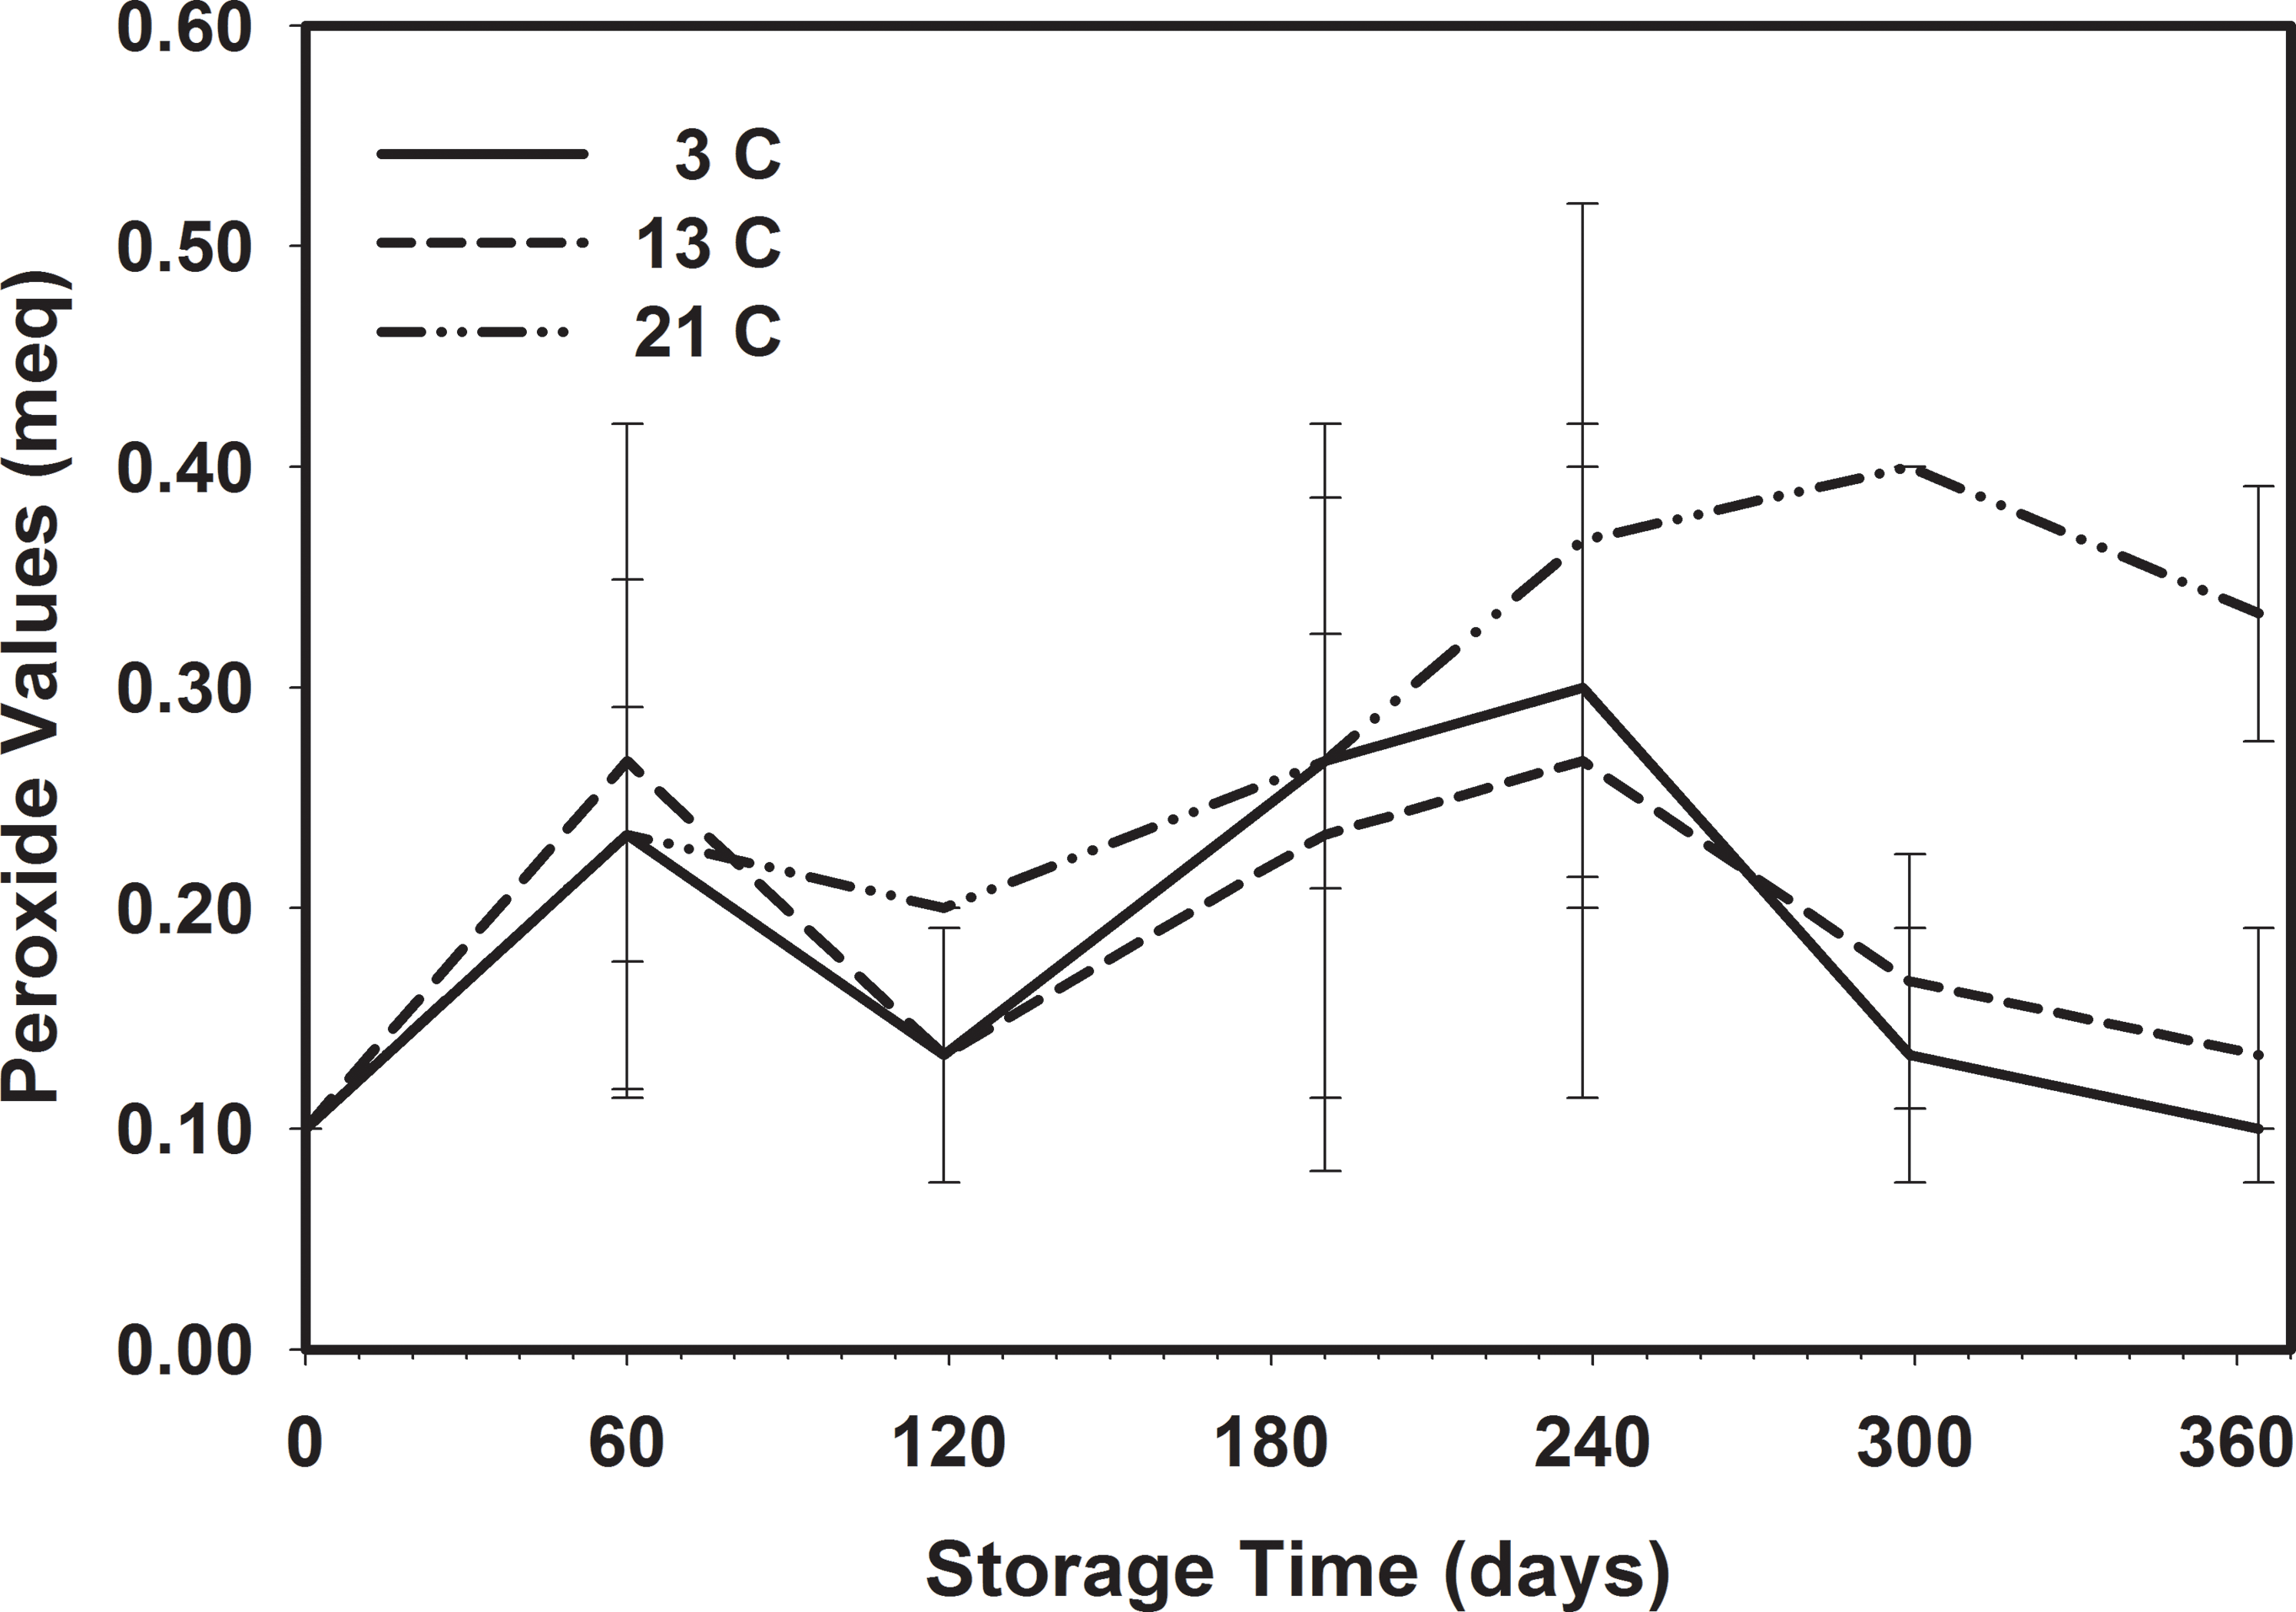
Approximately 600 kg of mill run runner medium-sized peanuts were obtained from a single shelled lot of the 2014 peanut crop. Sample bags were fabricated from woven polypropylene fabric used in the manufacture of the flexible intermediate bulk containers (totes) for storing and handling shelled peanuts (APC 2010). The sample bags were formed by folding a 31 62 cm swatch of the fabric in half and sewing the edges to form a 31 31 cm pillowcase bag. Samples were made by placing 2500 100 g of the medium-sized runner lot previously obtained into 123 of the sample bags and sewing the bag closed. The excess 290 kg of peanuts were placed in a cooler maintained at 3 C for future use. Three samples were randomly chosen to determine the initial moisture content (mc, wet basis), water activity (aw, decimal), free fatty acids (FFA, ), peroxide value (PV, meq), seed germination (), and sensory panel evaluation. The remaining 120 samples were randomly divided into three groups of 40 samples each. One group was placed in a conventional walk-in cooler maintained at 3 C. The walk-in cooler had no capability to control humidity. Group 2 was placed in a controlled environment chamber (Model GR36LC8, Percival Scientific, Perry IA) maintained at 13 C and 65 relative humidity (Figure 2). The 40 samples in Group 3 were placed in a controlled environment chamber maintained at 21 C and 65 relative humidity. Peanuts were stored for 360 d. Three dataloggers (Hobo Model U23-001, Onset Computers, Bourne, MA) were placed in each storage chamber to record temperature and relative humidity every 30 minutes throughout the test. Three samples were removed from each storage chamber every 30 d for the first 120 d of the 360-d storage study to determine the seed germination rate. Standard germination and cold germination tests were performed by the Georgia Department of Agriculture. Three samples were removed from each storage chamber every 60 d and evaluated for sensory and chemical characteristics. Sensory evaluations were performed by a trained panel at an independent laboratory using the lexicon (Sanders, Vercellotti et al. 1989; Sanders, Vercellotti et al. 1989) and a truncated 10-point SpectrumTM technique (Meilgaard, Civille et al. 2016) to rate the intensity of each flavor attribute. Each sample was roasted to an average Hunter L-value of 48.5 and ground into a paste. Each panellist scored the intensity of each of the flavor attribute (Table 1) on a scale from 0-10, with 0 being non-detectable and incrementally increasing to the most intense sensory level of 10. The acceptable ranges for each attribute shown in Table 1 are estimated ranges of acceptability, but thresholds for individual customers may vary (Davis, J.P. Director Technical Services, pers. communication, 15 Dec 2016). The ratings of each attribute were averaged across all panelists and presented with no indication of variation. Table 2 shows the sampling schedule for these small chamber experiments. To maintain consistent air movement among the samples throughout the test period, the original sample bag was refilled using the excess peanuts, closed, and placed back in the appropriate storage environment.
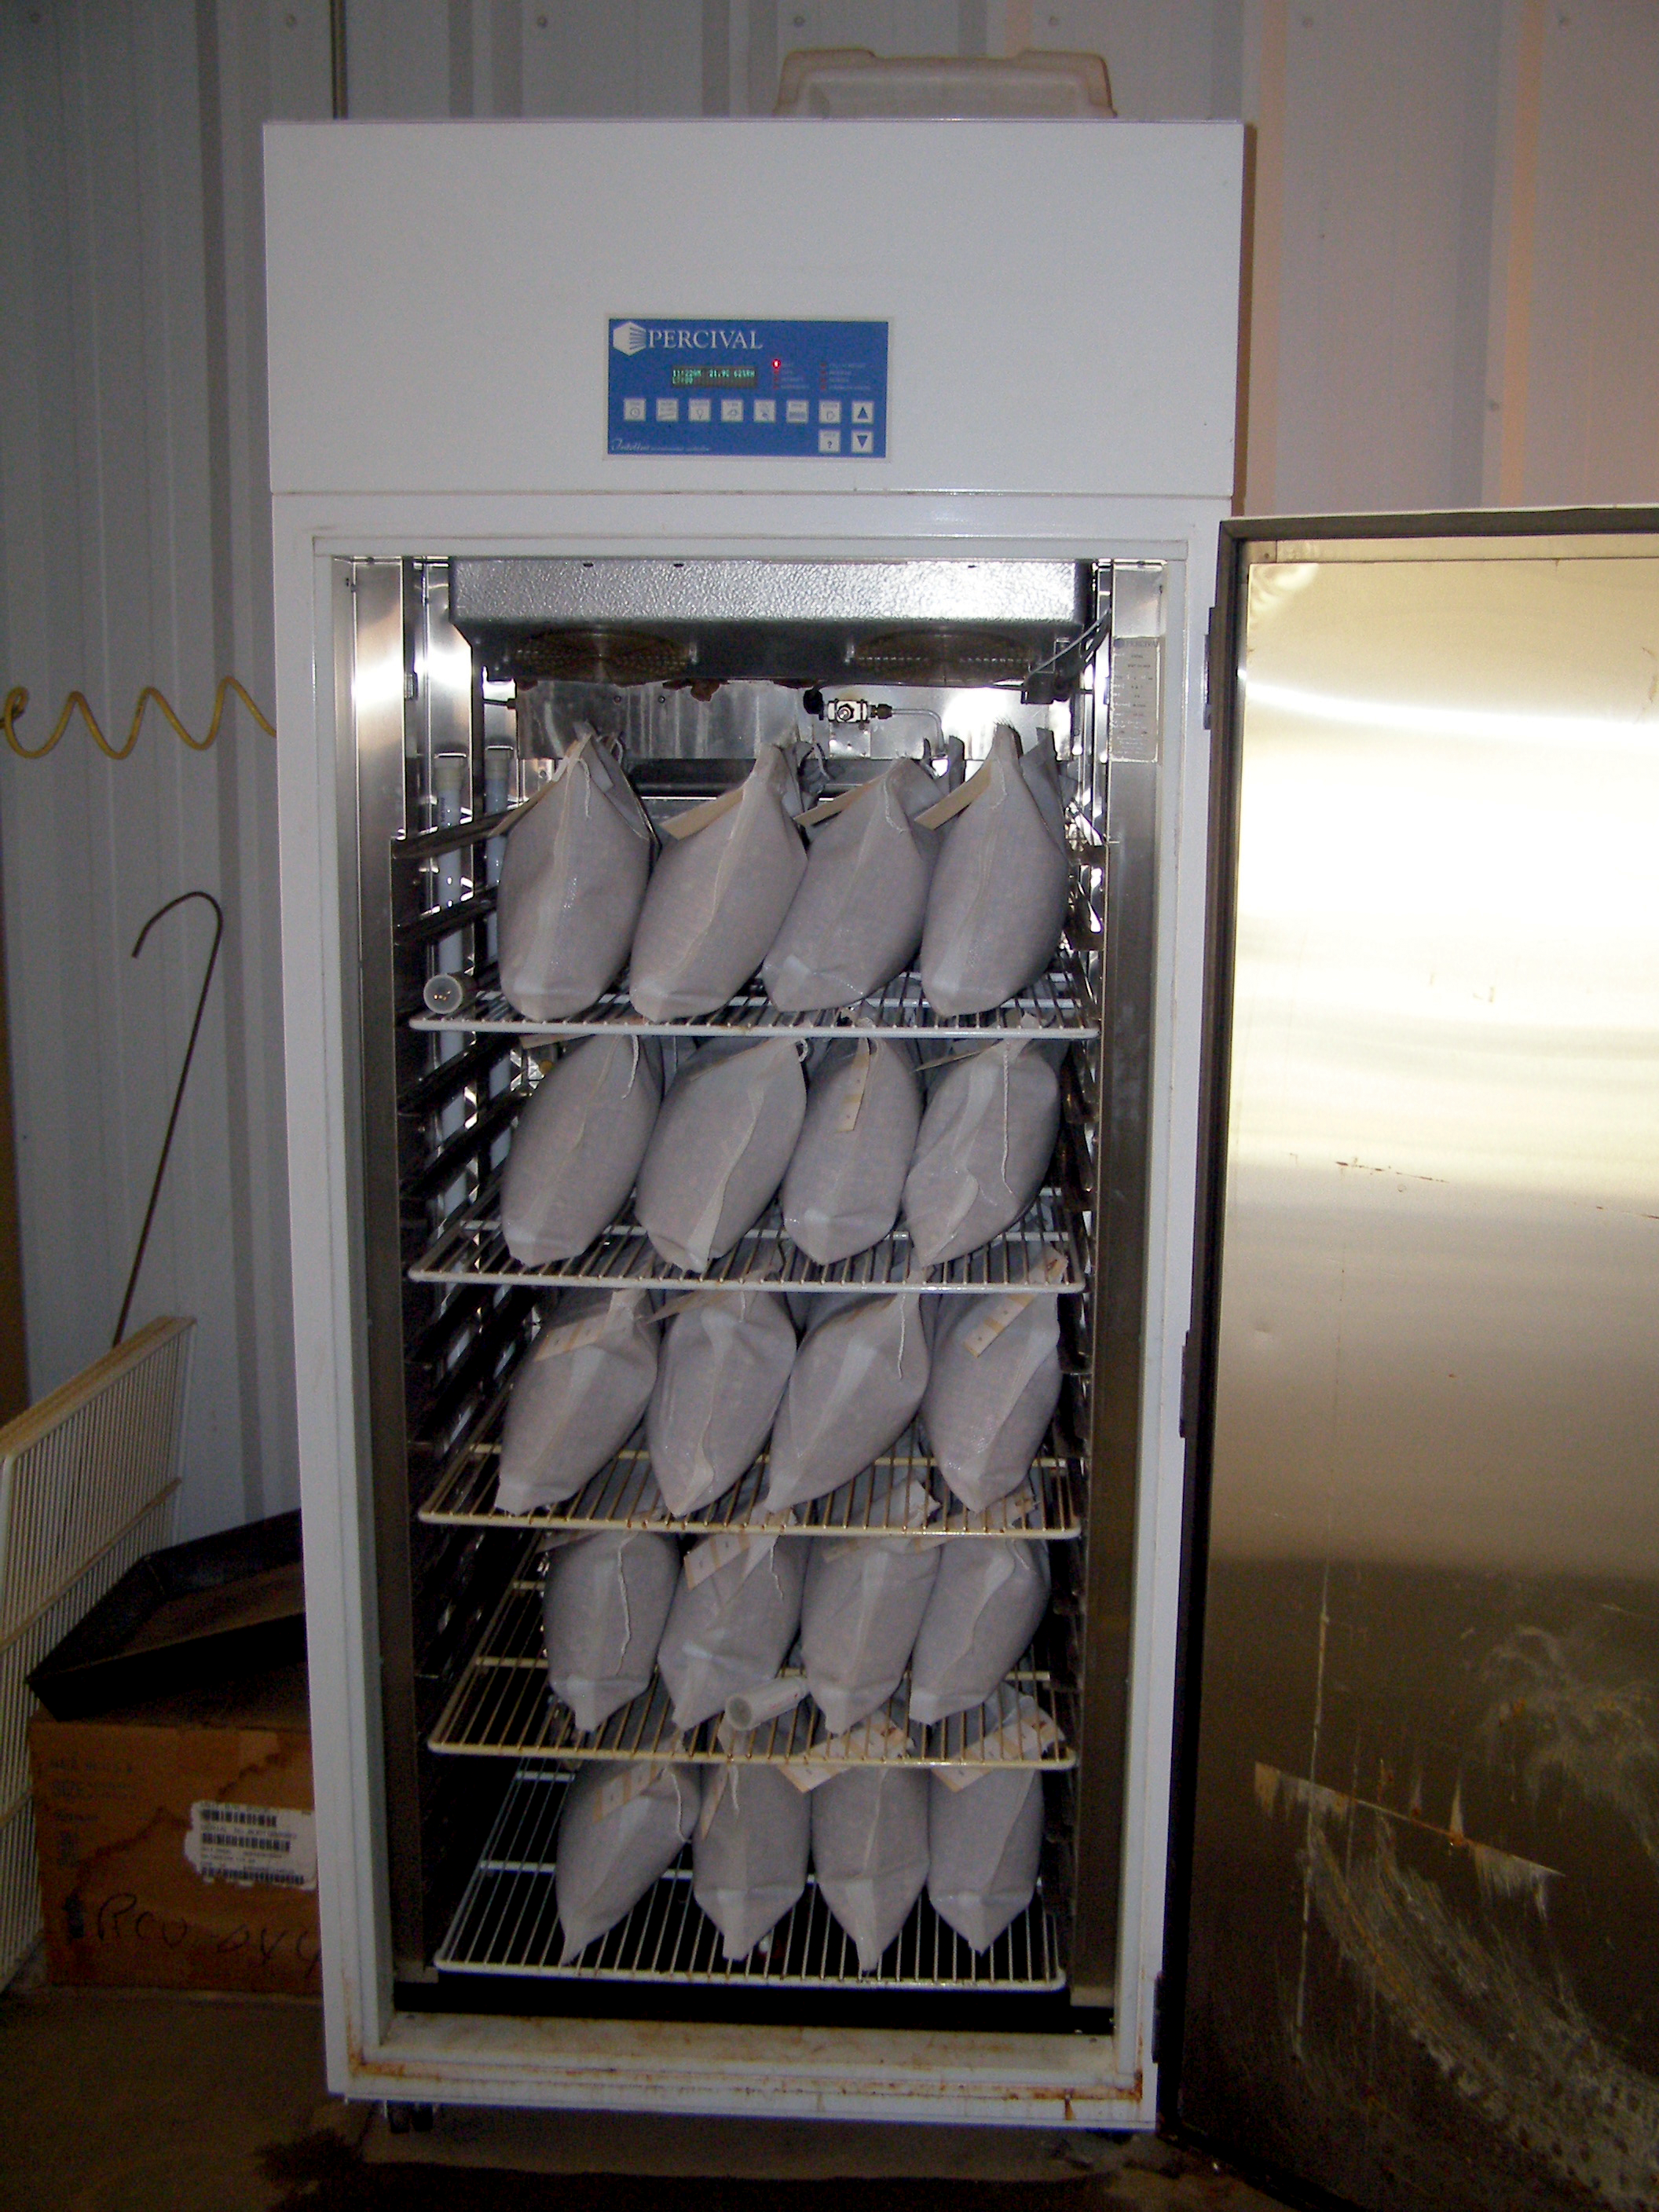
Placement of samples in controlled environment chamber for studies to determine effect of storage conditions of chemical, sensory, and germination characteristics of shelled peanuts.
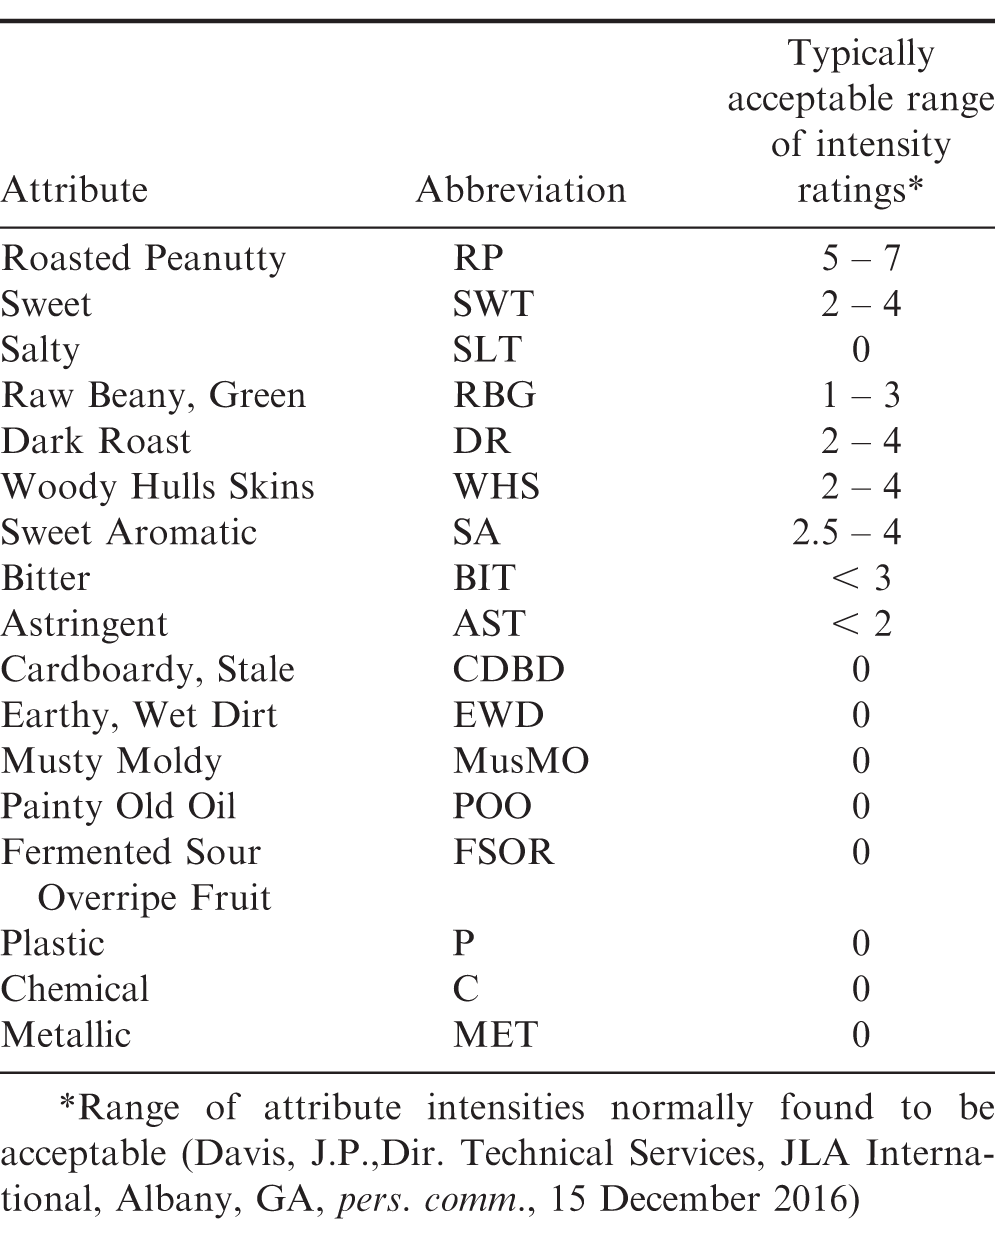
Lexicon of peanut flavor attributes used in the sensory evaluations of samples from alternative storage environments for shelled peanuts.
Sampling schedule for small chamber tests of alternative shelled peanut storage environments.
Commercial Experiments.
Using peanuts from normal shelling operations, six totes were filled with mill run runner type peanuts according to conventional practice. Immediately after filling, but prior to closing, a 200-g sample was removed from the top of the tote to determine the moisture content ( w.b.) and the water activity (aw). A datalogger (Hobo Model U23-001, Onset Computers, Bourne, MA) to record temperature and relative humidity and a leaf wetness sensor (Model LWS, Decagon Devices Inc., Pullman, WA) were placed in a small mesh bag containing 200-300 g of shelled peanuts from the tote, then worked into the top 5 cm of peanuts in the tote. The lead wires of the leaf wetness sensor extended out through the filler neck of the tote. The leaf wetness sensors are a resistance grid embedded in a leaf shaped composite to simulate the leaf surface and have been used in agronomic research to monitor the presence of condensation on leaves in a plant canopy. While these sensors do not have the same heat transfer and surface shape or texture as the shelled peanuts, it was hypothesized that they might indicate the presence of condensation on the peanuts in the top of the totes.
Three totes were stacked in a cold storage facility maintained at 3 C and 65 relative humidity (Figure 3). The remaining three totes were stacked in a cold storage facility at the same location maintained at 13 C and 65 relative humidity. A fourth temperature and relative humidity datalogger, and leaf wetness sensor was placed on the outside of the middle bag in each stack. All leaf wetness sensors were monitored using a CR23X datalogger (Campbell Scientific, Inc., Logan, UT). After 30 d in storage, the totes were unstacked and a 200-300 g sample was retrieved from each tote then returned to its original stacked position. After 60 d in storage, the totes were unstacked, samples retrieved from each tote and all instrumentation removed from each tote, and the peanuts reprocessed or disposed of in accordance with current regulations. The 30 and 60-d samples were evaluated immediately after retrieval to determine moisture content, water activity, and presence/absence of post harvest insects. Tests were repeated every 60-days throughout the year according to the schedule shown in Table 3.
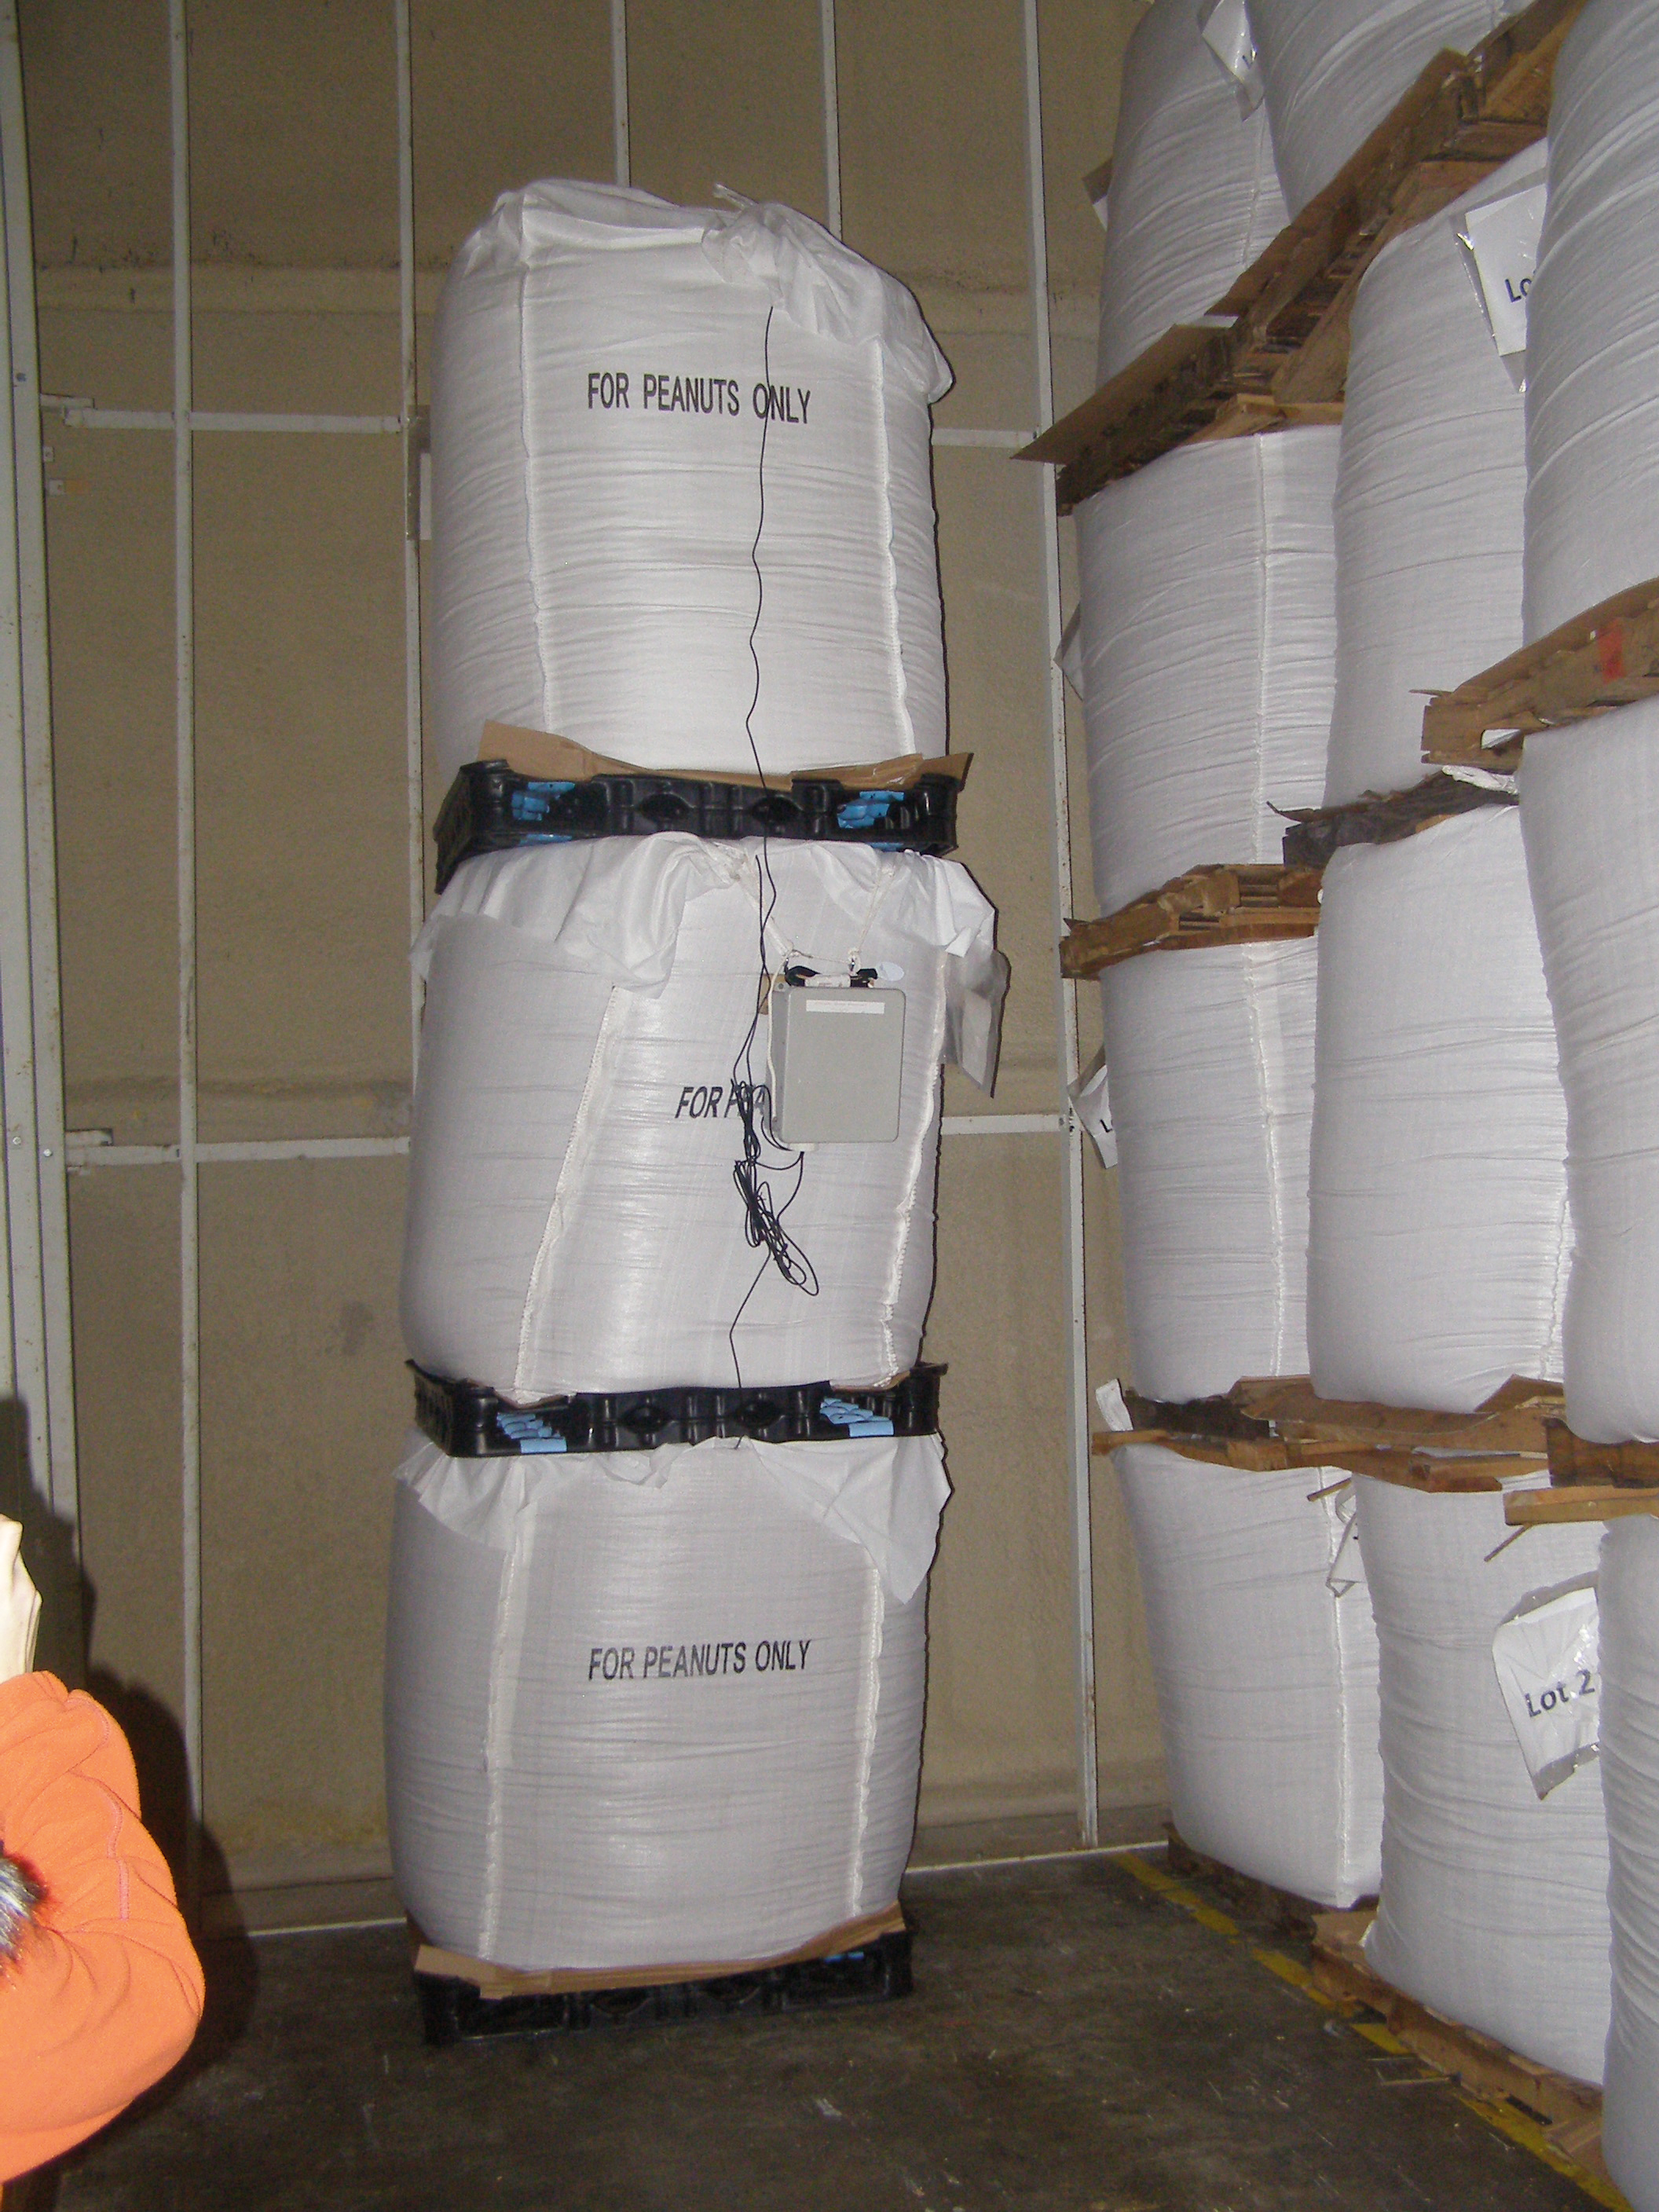
Totes instrumented with temperature, relative humidity, and leaf wetness sensors stacked in a commercial cold storage facility to determine the effect of storage conditions on the moisture content, water activity, and the occurrence of mold during storage.
Sampling and test schedule for storing shelled peanuts in alternative environments at commercial storage facilities.
Results and Discussion
Small Chamber Results.
Summary statistics of the temperature and relative humidity in each of the small chamber storage environments are shown in Table 4. The average temperatures within each of the test chambers were maintained within 1 C the desired temperature. After approximately 145 d in storage, the sensors in the 13 and 21 C chambers indicated that the temperature was exceeding the desired temperature by at least 5 C (Figure 4). Examination of the dataloggers indicated that the batteries in the datalogger had failed and were replaced. The temperature within each of the chambers was very stable as indicated by the standard deviation of 1.3 C or less in all chambers (Table 4). The ambient weather data was obtained from an agricultural weather station located approximately 6 km East of the National Peanut Research Laboratory at the Hooks Hanner Environmental Resource Center (UGA 2017). The ambient temperature was highly variable compared to the internal temperature of the storage units (Figure 4). The stability of the chamber temperatures compared to the ambient temperature indicates that the chamber temperature controls and thermal insulation was quite adequate for this study.
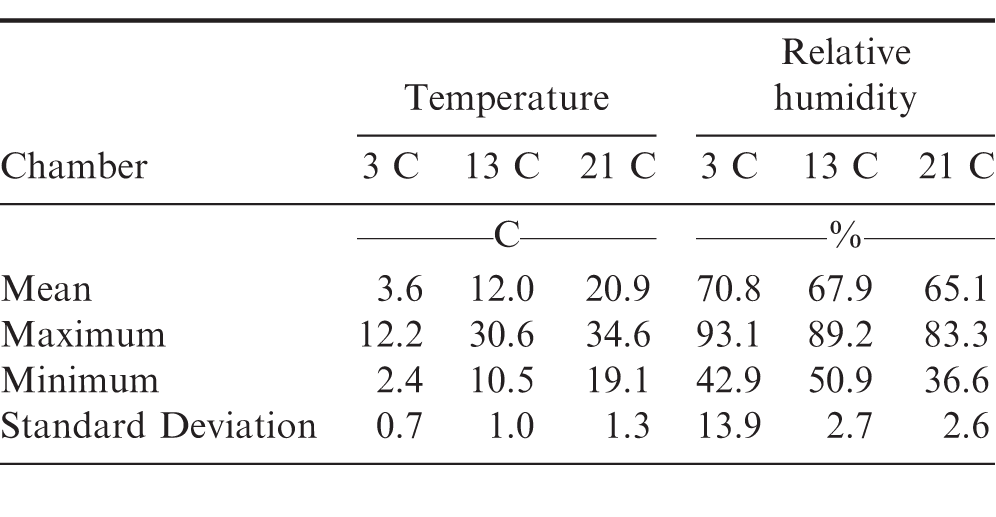
Summary statistics for the temperature and relative humidity in the small controlled environment chambers for the shelled peanut storage study.
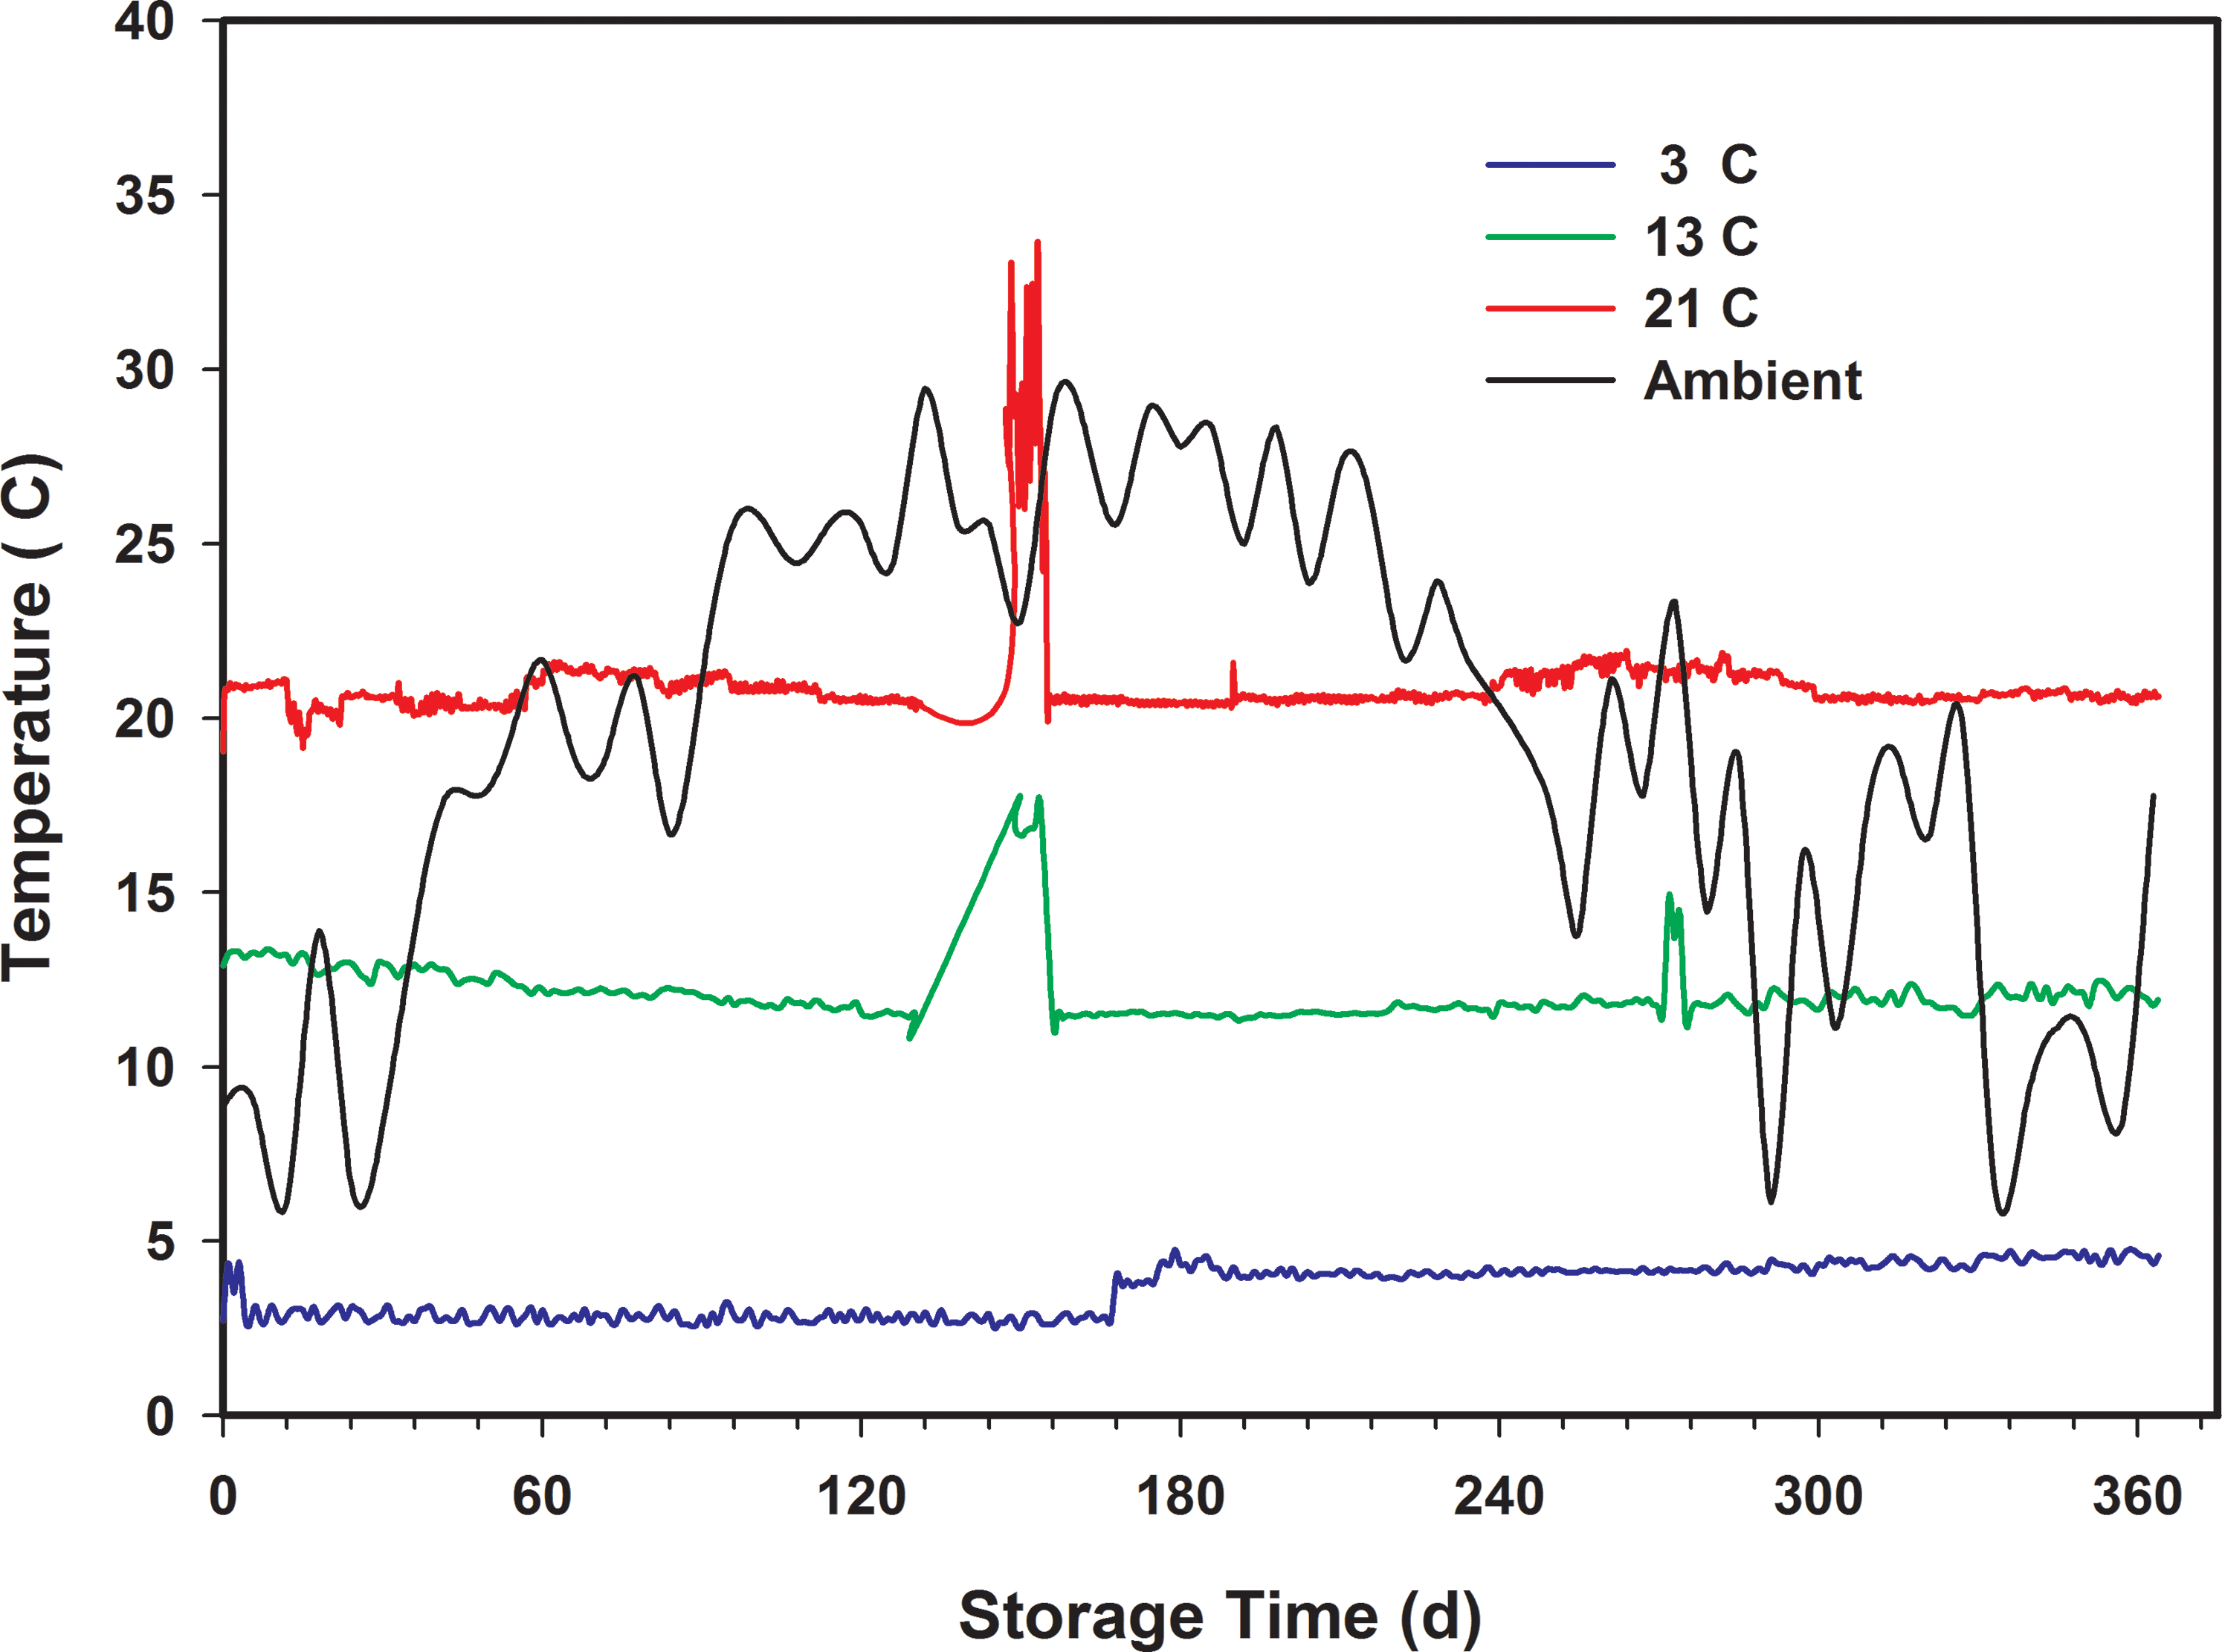
Temperature measured at the Hooks Hanner Environmental Resource Center and in controlled environment chambers for 360-d storage tests for shelled peanuts.
The relative humidity in the small controlled environment chambers (13 and 21 C) was considerably more stable than in the walk-in cooler (3 C). Table 4 shows that the average relative humidity in the 13 and 21 C chambers was 67.9 2.7 and 65.1 2.6, respectively. However, in the 3 C walk-in cooler, the relative humidity was 70.8 13.9 (Table 4). The average relative humidity also continually increased during the first 120 d from its initial value of approximately 65 to between 85 and 90 (Figure 5). This was most likely due to infiltration of ambient air through the seams of the wall and floor panels of the walk-in cooler and is indicated by the high dew point temperature of the ambient air (Figure 4) compared to the internal chamber temperature. The ambient dew point temperature almost always exceeded the chamber temperature. The cooling equipment for the walk-in cooler was primarily designed to remove heat (i.e. decrease the temperature) but not designed for humidity control. A standalone dehumidifier was placed in the walk-in cooler after approximately 180 d into the storage period after which the relative humidity immediately decreased from an average of 85 to 75. The relative humidity continued to gradually decrease to approximately 50 by the end of the storage tests.
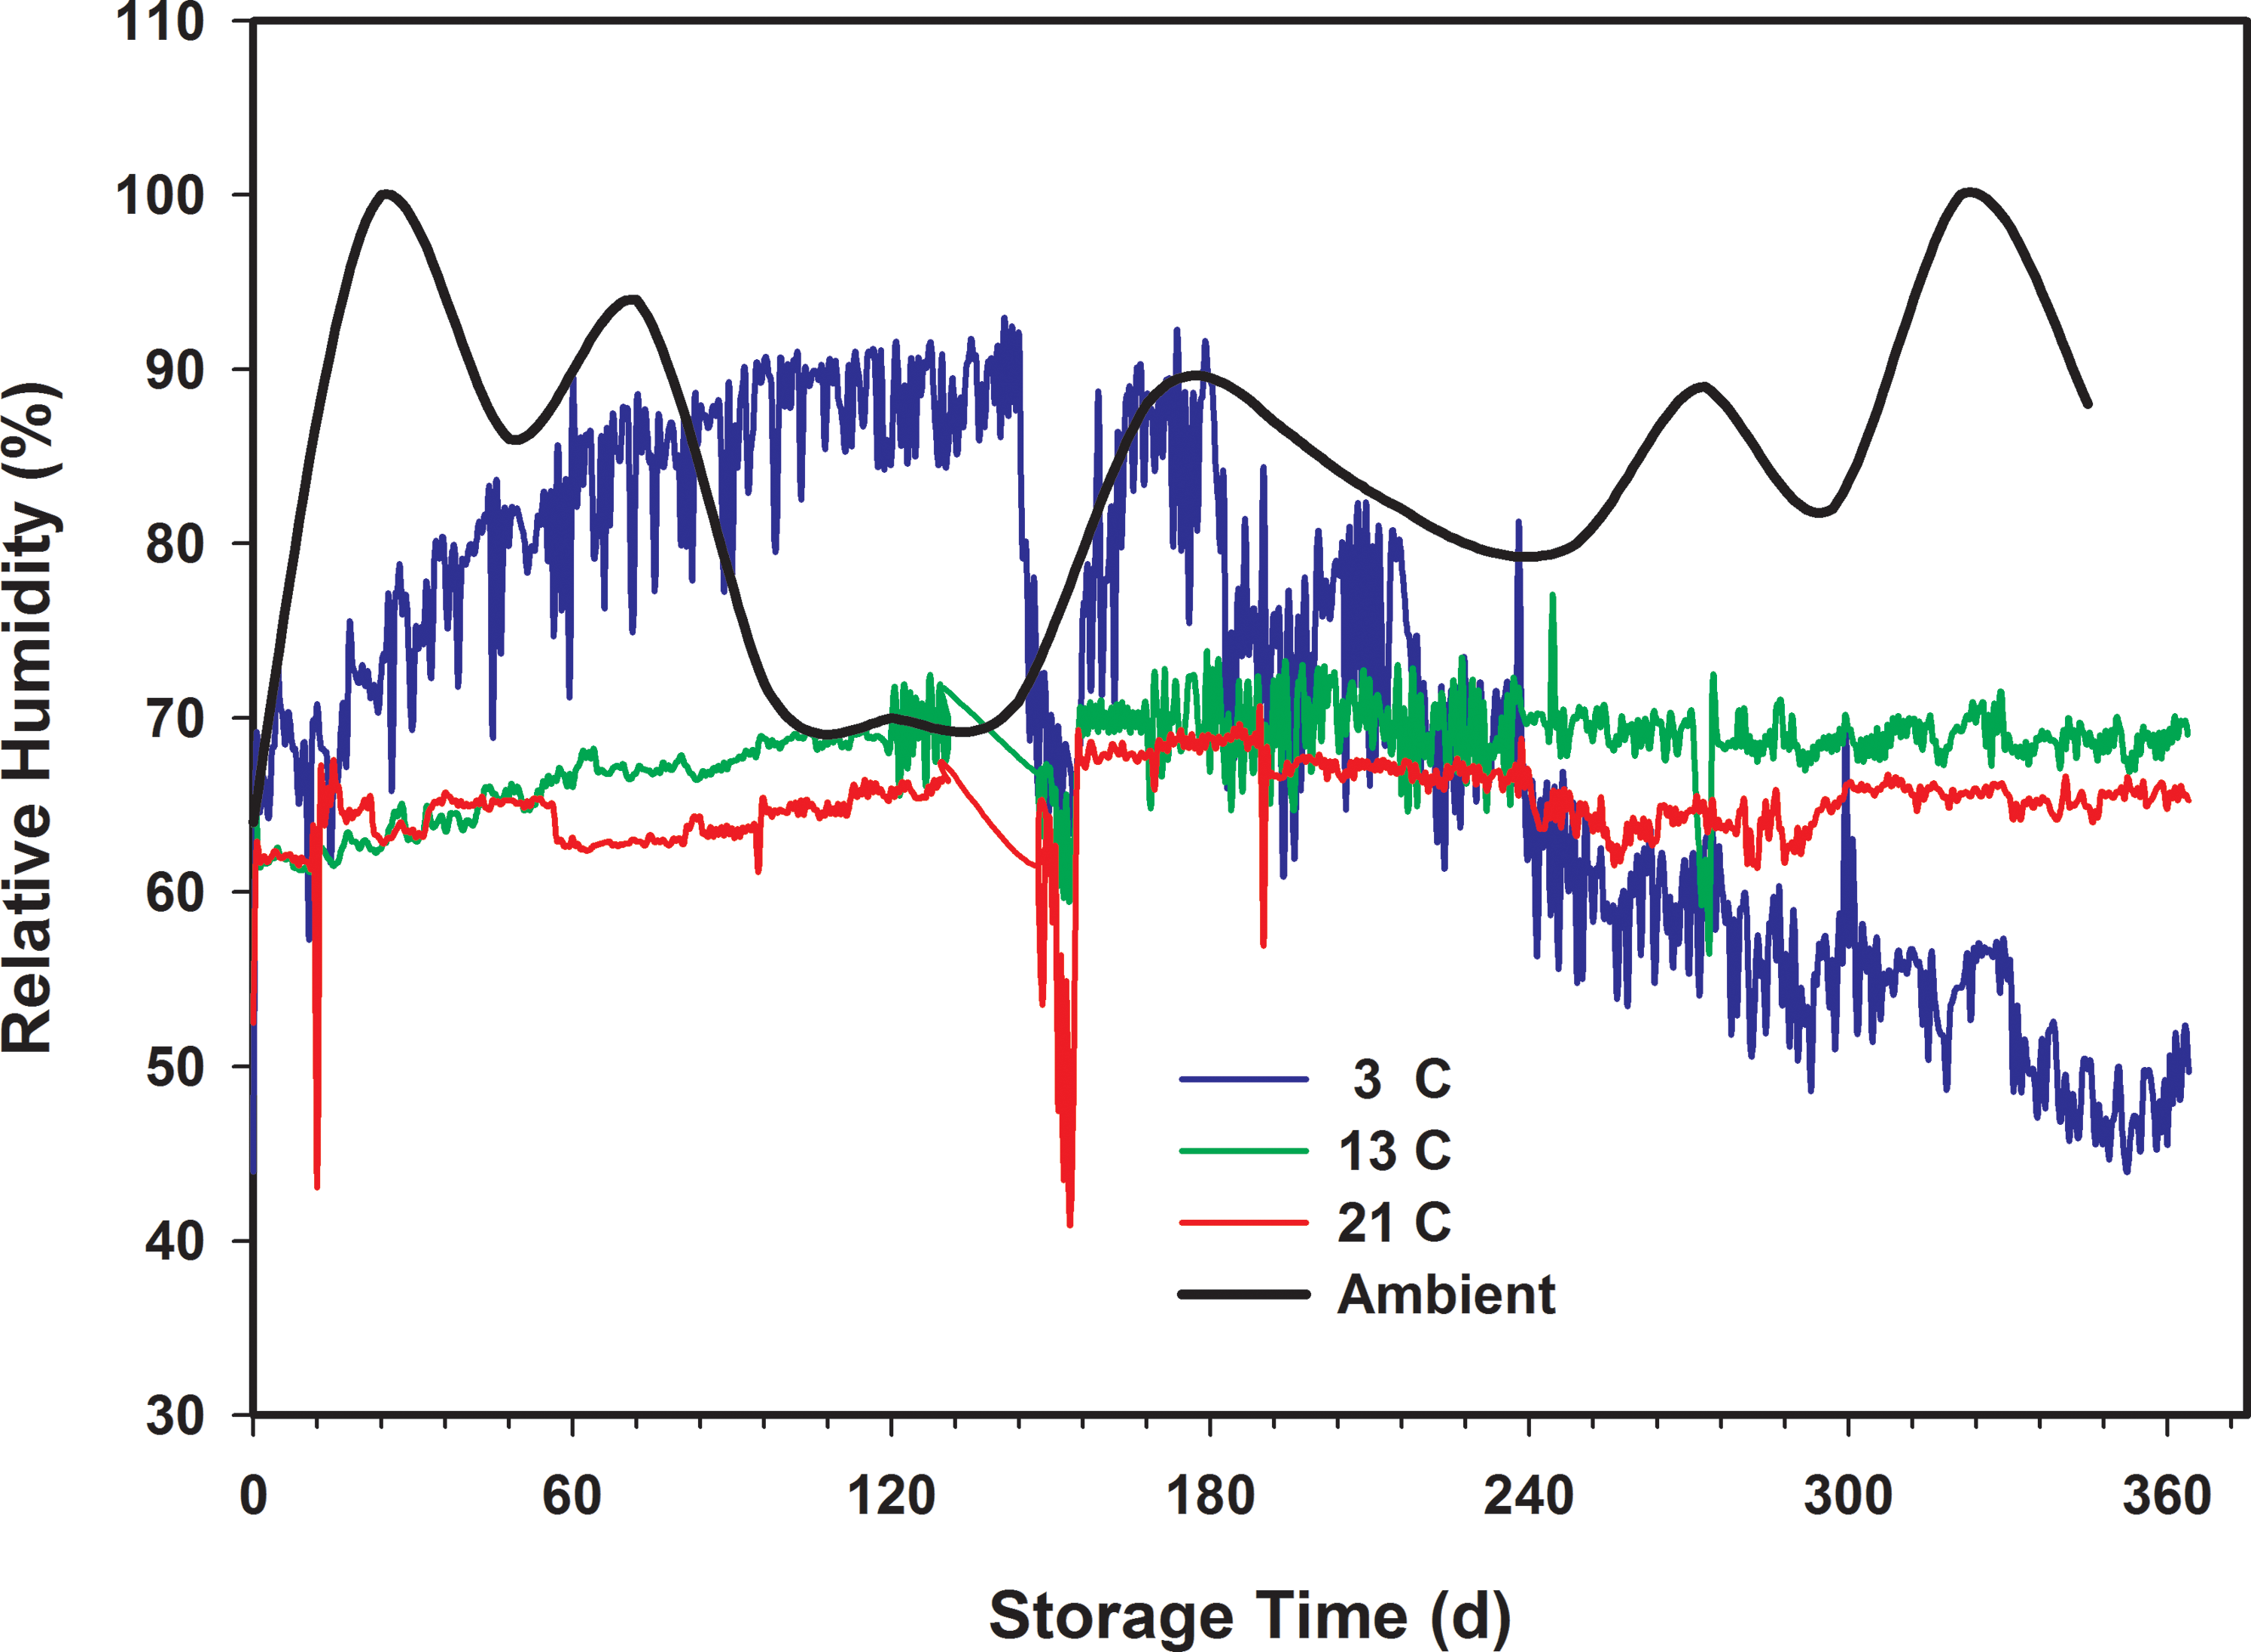
Relative humidity measured at the Hooks Hanner Environmental Resource Center and in the controlled environment chambers for 360-d storage tests for shelled peanuts.
There were no significant changes in the quality of the peanuts stored in the 13 C chambers. However, active mold growth was observed in one of the three the samples retrieved from each of the 3 and 21 C chambers after 180 d storage. The mold growth in the 3 C sample was directly related to the excessive relative humidity (Figure 5) in the walk-in cooler that resulted in an increase in the peanut moisture content and water activity (Figure 6). The initial moisture content of the peanuts when placed in storage was approximately 6.5. The moisture content of the peanuts stored at 3 C increased to an average of approximately 11 after 120 d storage (Figure 6a). When sampled after 180 d of storage, the average moisture was approximately 10. Similarly, the water activity increased from 0.60 to an average 0.83 after 120 d storage time (Figure 6b). At 180 d storage, the water activity had decreased, but still exceeded 0.70. This prolonged elevated water activity was conducive to mold growth (Gibson, Baranyi et al. 1994). The moisture content of peanuts stored at 13 C remained nearly constant for the first 30 d of storage, then increased to approximately 7 after 120 d storage and remained there through 300 d storage. The peanut moisture content for peanuts stored at 21 C remained at or below 6.5 for the duration of the test. Therefore, an elevated moisture content or water activity does not explain the presence of mold in the 21 C samples after 180 d storage. There were live Indian meal moth (Plodia interpunctella (HBNER)) observed inside the sample bags stored at 21 C. Normally the lifecycle of Indian meal moth is 14-21 d depending on temperature (Redlinger and Davis 1982). According to Bell (1994), diapause in Indian meal moth can be induced by low temperatures and may be ended by elevated temperatures above 25 C and photoperiods in excess of 13-14 h. The peanuts used in these tests were from the 2014 crop, were shelled in early February 2015 with relatively cold temperatures quite possibly causing any eggs or larvae to enter into diapause. The cabinet temperature of 21 C was near that known to end diapause, but the cabinet was dark except when the door was opened to retrieve samples. Therefore, the lifecycle of any Indian meal moth in the samples may have been prolonged. Indian meal moth infestation in the 21 C chamber continued to increase from 180 d until the end of the test.
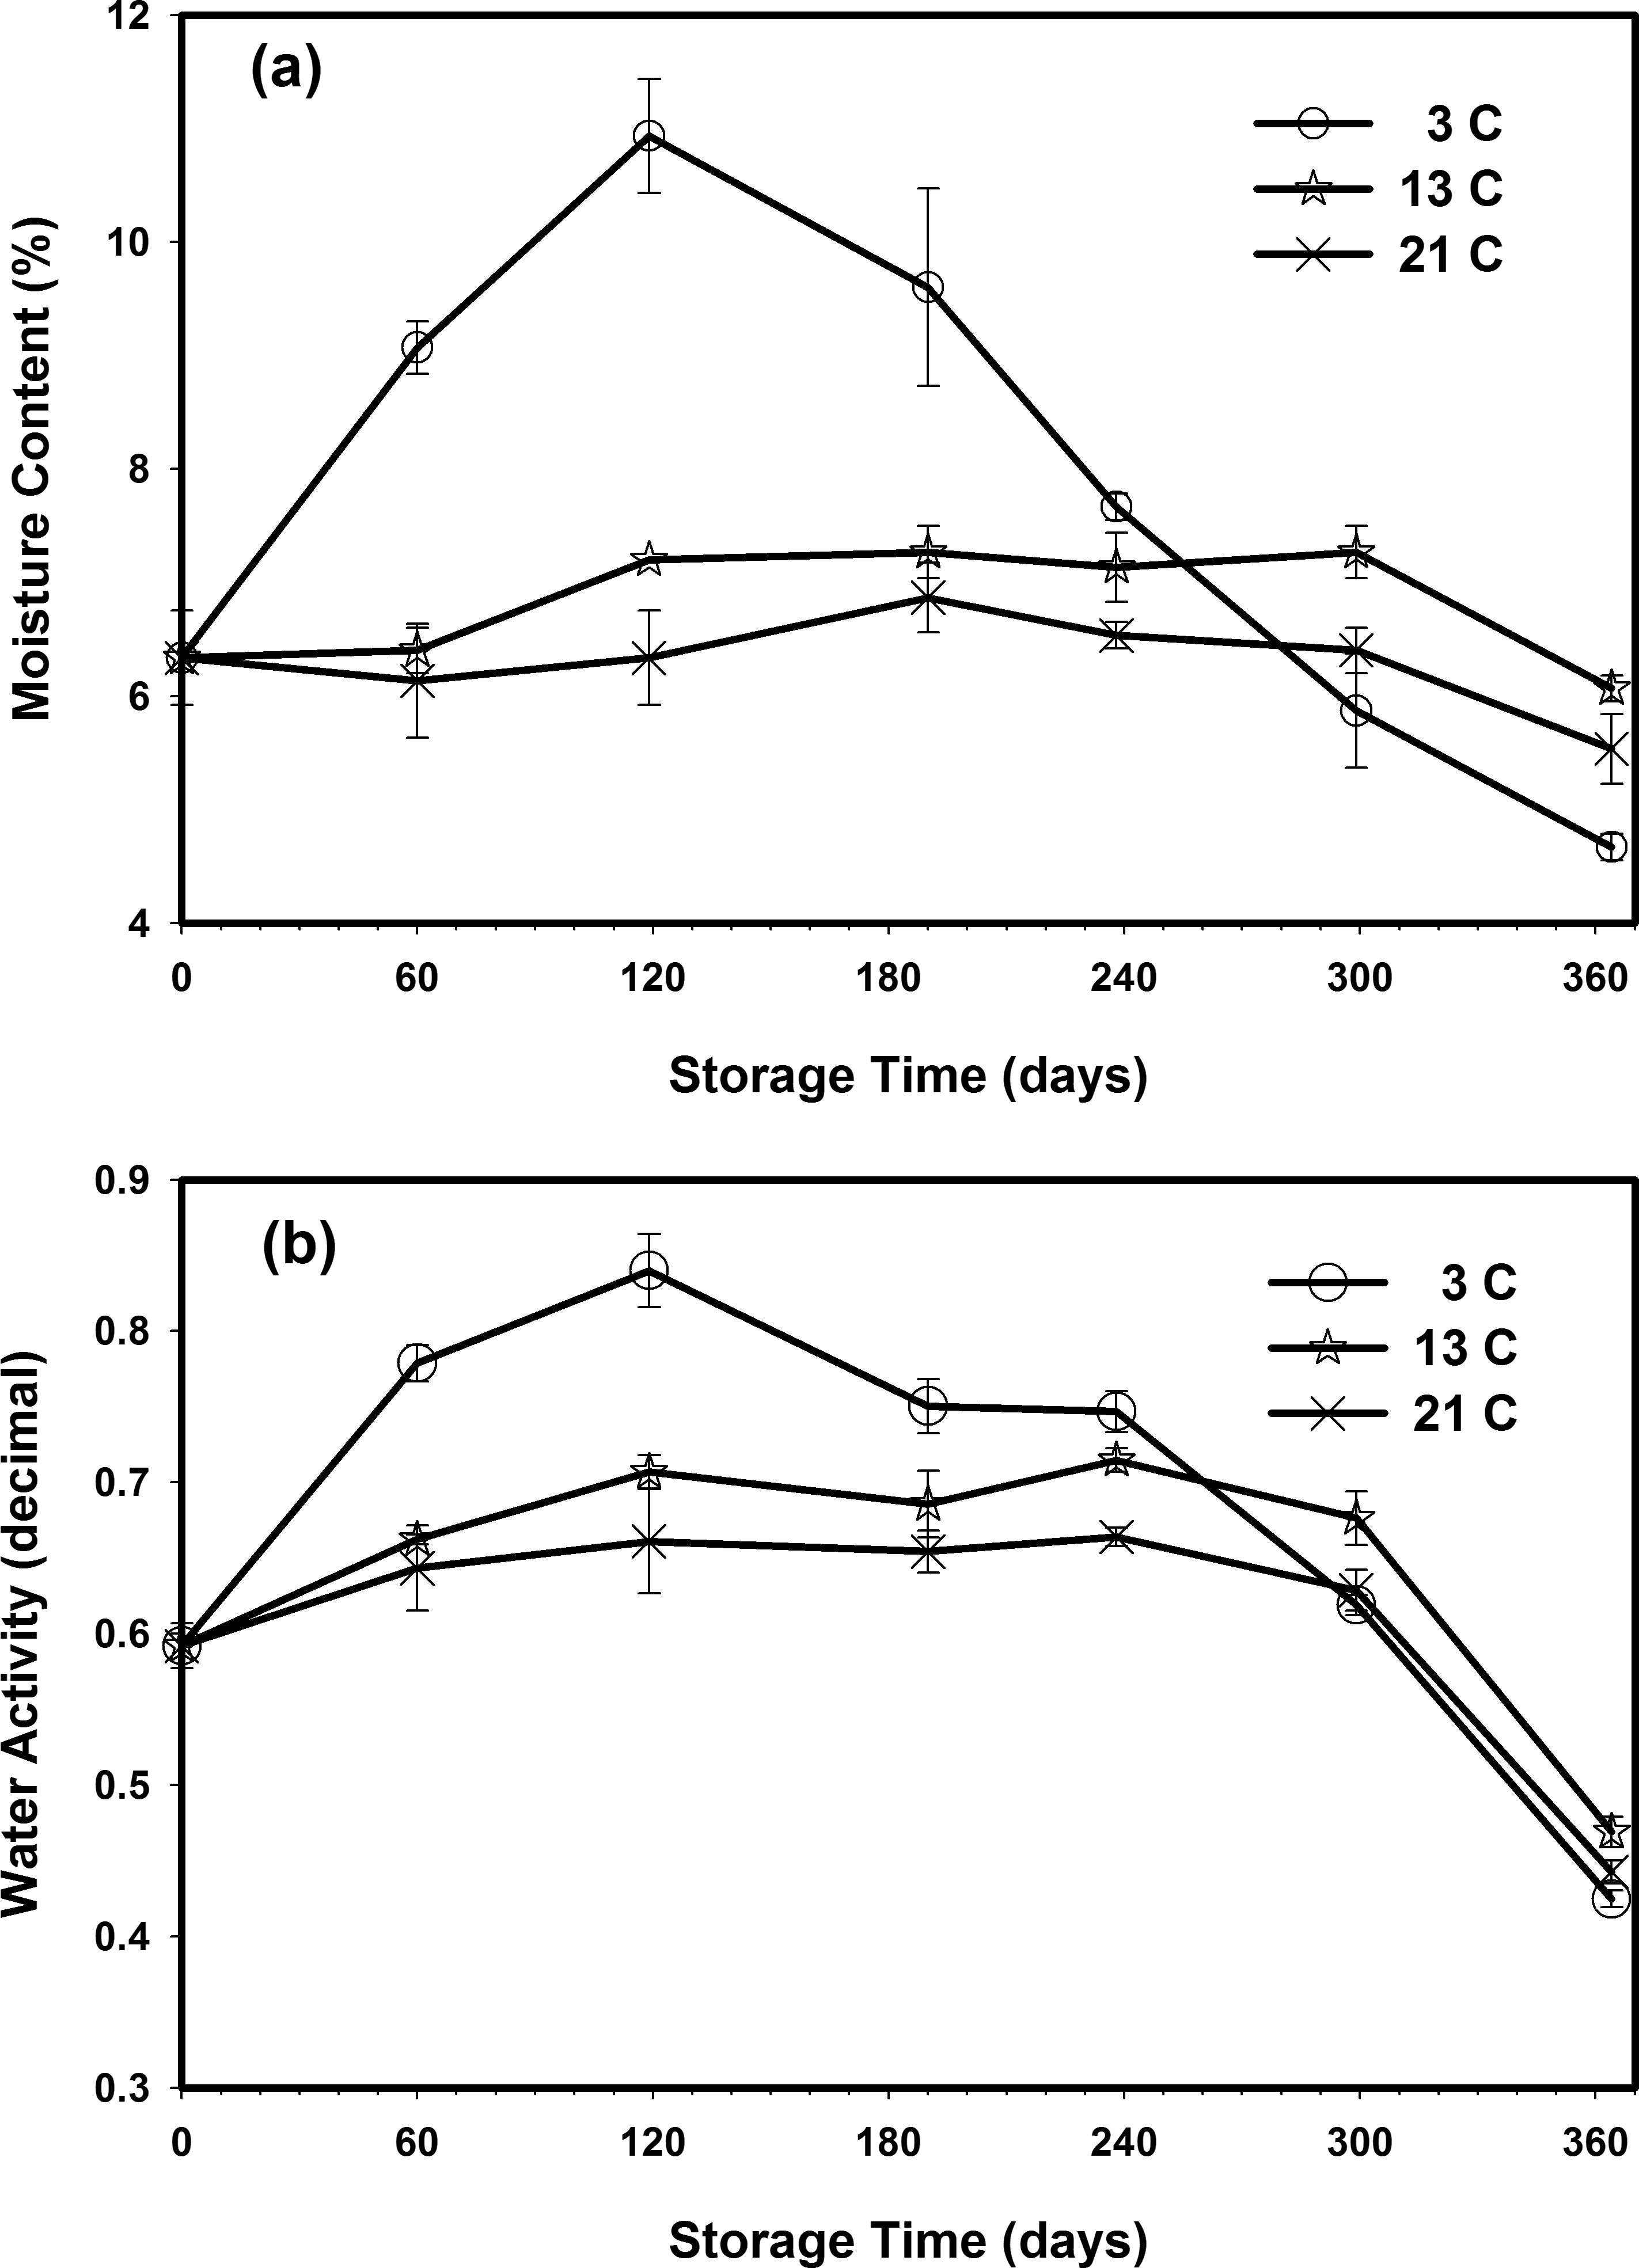
Average moisture content (a) and water activity (b) of peanut samples retrieved from storage chambers maintained at 3, 13, and 21 C sampled every 60 d for 360 d.
Analysis of variance (PROC GLM, SAS v9, Cary, NC) indicated that storage time had a significant effect ( 0.05) on 10 out of 17 of the flavor attributes, free fatty acid, peroxide value, and the seed germination (Table 5). Storage temperature had a significant effect ( 0.05) on the Fermented Sour Overripe Fruit (FSOR) attribute, free fatty acid (FFA), peroxide value (PV), and seed germination. If 0.10, then it also had an effect on the Roasted Peanutty (RP) attribute. Depending on the significance level, the interaction between storage temperature and storage time affected RP, Dark Coffee Roast (DR), and Bitter (BIT) flavor attributes, and the FFA and seed germination. The sample or replicate had a very strong effect ( Prob F < 0.0001) on the FSOR attribute because there was only 1 sample out of 57 that had a non-zero intensity. The sample also had a slightly significant effect on the BIT flavor attribute and the FFA.
Analysis of variance of raw sensory attributes, free fatty acid, peroxide value, and seed germination due to storage time, storage temperature, and sample.
Because there was no dependence on storage temperature, the attribute intensities were averaged over all storage temperatures at each sampling date (Table 6, Figures 7 and 8). The RP flavor intensity was initially 5.80, had minor variations throughout the storage period, and decreased to 5.23. While the 0.57 decrease in RP intensity was significant, it remained in the acceptable range (Table 1). The Sweet (SWT) attribute showed slightly more significant variations (Table 6) throughout the 364 d storage period, however the changes were not linear over time (Figure 7). SWT was initially 2.20 and increased to 3.03 after 60 d, then gradually decreased to 1.78 after 364 d storage. The final SWT intensity was slightly below the minimum acceptable threshold of 2 (Table 1) and might be of concern to some customers. The Raw Beany Green (RBG) attribute is normally between 1 and 3. In this study, RBG was initially 1.73 and varied slightly throughout the storage period with a minimum of 0.71 at 238 d and maximum of 1.88 at 299 d. The final RBG intensity was 0.85, significantly lower than the initial value and slightly below the normal acceptable range. The flavor attributes of Woody Hulls Skins (WHS), Bitter (BIT), and Astringent (AST) are present in peanuts and if too high (Table 1) may be considered off-flavors. There were slight variations in all of these attributes and had a tendency to decrease over time (Figure 8). All the attributes listed below AST in Table 1 are off-flavors and should be undetectable (Intensity0). The Earthy Wet Dirt (EWD) attribute was undetectable throughout the study except for one sample at 60 d. The average EWD intensity was 0.13 and not significant from undetectable (Table 6). A similar event occurred with the Fruity, Sour Overripe (FSOR) attribute. The mean intensity after 119 d was 0.18 and caused by a single sample from the 3 C with an FSOR intensity of 1.6. All other off-flavors were undetectable.
Mean flavor attribute intensities averaged over all storage temperatures.
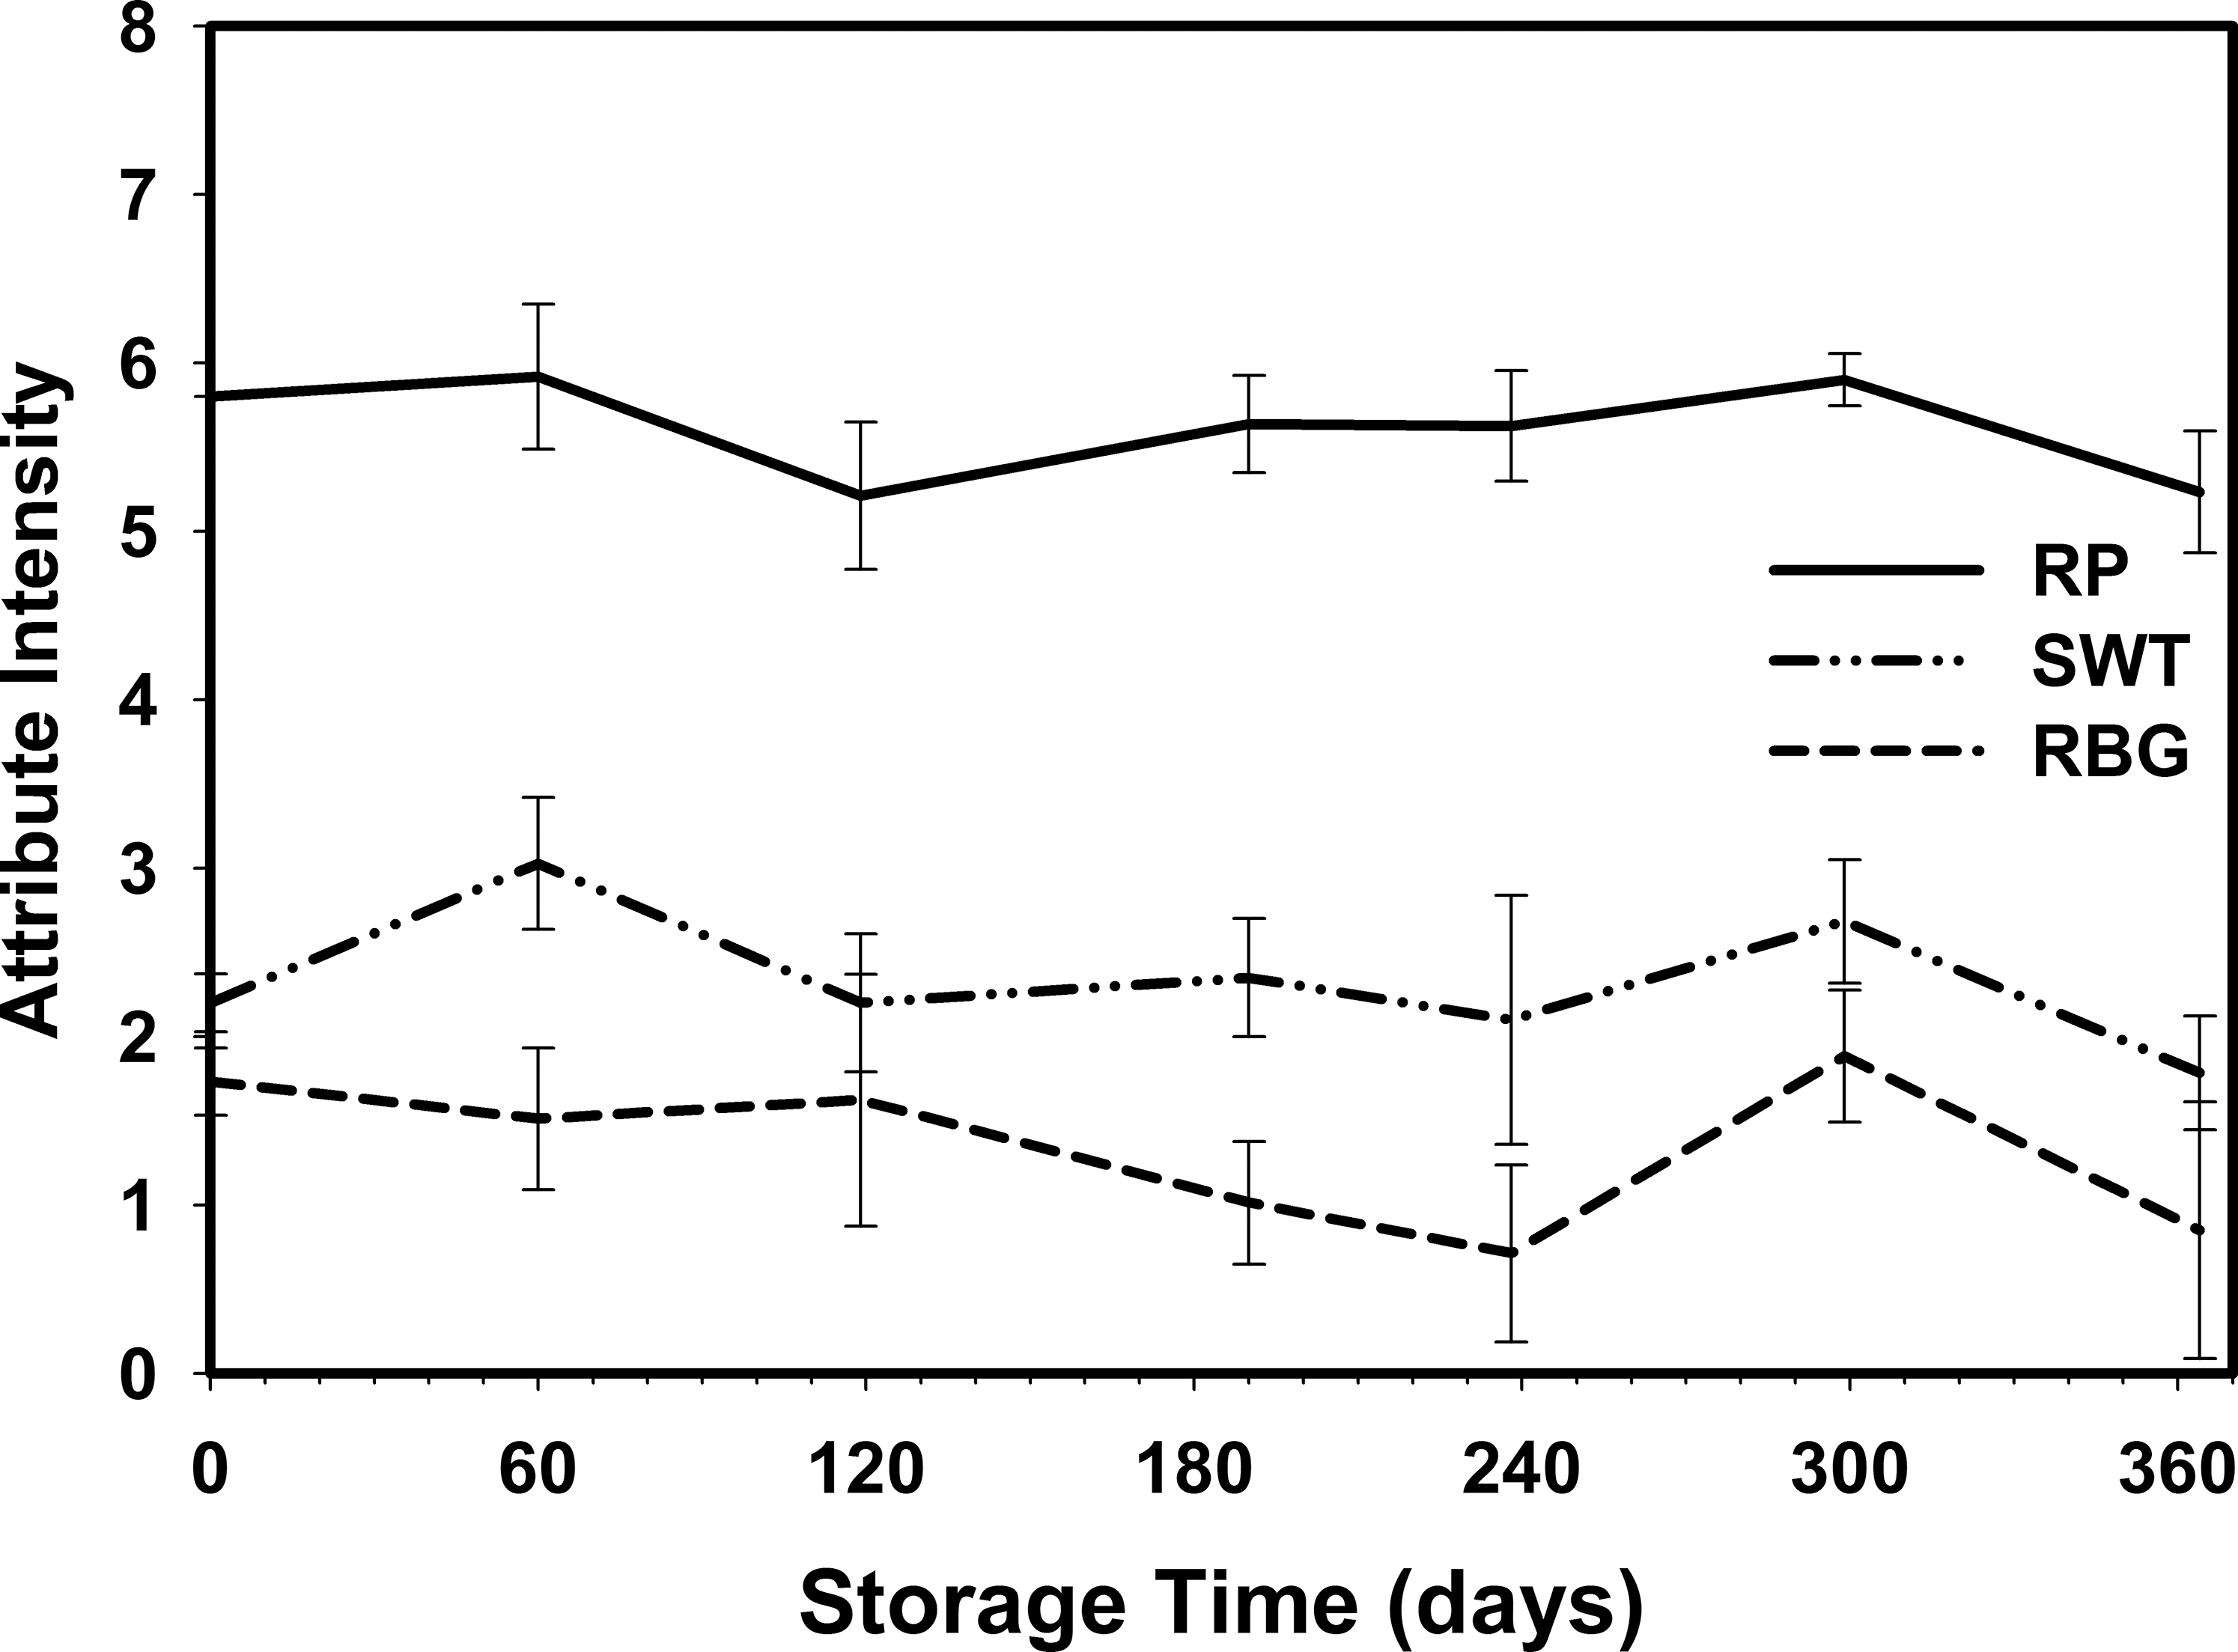
Intensity scores for flavor attributes of Roasted Peanutty (RP), Sweet (SWT), and Raw Beany Green (RBG) for shelled peanuts stored for 364 d in controlled environment chambers. Data points represent the mean of scores averaged over all storage temperatures.
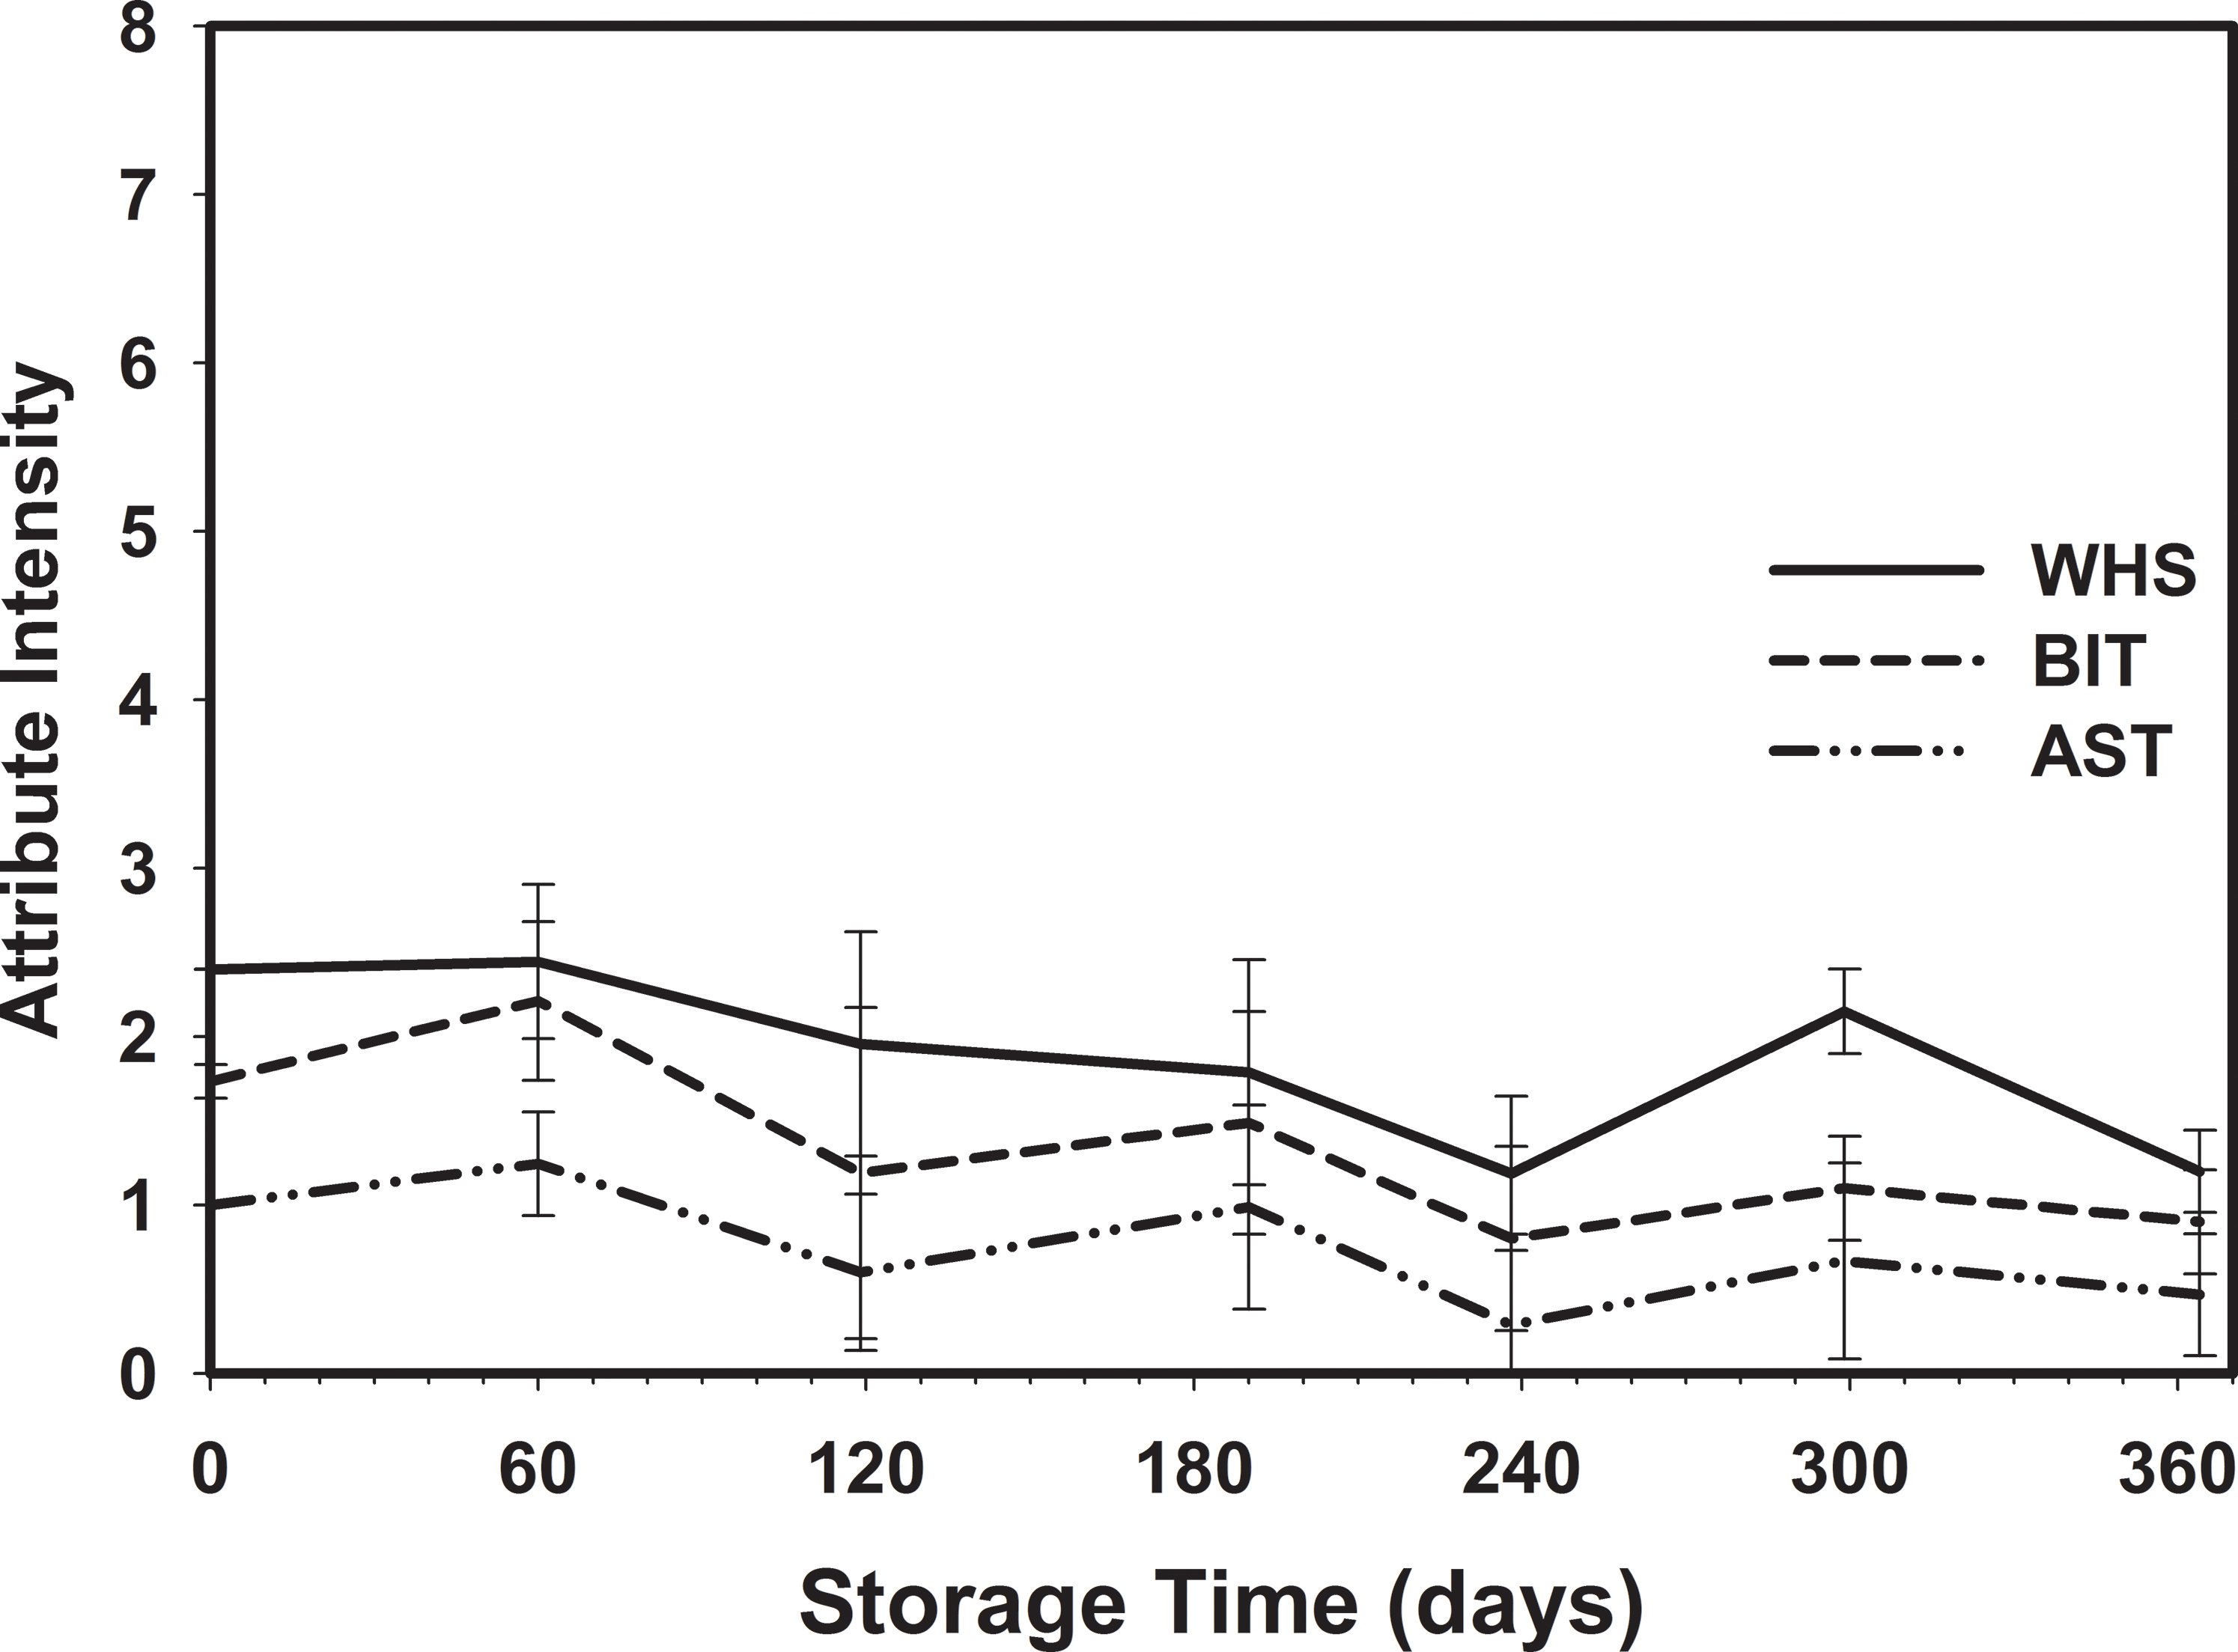
Intensity scores for flavor attributes of Woody Hulls Skins (WHS), Bitter (BIT), and Astringent (AST) for shelled peanuts stored for 364 d in controlled environment chambers. Data points represent the mean of scores averaged over all storage temperatures.
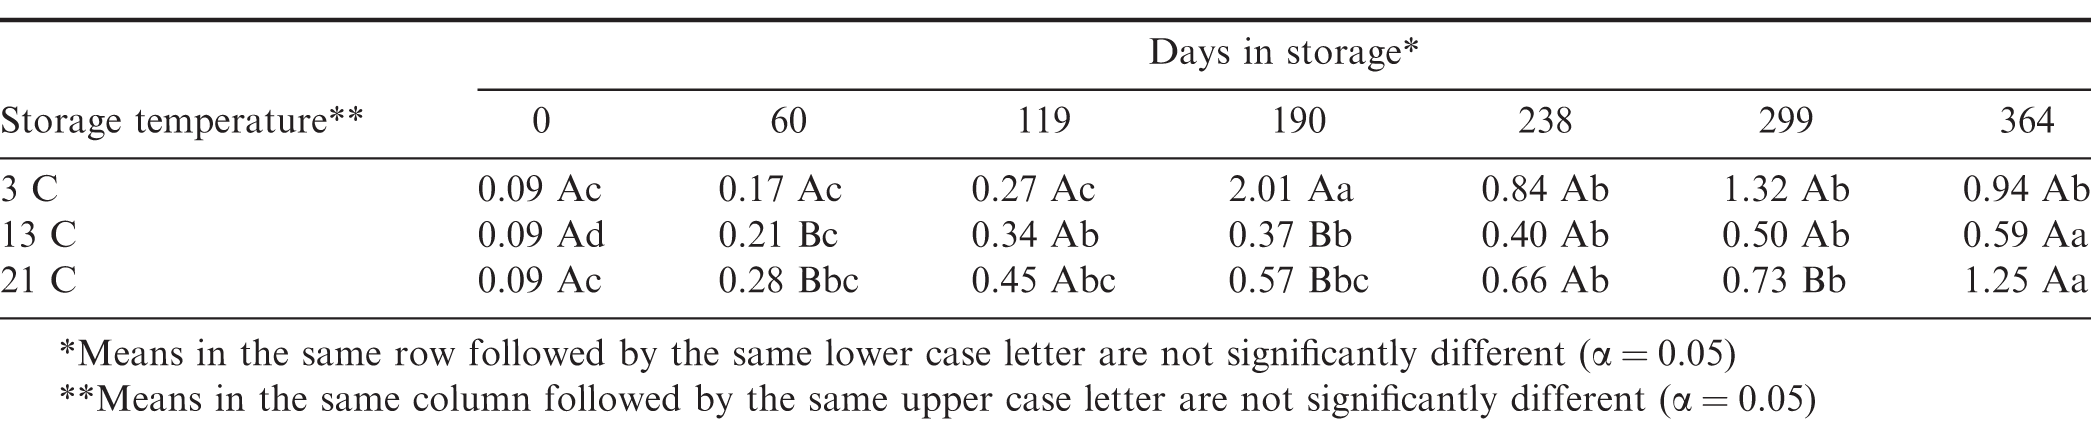
The percent free fatty acids (FFA) and peroxide values (PV) are both indicators of oxidative degradation of the oil in the peanuts. The FFA tended to increase during the 364 d storage period for all storage temperatures (Figure 9). The percent FFA was 0.09 when the peanuts were placed in storage and there were slight significant increases at 13 and 21 C during the first 119 d of storage (Table 7), however there was no difference due to storage temperature. After 190 d storage, the FFA at 3 C spiked at 2.02 and was significantly higher than that measured at 13 and 21 C. This marked increase in FFA was due to the prolonged exposure to relative humidity greater than 70 and the resulting increase in moisture content and mold growth in the 3 C samples. After 364 d storage there was no significant difference due to storage temperature in the mean FFA for peanuts stored at 3 C (0.94), 13 C (0.59), and 21 C (1.25), but all three means were larger than the starting 0.09.
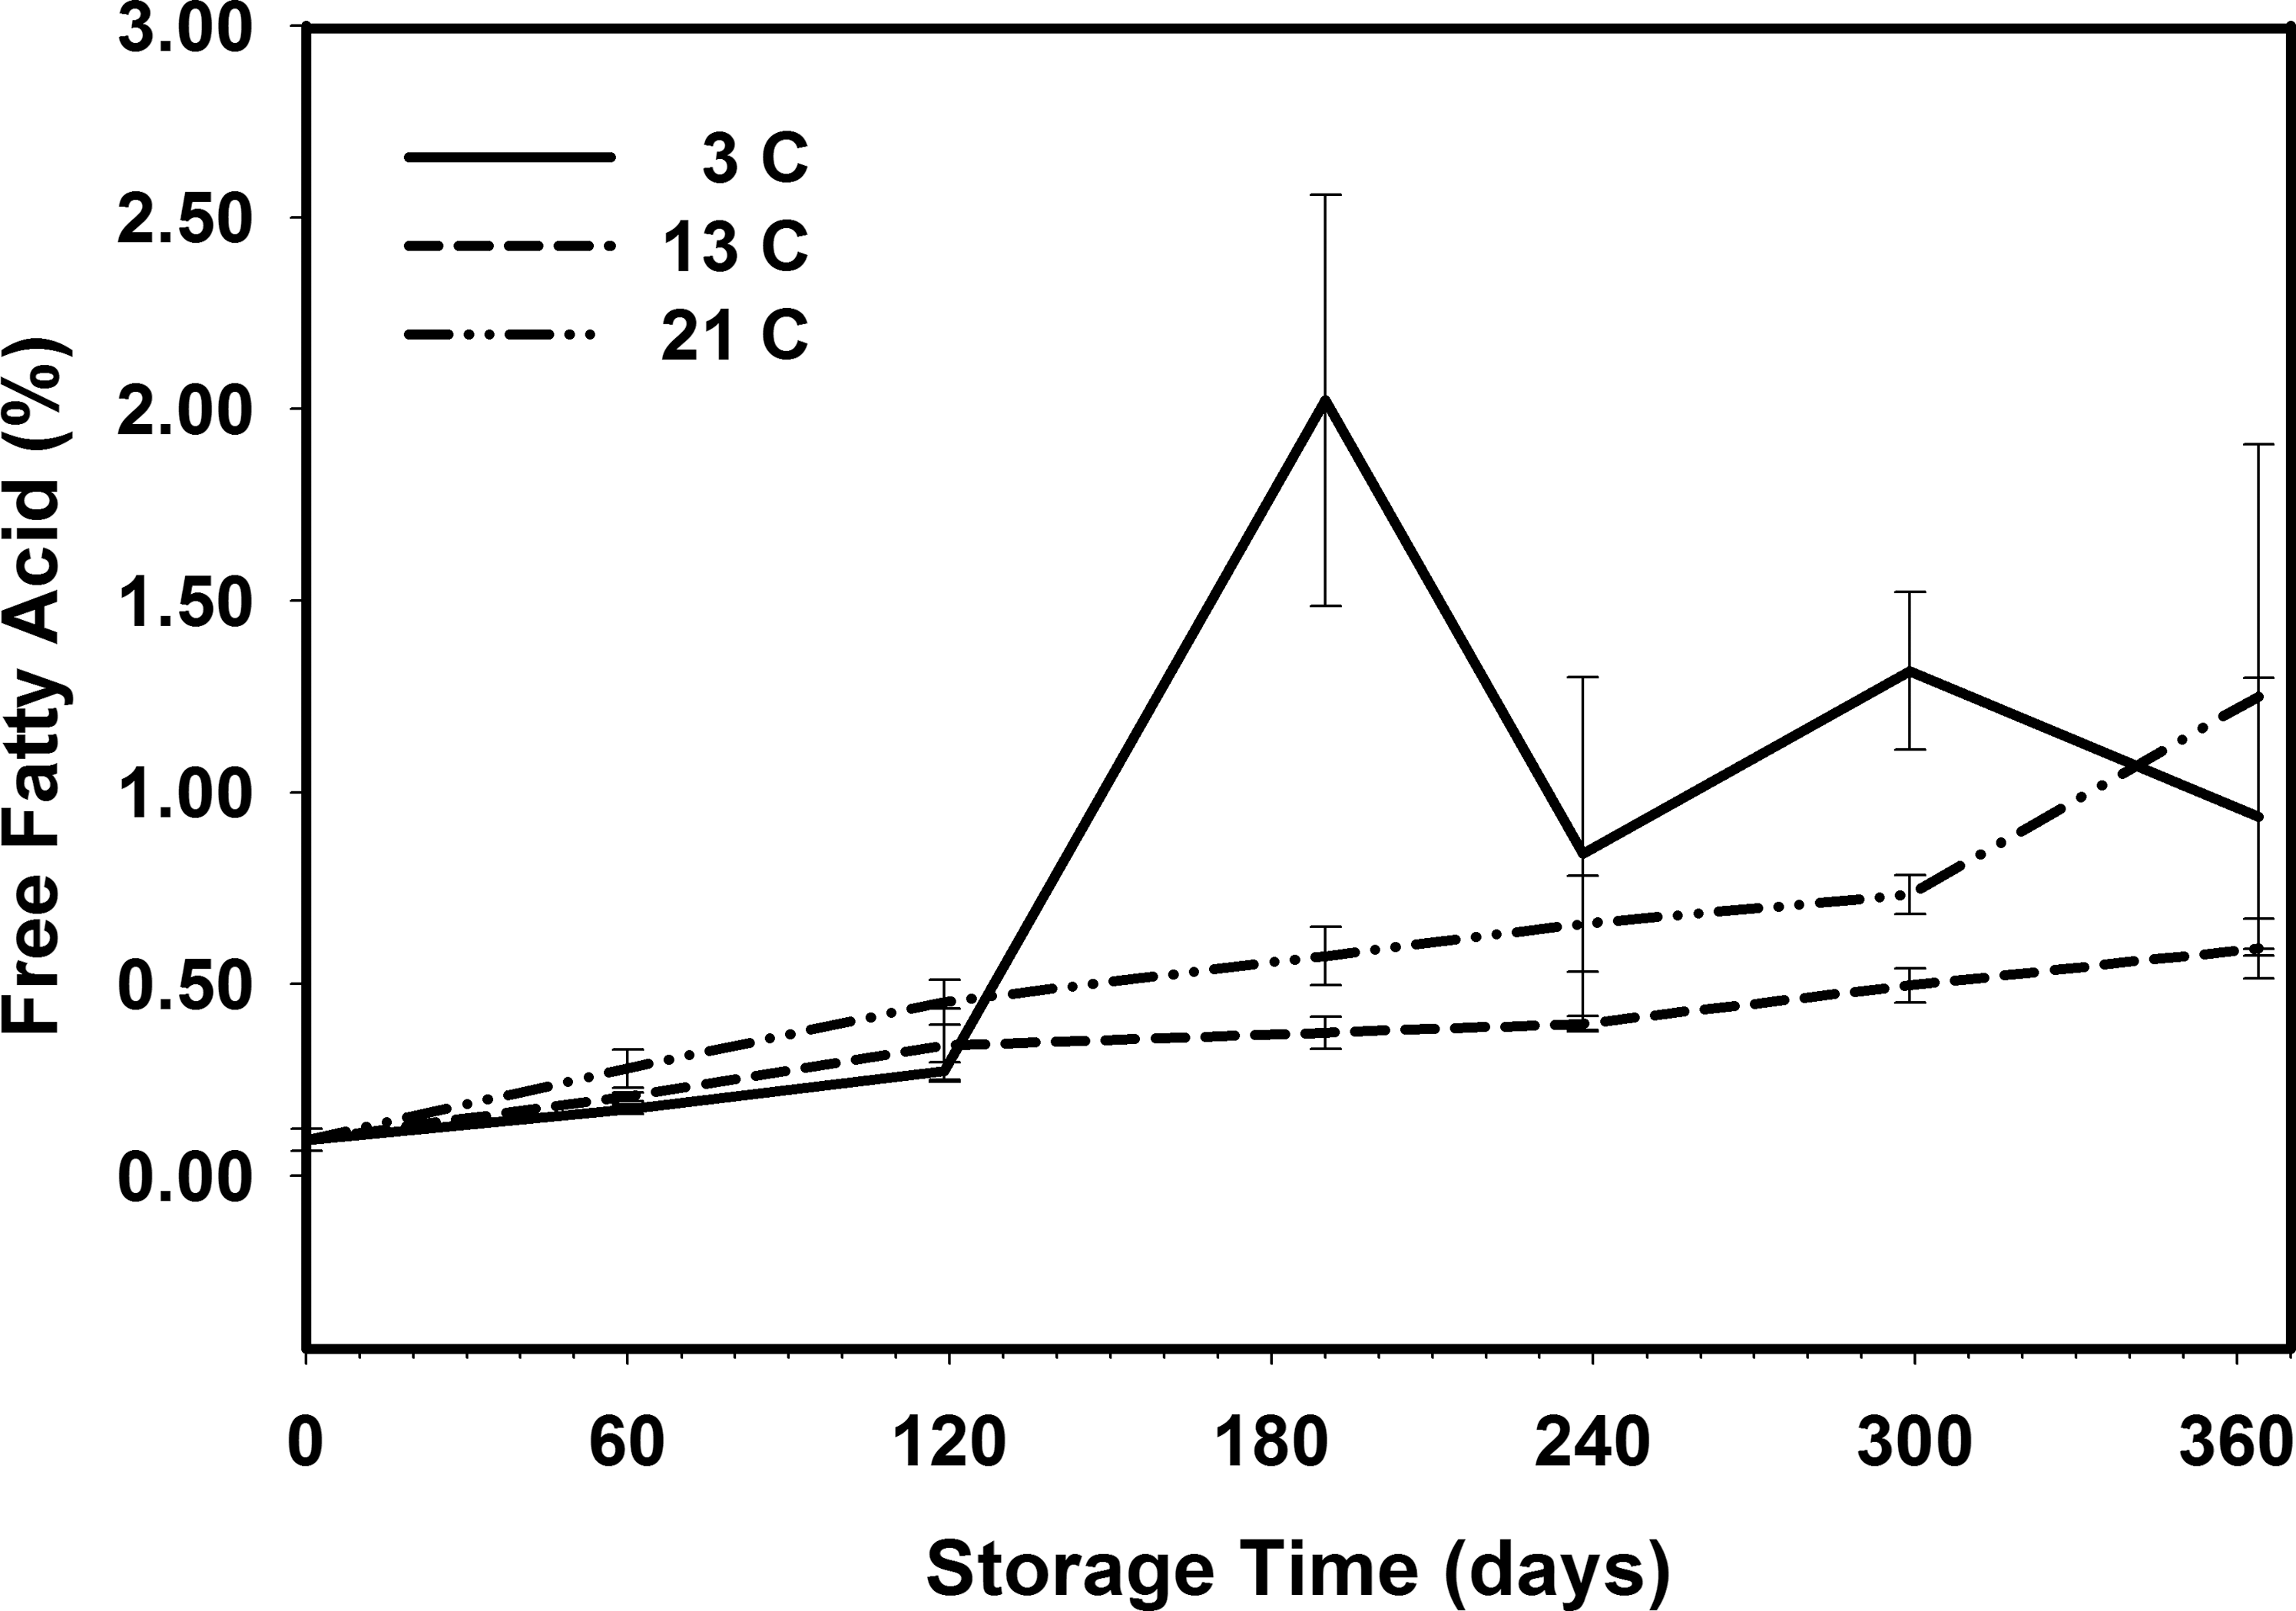
Percent free fatty acid of shelled peanuts stored for 364 d in controlled environment chambers at 3, 13, and 21 C.
Mean percent free fatty acid after storage at three different temperatures in controlled environment chambers.
There was no significant increase in PV in the peanuts stored at 13 C throughout the storage period (Table 8). Peanuts stored at 3 C showed some significant changes between the first and last samples which were the same. The PV increased significantly from 0.10 to 0.33 when stored at 21 C and was significantly higher than that of peanuts stored at 3 C (0.10) and 13 C (0.13) (Figure 10).
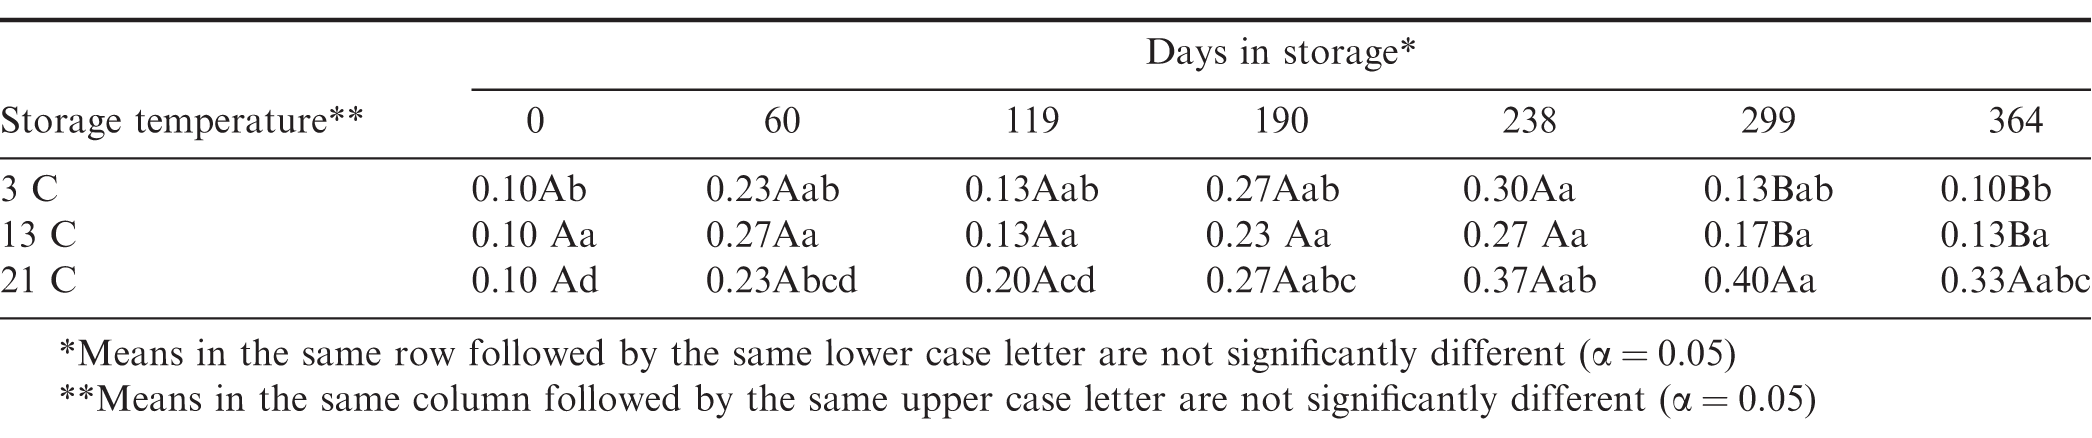
Mean peroxide values (meq) after storage at three different temperatures in controlled environment chambers.
Peroxide values (meq) of shelled peanuts stored for 364 d in controlled environment chambers at 3, 13, and 21 C.
Seed germination was initially 74.5 when placed in storage (Figure 11). After 30 d storage, the germination decreased significantly at 3 and 13 C storage temperatures (Table 9). Peanuts stored at 21 C decreased, but the change was not statistically different. This decrease after 30 d storage was most likely due to seed dormancy, because the next germination at 60 d increased to initial germination levels. After 364 d storage time, the peanuts stored at 3 C had a 43 germination rate compared to 78 for peanuts stored at 13 C. There were no 21 C germination samples due to Indian meal moth infestation.
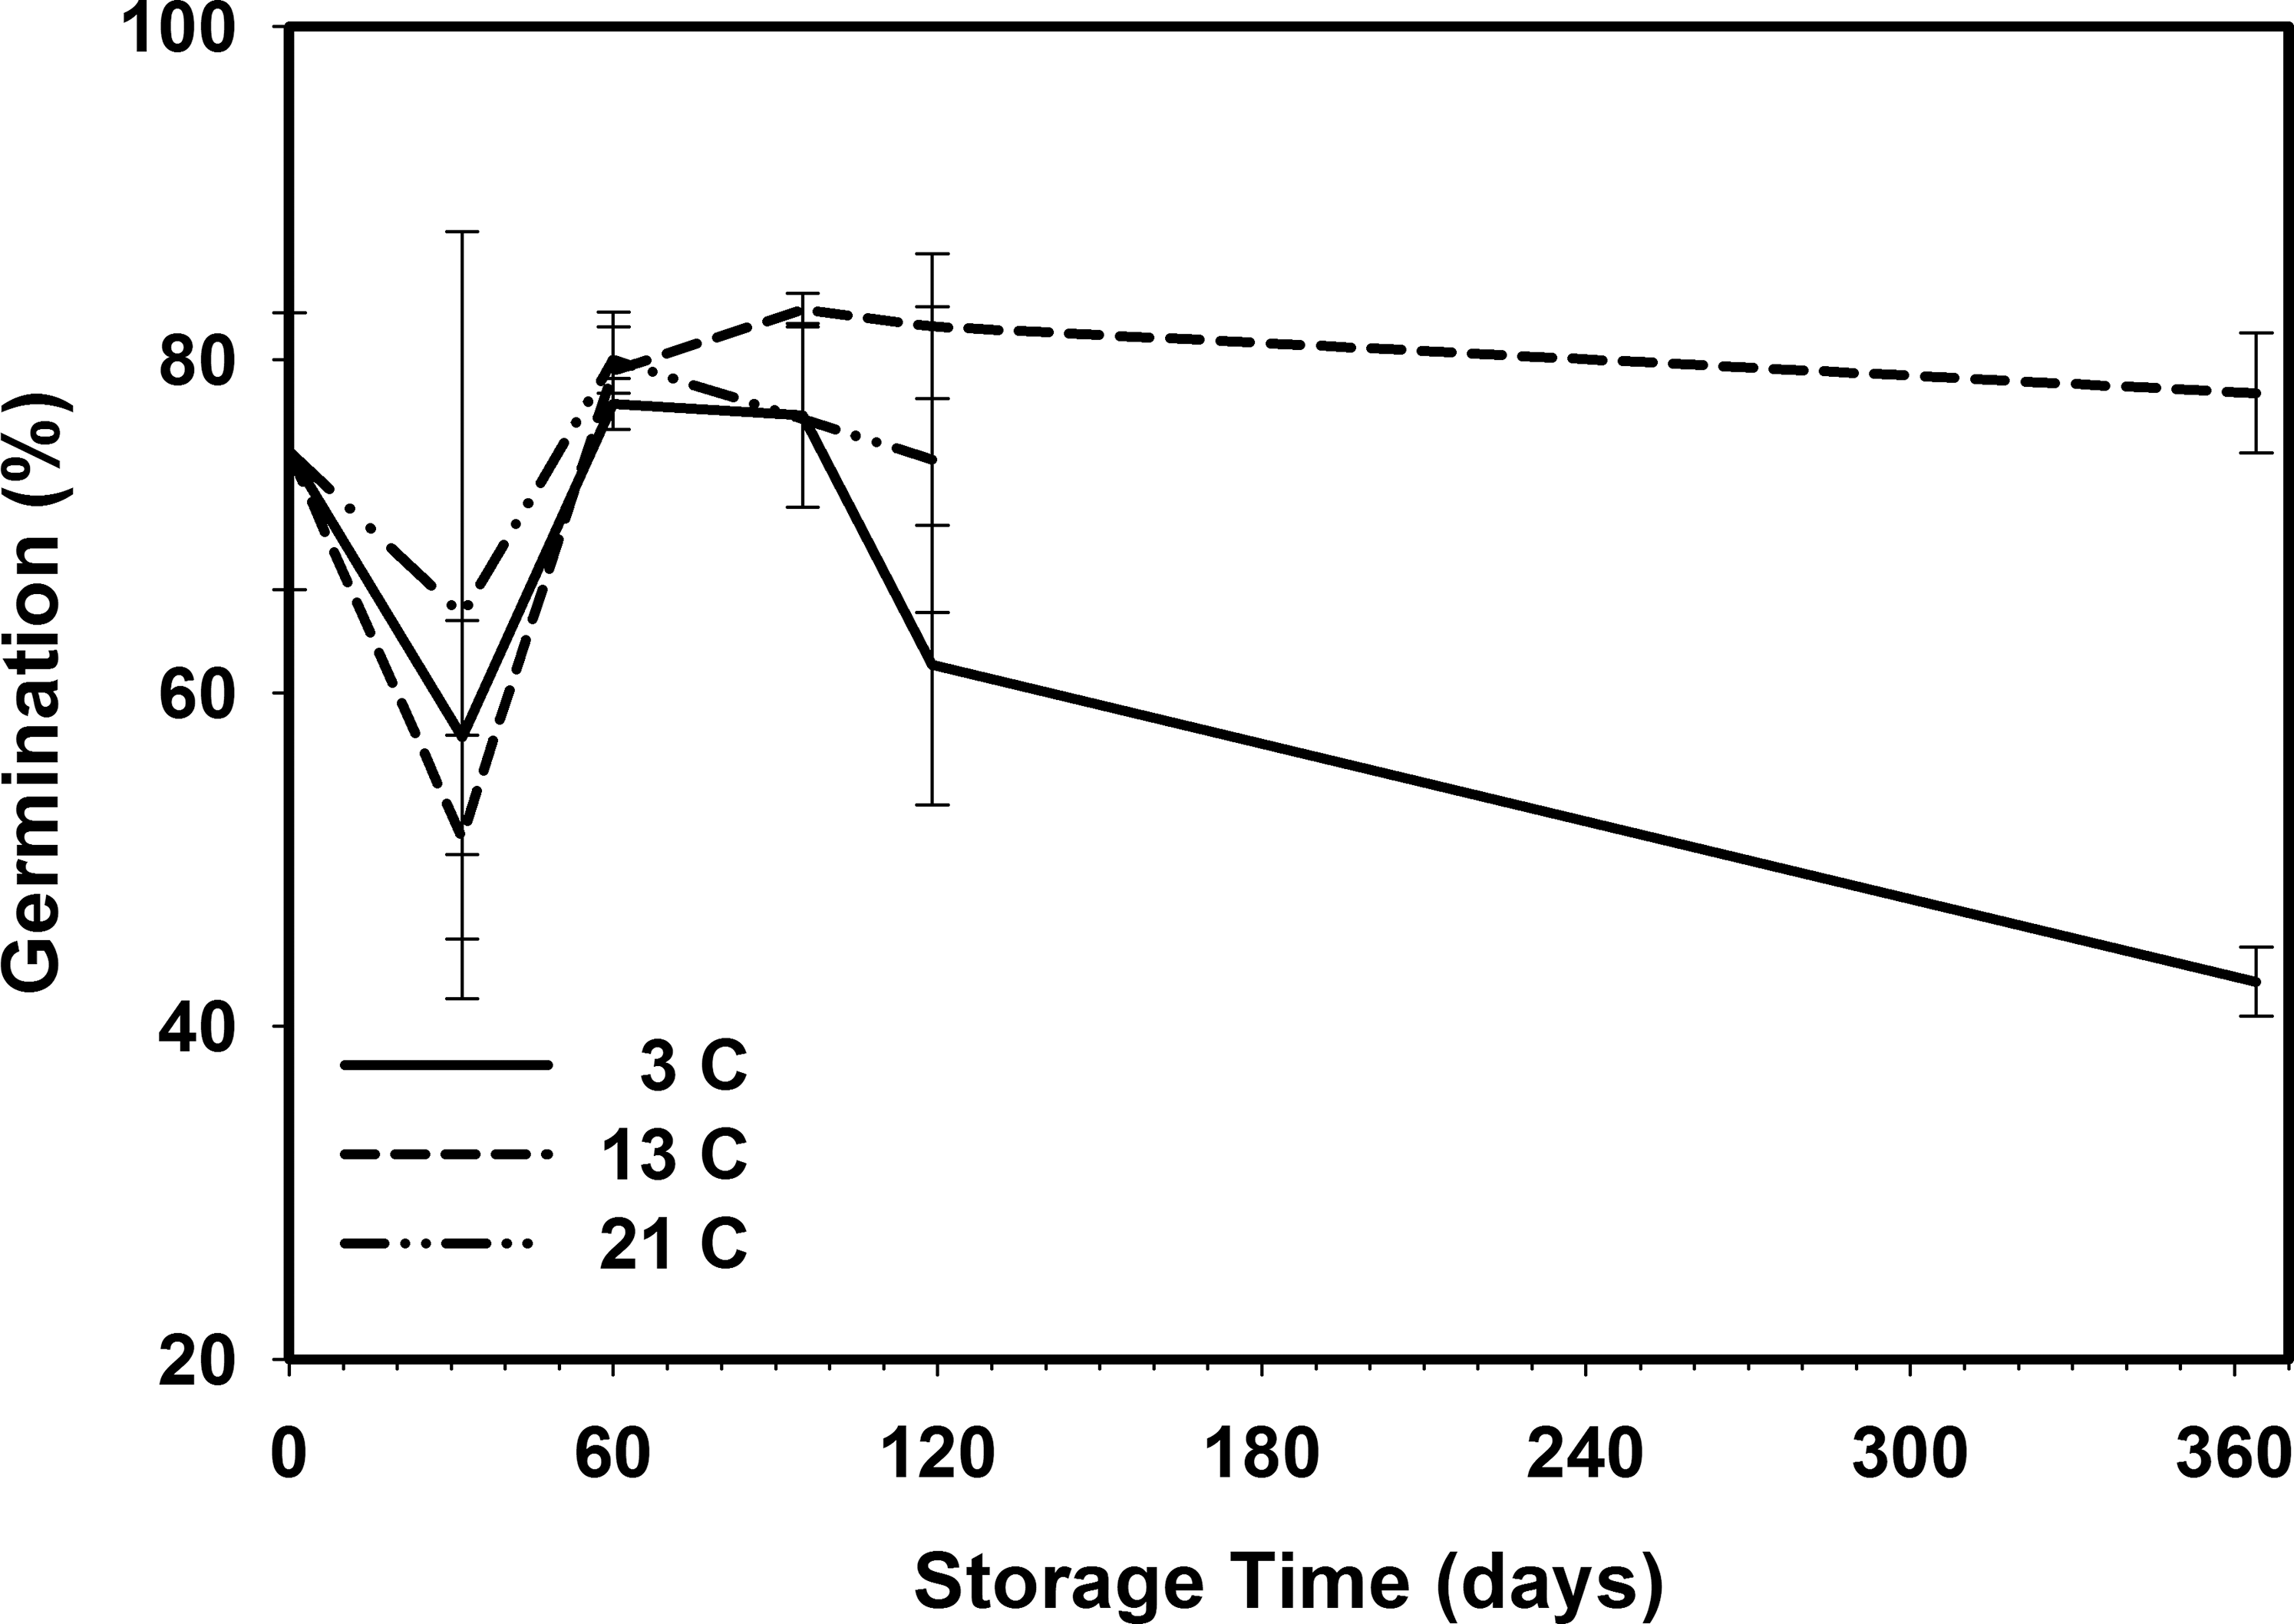
Percent seed germination of shelled peanuts stored 364 d in controlled environment chambers at 3, 13, and 21 C.
Mean percent germination after storage at three different temperatures in controlled environment chambers.
Commercial Results
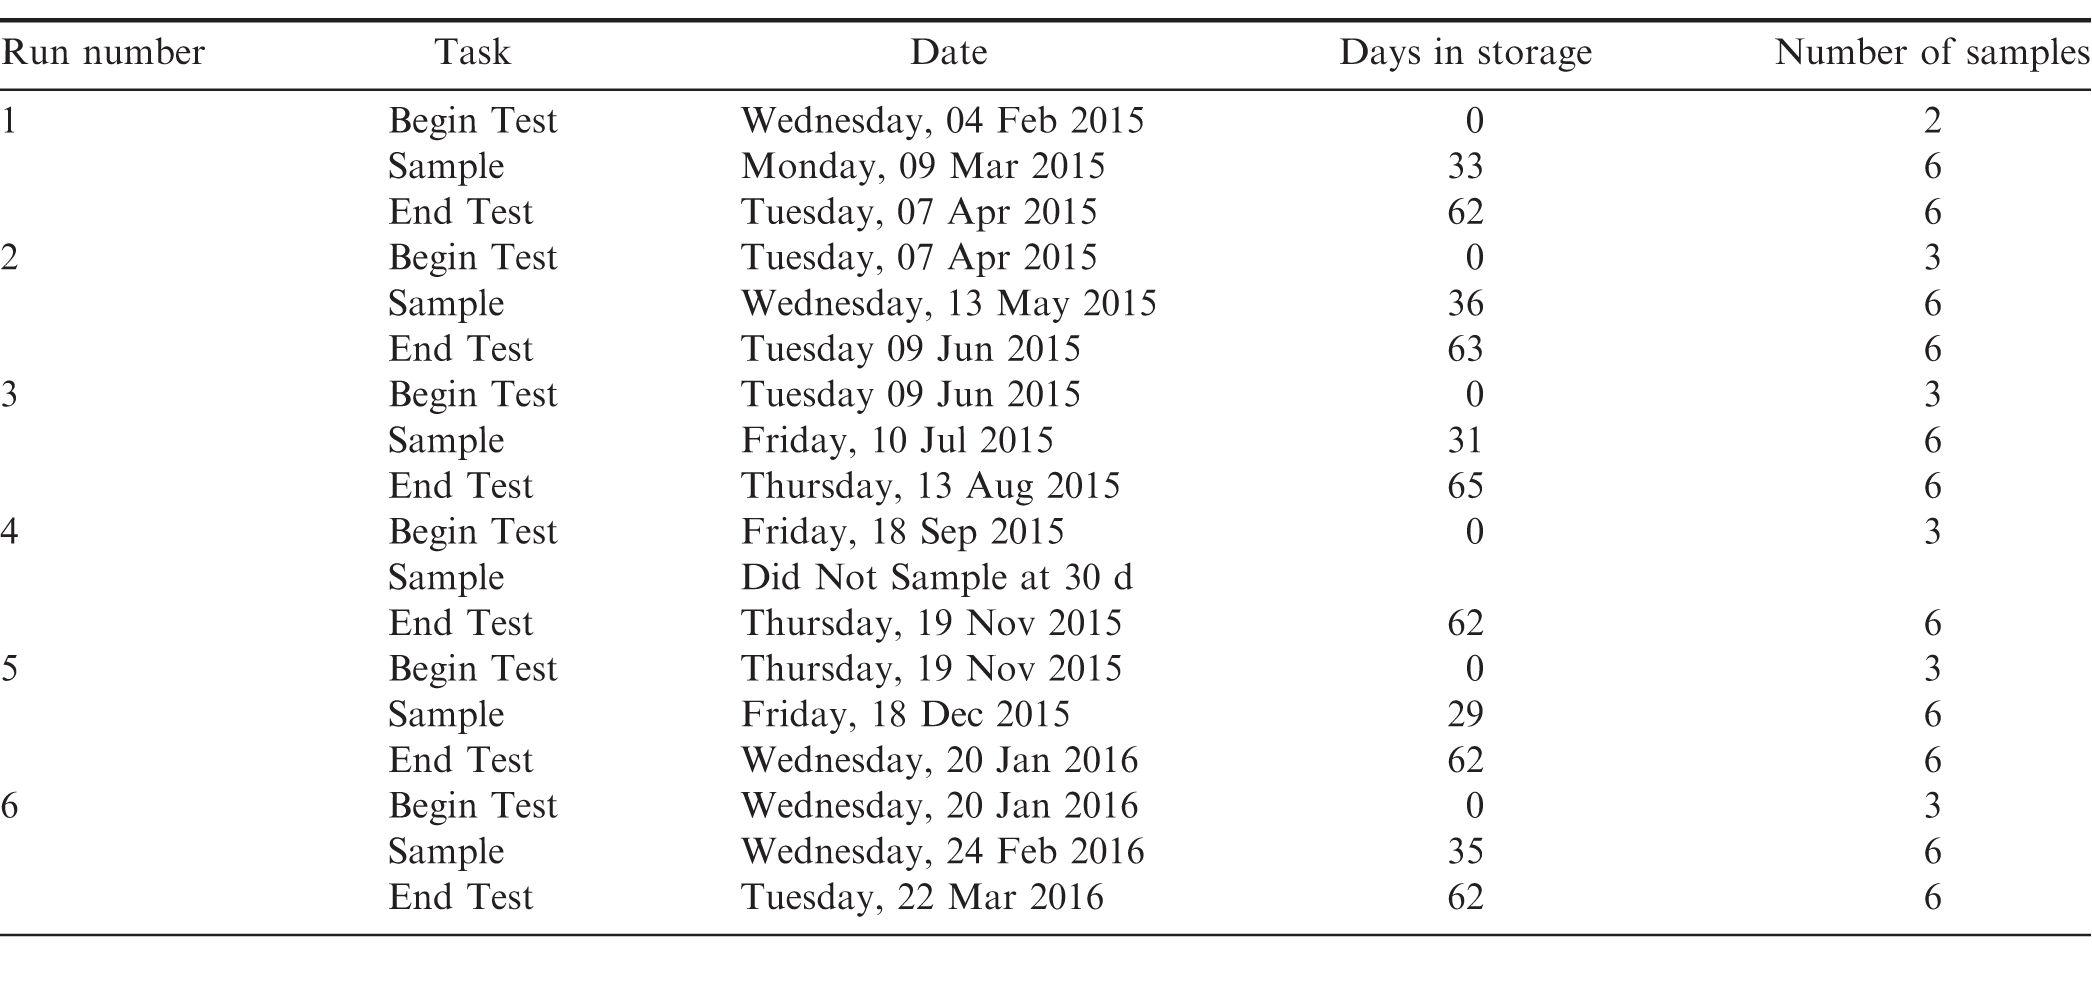
As shown in Table 3, six tests (runs) were conducted in a commercial storage facility in 60-d intervals over the course of a 14-month period. This was done to evaluate the seasonal changes in ambient temperature and humidity upon the ability to store shelled peanuts at 3 and 13 C. The ambient conditions in the storage facilities, initial peanut temperature, and peanut moisture content at the beginning and end of each 60-d run are shown in Table 10. During Runs 1 and 2 (04 Feb 09 Jun 2015), the average cold storage temperature remained within the 1 5 C range recommended by the industry (Takash, Calhoun et al. 2016). The average temperature during all other runs exceeded the recommended temperature range. The average temperature cold storage temperature exceeded the maximum recommended by 1.3 C during Run 4. The average temperature in the alternative storage remained below the target 13 C for all six runs. The recommended relative humidity ranges for cold storage facilities is from 55 to 70. The average relative humidity for four out of the six commercial runs in the 3 C facility exceeded the maximum recommendation. The average relative humidity in the 13 C facility remained within the recommended range during all six storage runs. These data indicate the difficulty in maintaining facilities at the recommended low temperature and the relative humidity. Heavy forklift traffic in and out of the facilities allows for significant infiltration of ambient air which is out of condition even with the use of air curtains, roll-up curtains and other means of control.
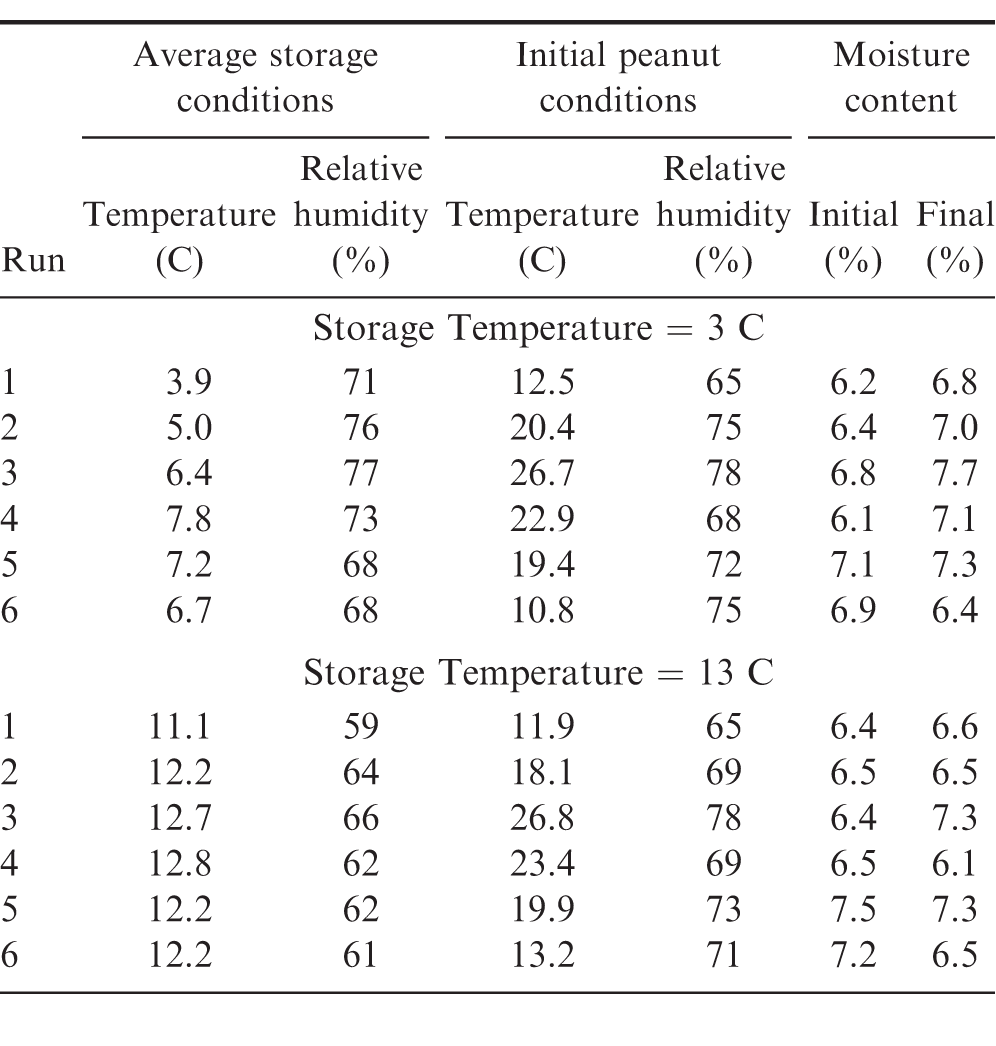
Summary of storage and initial peanut temperature ( C) and relative humidity (), initial and final moisture contents () of shelled peanuts stored for 60 d in commercial facilities maintained at 3 and 13 C.
After shelling and filling, the initial peanut temperature fluctuated seasonally as expected (Table 10) from 12 C in February to a maximum of 27 C in July. The relative humidity of the air in the totes generally followed a similar cyclical pattern with the lower humidity occurring in winter and summer and the higher humidity occurring in the spring and fall of the year. The initial moisture content of the peanuts averaged 6.6 6.7 and with no significant difference when initially placed in the two shelled storage environments (Table 11). After storage for 30 d, the average moisture content increased in both environments. Peanuts stored in the 3 C facility increased 1 from 6.6 to 7.6 compared to a 0.5 increase from 6.7 to 7.2 for the peanuts stored in the 13 C facility. After 60 d in storage, the peanut moisture content had decreased in moisture content. The peanuts stored at 3 C had decreased to 7.2 about 0.5 higher than the initial moisture content. The peanuts stored at 13 C decreased to 6.9, within 0.2 of the initial 6.7. Therefore, on average, the peanuts stored at 3 C increased in moisture more than those stored at 13 C.
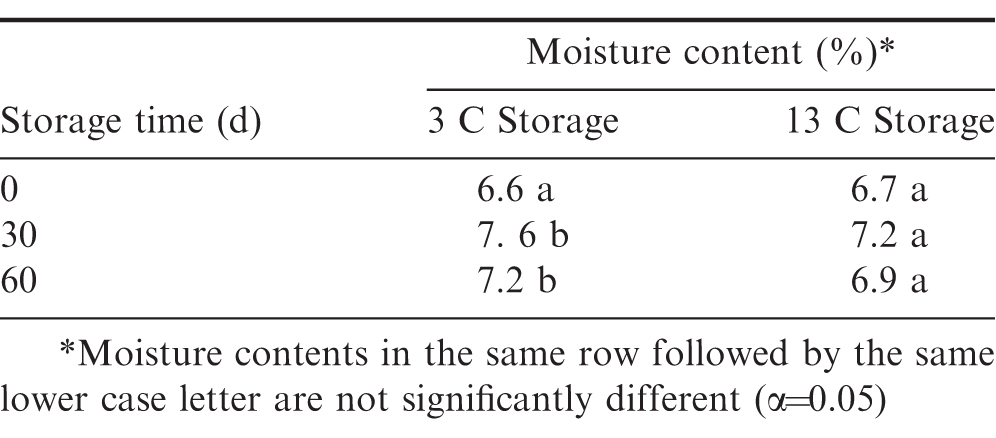
Peanut moisture content after 0, 30, and 60 d in commercial storage maintained at 3 and 13 C averaged over all six runs.
In general, the peanut moisture content after 60 d storage tended to be higher when the initial peanut temperature exceeded 20 C (Table 10) regardless of the storage temperature. During Run 3 (10 Jul 18 Sep 2015), peanuts were 27 C and 78 relative humidity when placed in cold storage. The moisture content of the peanuts placed in the cold storage increased from 6.8 to 7.7. The peanuts in the 13 C facility increased from 6.4 to 7.3.
Peanuts will rehydrate to an EMC of 7.5 if maintained in an 70 relative humidity environment (ASABE 2007). If the relative humidity is increased to 75, the EMC will increase to 8.5. To assess the risk of the proliferation of mold and possible germination, the fraction () of the storage period that the relative humidity in the top of the totes was greater than or equal to 75 was calculated (Table 12). On average, the relative humidity in top of the totes stored in the 3 C facility exceeded 75 approximately for 23 of the storage period. The relative humidity in top of the totes stored at 13 C exceeded 75 an average of 7 of the storage period significantly reducing the risk of deterioration due to mold. As expected, the fraction of the storage period at risk of mold growth (RH 75) had strong seasonal tendencies. The highest risk occurred in both storage environments during Run 3 (start date 10 Jul 2015). The relative humidity was at least 75 in the top of all three totes in 3 C storage facility 69 of the time. In fact, the relative humidity in the tote on the bottom of the stack never fell below 75 (Table 12) during Run 3. The relative humidity exceeded 75 an average of 31 of the storage time. However, the relative humidity in the top of the totes never exceeded 80 (data not shown). In either storage, no condensation on the peanuts was indicated by the leaf wetness sensors (data not shown). The highest initial product temperature observed during the year (27 C) occurred at the beginning of Run 3 (Table 10).
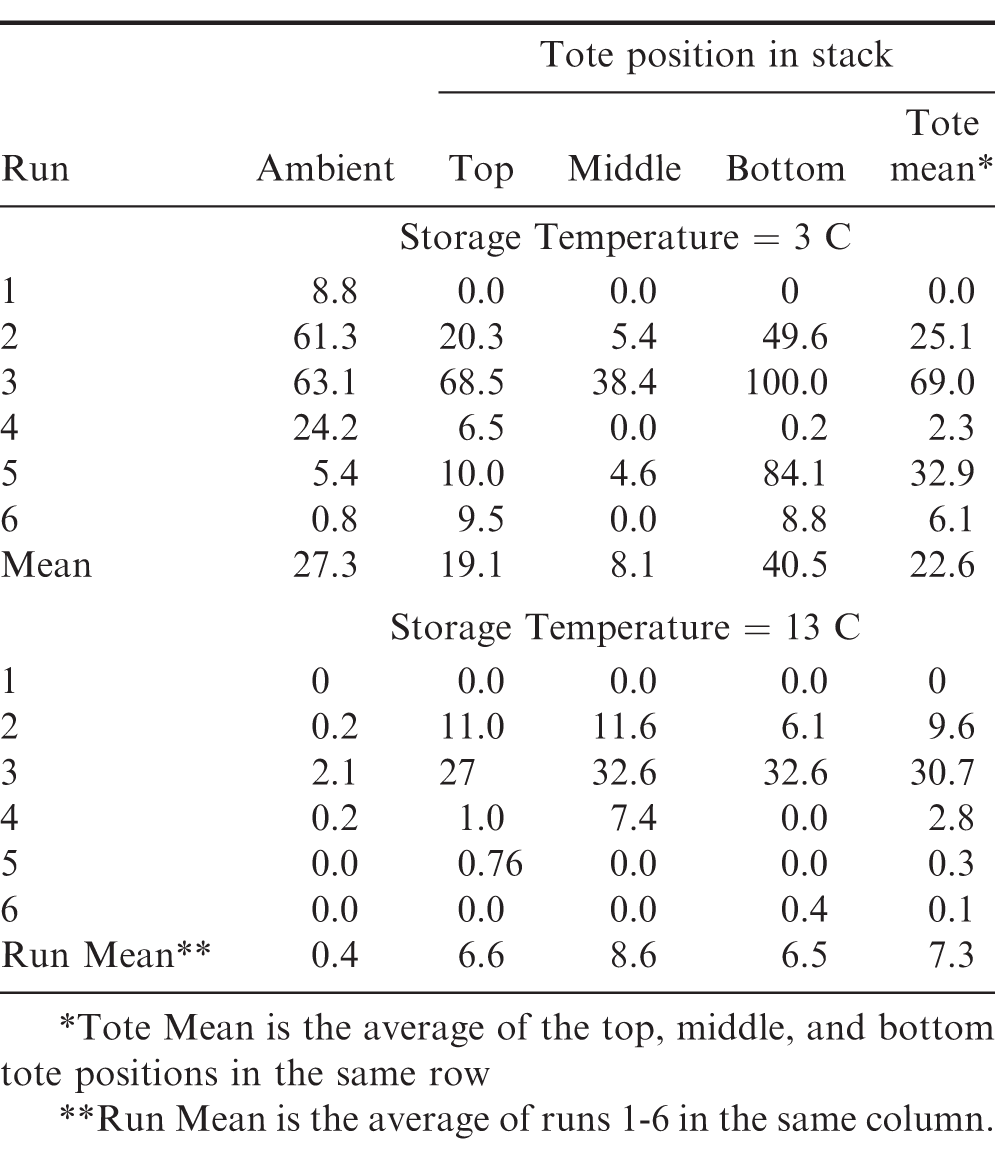
Percent of the storage time that the relative humidity measured on the outside of and in the top of each tote was greater than or equal to 75 when stored for 60 d in commercial facilities maintained at 3 and 13 C.
During Runs 1-4, 2014 crop peanuts were placed in cold storage and had already reached an EMC of less than 7.
If peanuts are in a desorption (drying) phase, they will equilibrate to a higher moisture content than they would in a sorption (rewetting) phase and held at the same relative humidity (ASABE, 2007). Runs 5 and 6 were new (2015) crop peanuts and were still in a drying (desorption) phase. This can be seen in Run 5. Peanuts placed in the 3 C facility, were 7.1 moisture content, exposed to an average 68 relative humidity during storage, and increased slightly in moisture content to 7.3. Contrast that to peanuts placed in the 13 C facility at 7.5, held at an average 62 relative humidity, and decreased slightly to 7.3 moisture content. This indicates that the relative humidity should be maintained toward the lower end of the 55-70 range of relative humidity when placing new crop peanuts in cold storage to facilitate continued drying to safe storage levels. Based on the data shown in Tables 10 and 12, the highest risk of mold growth occurred when the initial peanut temperature exceeded 20 C. Risk increased when the initial difference between the temperature of peanuts and the average storage temperature exceeded 13 C.
If a commercial cold storage facility were to change its operating parameters so that the temperature is maintained at 13 C and the relative humidity maintained at 60, let's examine the effect on operating costs. As stated in the introduction, the average number of cooling degree days would be reduced from 5629 to 2525 C-days. Cooling degree days are an indicator of the energy required to maintain a building at a fixed temperature accounting for the heat transfer from outside the building through conduction. An additional energy load occurs due to infiltration of warm outside air into the cooled space. This infiltration occurs through intentional introduction of outside air, unintentional leaks, and traffic in and out of the cold storage facility. The cooling load associated with cooling the infiltrating air consists of a sensible portion (the amount of heat required just to change the temperature) and a latent portion (the amount of heat associated with the condensation and removal of water from the air). For this analysis, we will assume that the amount of infiltration is primarily due to traffic moving product in and out of cold storage and will be the same whether the facility is maintained at 3 or 13 C. In both scenarios, the target relative humidity will be 60. Using the weather stations at Albany, Attapulgus, Dawson, and Vienna, Georgia (UGA, 2017), the annual daily average temperature and relative humidity are 18.9 C and 60. Using the thermodynamic properties of the moist air before and after cooling, shows that the total cooling load (kJ/kg dry air) to cool the air from 18.9 C and 60 RH to 13 C and 60 RH would be about 54 that required to cool the air to 3 C and 60 RH. The latent portion of that cooling load would be approximately 47 that required when maintaining the facility at 3 C and 60 RH. The amount of water (kg water/kg dry air) that would be condensed and removed from the infiltrated air by the refrigeration system would be about 53 of that required to maintain the facility at 3 C and 60. Another indicator of the work performed by the refrigeration system is the dewpoint temperature that is necessary to maintain the desired relative humidity. This is the lowest temperature that the coils must cool the air to in order to remove the required moisture. The dewpoint temperature in a facility maintained at 3 C and 60 RH is -3.5 C. The dewpoint temperature in a facility maintained at 13 C and 60 RH is 5.4 C. A dewpoint temperature below 0 C is difficult to achieve due to the tendency for water to freeze on the coils.
If a commercial facility were to raise its operating temperature from 3 to 13 C and maintain 60 RH, both the latent and sensible cooling load could be reduced by approximately 50. Due diligence in other good management practices such as sanitation and pest control would have to be maintained.
Summary and Conclusions
Tests were conducted to examine the change in peanut flavor, chemistry, germination and the risk of mold growth when storing shelled peanuts at 3, 13, and 21 C. Small chamber tests showed that there was no significant reduction in flavor, chemistry, or germination when stored up to 1 year at 13 C. There were no significant reductions in flavor, chemistry, or chemistry when peanuts were stored at 21 C. However, infestation by Indian meal moth prevented sensory and germination evaluations after 180 d storage. Controlling the relative humidity in the 3 C chamber within the recommended range of 55-70 was difficult and resulted in mold growth deeming them unacceptable for sensory testing. Tests at commercial storage facilities indicated that the risk of mold growth when storing shelled peanuts could be significantly reduced if the storage temperature were increased from 3 C to 13 C while maintaining relative humidity between 55 and 70. The commercial testing also indicated that the relative humidity should be maintained closer to 55 than 70 when placing a significant amount of new crop peanut to reduce the risk of mold growth. Raising the storage temperature from 3 to 13 C could reduce the energy costs of operating the cold storage facility by as much as 55. Based on this research, the recommended temperature for storing shelled peanuts can be increased to 13 C, while maintaining the relative humidity between 55 and 70.
Acknowledgements
The authors kindly acknowledge the cooperation of the staff in the shipping department of the Birdsong Peanuts shelling plant located in Colquitt, GA for loading the shelled peanuts, stacking and unstacking the totes to provide access for sampling during the middle of each 60-d storage cycle. The authors also acknowledge David DeShazo at JLA International in Albany, GA for conducting the sensory panel and chemistry evaluations. The germination samples were evaluated as a courtesy by the Georgia Department of Agriculture's Seed Lab located in Tifton, GA.
Literature Cited
APC (2009) Chapter 5 Good Management Practices fo Shelled Good Cold Storage and Shelled Goods Dry Storage Online: http://www.peanutsusa.com/food-safety/good-management-practices.html., American Peanut Council.
APC (2010, March 16, 2010). Flexible Intermediate Bulk Container (FIBC) Specifications., from https://www.peanutsusa.com/export-promotion/technical-information/4-totebag-task-force.html.
ASABE (2007) ASABE Standard D245.6: Moisture Relationships of Plant-based Agricultural Products. St Joseph, MI, ASABE.
C. H Bell, ((1994)). A Review of Diapause in Stored-Product Insects.. Journal of Stored Products Research 30 ((2)): 99 120.
Butts, C. L., J. W Dorner, et al (2007) Environmental Conditions During Transport of Shelled Peanut in Overseas Containers Annual Meeting of the American Peanut Research and Education Society, Birmingham, AL, Am. Peanut Res. Educ. Soc.
Butts, C. L and M. C Lamb (2014) Temperature/Humidity Conditions in Stacked Flexible Intermediate Bulk Containers for Shelled Peanuts 2014 ASABE Annual International Meeting Montreal, Quebec Canada, ASABE. ASABE Paper No. 141846655: 10.
Dorner, J. W., C. L Butts, et al (2007) Effect of Temperature and Relative Humidity on Spotting of Peanuts after Roasting Annual Meeting of the American Peanut Research and Education Society, Birmingham, AL, Am. Peanut Res. Educ. Soc.
A. M., Gibson, J Baranyi, et al ((1994)). Predicting Fungal Growth - the Effect of Water Activity on Aspergillus-Flavus and Related Species.. International Journal of Food Microbiology 23 ((3-4)): 419 431.
Meilgaard, M. C., G. V Civille, et al (2016) Sensory Evaluation Techniques, CRC Press.
Redlinger, L. M and R Davis (1982) Insect Control in Postharvest Peanuts Peanut Science and Technology H. E Patteeand C. T Young Yoakum, Texas, American Peanut Research and Education Society: 520-570.
T. H., Sanders, J. R Vercellotti, et al ((1989)). Interaction of Maturity and Curing Temperature on Descriptive Flavor of Peanuts.. Journal of Food Science 54 ((4)): 1066 1069.
T. H., Sanders, J. R Vercellotti, et al ((1989)). Effect of Maturity on Roast Color and Descriptive Flavor of Peanuts.. Journal of Food Science 54 ((2)): 475 477.
Sobolev, V. S., J. W Dorner, et al (2007) Determination of the Nature of Spotting in Blanched Peanuts Annual Meeting of the American Peanut Research and Education Society, Birmingham, AL, Am. Peanut Res. Educ. Soc.
Takash, J., S Calhoun, et al (2016) Good Management Practices for Shelled Goods Cold Storage and Shelled Goods Dry Storage Good Management Practices, S. Calhoun. Alexandria, VA, American Peanut Council.
UGA (2017) University of Georgia Weather Network. Retrieved January 9, 2017, from http://www.georgiaweather.net/.
Whitaker, T. B., T. H Sanders, et al (2007) Uncertainty Associated with Measuring the True Level of Spotted Peanuts in Bulk Lots of Shelled Peanuts Annual Meeting of the American Peanut Research and Education Society, Birmingham, AL, Am. Peanut Res. Educ. Soc.
Notes
- First, second, third authors: Agricultural Engineer, Supervisory Research Food Technologist, Research Agronomist, USDA-ARS National Peanut Research Laboratory, Dawson, GA 39842; Fourth and fifth authors: SE Food Safety and Quality Manager, Director of Food Safety and Quality, Birdsong Peanuts, Blakely, GA 39823; Sixth, seventh and eighth authors: : Raw Materials Technologist, Global Strategic Raw Materials Manager, Global Research and Development Nut Manager, Mars Chocolate Elizabethtown, PA 17022 [^] Corresponding author's E-mail: Chris.Butts@ars.usda.gov
Author Affiliations