

Introduction
Peanut (Arachis hypogaea L.) is an important food and cash crop in the semi-arid tropics. Earlier studies on peanut showed that rate of plant development is predominantly influenced by temperature but is insensitive to water stress (Leong and Ong 1983). Others reported that 28 to 30 C is the optimum temperature for leaf and stem growth up to flowering, but a substantially lower optimum temperature exists for pod growth between 20 and 24 C. Highest maximum temperature, especially above 33 C during pod development and maturity phases was known to depress the yield through its effect on pollen viability (Prasad and Reddy 1990). Dry matter partitioning to stems, leaves, and pods of peanut is a function of mean air temperature. The ratio of pod to shoot weight was greatest at a mean temperature of 22 C and decreased from 0.28 to 0.04 when temperatures increased to 31 C (Org 1984). The partitioning of dry matter to pods would therefore be expected to decrease as temperatures increase (Cox 1979).
Detailed process based mechanistic models like PEANUTGRO and APSIM are available to predict growth, development, and yield of peanut. However, many parameters are needed to run these models. Hence, a simple model with minimum weather data is needed to suggest a suitable time of planting and to predict the yields from a winter crop.
Materials and Methods
The study was conducted on Alfisols of the Agri. Res. Stat., Reddipalli, Anantapur of Acharya N.G. Ranga Agri. Univ., India (14°–41- N latitude, 77°–40- E longitude and 350 m above mean sea level). Spanish bunch cv. Vemana peanuts were planted on the following seven dates: 1 Nov., 16 Nov., 1 Dec., 16 Dec., 31 Dec., 15 Jan., and 30 Jan. and recommended package of practices were adopted. At each planting date the plants were irrigated at irrigation water (50 mm)/cumulative pan evaporation (IW/CPE) ratios of 1.0, 0.8, and 0.6, replicating thrice. However, in this study the influence of weather parameters could be studied by comparing each planting date, irrigated at IW/CPE ratio of 1.0 since under these treatment combinations all crop management factors were maintained constant, thus leaving weather as the only variable. Weather data recorded at the adjacent observatory were used for the study.
To study the phenology, three peanut plants from each treatment were uprooted carefully from the area designated for sampling at 5 d intervals and the following phonological events were recorded: emergence (VE), 50% flowering (R1), pegging (R2), seed initiation (R5), pod development (R6 to R8). These phenophases were further grouped into three phases: vegetative (VE to R1), reproductive (R1 to R5), and pod filling (R5 to R8) for studying crop-weather relationships (Krista Rao, 1996). The duration of each page is presented in Table 1.
Means of weather parameters such as maximum temperature (Tmax), minimum temperature (Tmin), Average temperature (Ï), diurnal variation in temperature (TDV), relative humidity during morning (RHm), relative humidity during afternoon (RHa), and soil temperature at 5 cm (ST5) and 10 cm (ST10) (soil depths that prevailed over different phenophases) were calculated (Tables 2 and 3).
To study the influence of weather parameters on yield parameters, initially simple correlations were calculated between weather parameters that prevailed over different phenophases and yield parameters. After establishing the relationship between weather and yield parameters, step-down regression analysis was carried out with those weather parameters that had significant influence on yield parameters. By this analysis, the contribution of respective weather parameters that influenced the change in yield parameters was known and prediction equations were formulated.
Crop data such as pod growth rate from seed initiation to maturity (g m−2 d−1), hundred kernel weight (g), shelling percentage, pod yield (kg ha−1), haulm yield (kg ha−1), and harvest index (%) were recorded as follows.
Pod Growth Rate
Pod growth rate (PGR) for the period from seed initiation to maturity (pod filling phase) was calculated using the formula
 1
1
Hundred Kernel Weight
Weight (g) of 100 randomly selected kernels from the representative samples were recorded for all treatments in all replications.
Shelling Percentage
Pods weighing 250 g from each treatment of all replications were shelled and kernel weights were recorded. Shelling percentage was obtained using the formula
 2
2
Pod Yield
Pods from the net plot (12.0 m2) were stripped after uprooting, sun dried to constant weight and expressed in kg ha−1.
Haulm Yield
After stripping the pods, the haulms from net plot area of each treatment of all replications were thoroughly sun dried to constant and expressed in kg ha−1.
Harvest Index
Harvest index was computed using the formula
 3
3
Results and Discussion
Results of pooled analysis over two winter seasons showed significant variation in yields due to years, indicating the influence of weather on yield parameters of peanut. The crop planted in different dates was exposed to different thermal regimes during the growth period. During 1994 and 1995, minimum temperature during vegetative (S1), reproductive (S2) and pod filling (S3) phases ranged from 11.5 to 14.9 C, 11.8 to 18.7 C, and 14.0 to 21.2 C respectively. During 1995 and 1996, the values ranged from 13.5 to 18.0 C; 12.4 to 18.3 C, and 13.8 to 21.1 C, coinciding with vegetative, reproductive, and pod filling phases, respectively.
Diurnal temperature range during 1994 and 1995 varied from 13.6 to 18.7 C; 15.4 to 19.5 C, and 16.6 to 18.9 C, coinciding with vegetative, reproductive, and pod filling phases. During 1995 and 1996, it ranged from 13.7 to 18.7 C in the vegetative phase; 16.1 to 20.9 C in the reproductive phase, and 17.9 to 19.8 C in the pod filling phase. The influence of weather parameters that prevailed over different phenophases on crop parameters are discussed in detail below.
Pod Growth Rate (pgr)
PGR varied due to planting dates. In both years, crop planted from 1 to 31 Dec. (Table 2) had the highest PGR. Crop planted 1 Nov. and 1 Jan. recorded the lowest PGR in the first year, while in second year, 30 Jan. crop had the lowest PGR. It was significantly and negatively correlated with Tmax and Tmin which prevailed during the S2 phase. However, it was significantly and positively correlated with TDV which prevailed during the S3 phase of peanut. Step-down regression analysis revealed that TDV of the S3 phase (TDV S3) alone had contributed for 69.0% variation (R2 = 0.690) in PGR. The prediction equation was
 4
4
3.2 Hundred Kernel Weight (hkw) And Shelling Percentage (sp)
Pooled analysis of data on HKW and SP revealed that all four dates of planting from 1 Nov. to 16 Dec. resulted in significantly higher HKW than in the later three plantings. Early plantings before 16 Dec. were on par and recorded significantly higher SP than the later four dates of planting (Table 4).
Analyses revealed significant but negative correlation between all weather parameters (except RHm and RHa), which prevailed during the S2 phase and HKW and SP. The relationship between weather parameters that prevailed during the S3 phase and yield parameters showed that either decrease in Tmax, Tmin, Tmean, and soil temperature of both the depths or increase in TDV and RHm significantly increased the HKW and SP. However, results of step-down regression analysis revealed that considerable variation in HKW and SP were accounted for by Tmin during the S3 phase (Tmin S3) only. It alone contributed for 83.0 and 94.8% the variation (R2 = 0.830 and 0.948) in HKW and SP, respectively. The following prediction equations evolved.
 5
5
 6
6
All the four dates of planting from 1 Nov. to 16 Dec. resulted in higher HKW and SP compared to the later three dates of plantings (Bell et al. 1987; Prasad and Reddy 1990). Both these yield attributes were significantly low due to higher Tmin during the S3 phase as evident from regression analysis (Figs. 1 and 2). The crop planted from 1 Nov. to 16 Dec. recorded higher HKW and SP due to optimum Tmin ranging from 13.8 to 17.4 C during the S3 phase (Ntare et al. 1993). High Tmin (19.1 to 21.2 C) due to 31 Dec. to January plantings were not conducive to energy reserves. Low availability and reduced translocation of photosynthates to developing pods under high temperatures might have resulted in poor pod filling, leading to reduced HKW and SP.
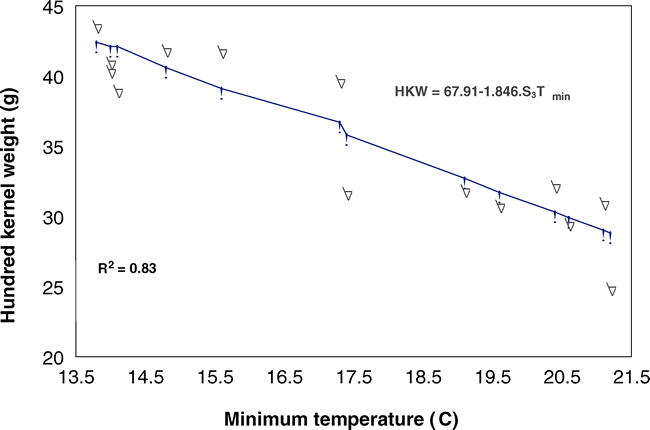
Relationship between minimum temperature during the pod filling phase and 100 kernel weight of peanut cv.
Vemana sown at varied dates in the winter.
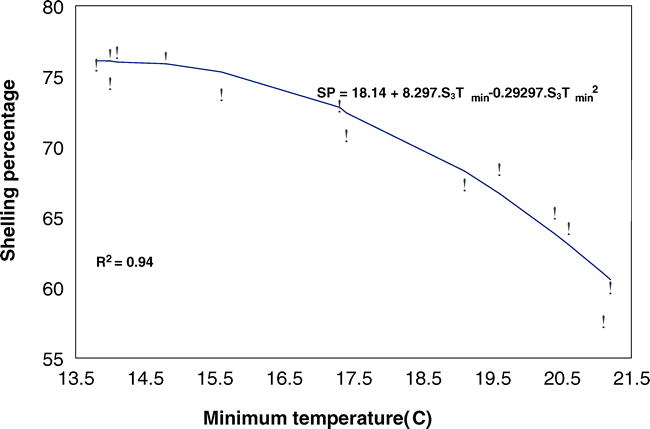
Relationship between minimum temperature during the pod filling phase and shelling percentages of peanut cv.
Vemana planted at varied dates in the winter.
Pod Yield (yP)
Pooled analysis of Yp over 2 yr (Table 2) brought about significant variations due to planting dates. Six planting dates 1 Nov. to 15 Jan. at 15 d intervals resulted in comparable yields. The latest planted crop on 30 Jan. recorded significantly less yield compared with the earlier six planting dates. Pooled analysis showed 62.7% increase in pod yield with the 16 Dec. crop over the latest planted crop on 30 Jan.
Tmax, ST5 and ST10 that prevailed during the S1 phase had significantly and positively correlated with pod yields. During the S2 phase, pod yield (Yp) was significantly and positively correlated with RHm, but negatively correlated with Tmin, Tmax, Tmean, ST5, and ST10 of the weather parameters which prevailed during the S3 phase. TDV had significant positive correlation with pod yield, while Tmin and ST5 were negatively correlated. However, the results of step-down regression analysis indicated that the TDV S3 contributed for 63.5% variation (R2 = 0.635) in Yp. The following prediction equation was formulated.
 7
7
Variation in pod yields due to planting dates were mainly due to differences in TDV (Fig. 3) and their effect on various physiological processes particularly portioning of dry matter and respiration. TDV ranging from 17.9 to 19.8 C with Tmin from 13.8 to 19.6 C during the S3 phase were optimum for higher pod yields. Higher Tmin with January plantings might have exhausted the energy reserves during the respirating process, leading to poor pod yields. Adverse effects of night temperatures on peanut pod yield were also reported by several researchers (Elangoan and Gopalaswamy 1976; Rao 1987; Prasad and Reddy 1990).
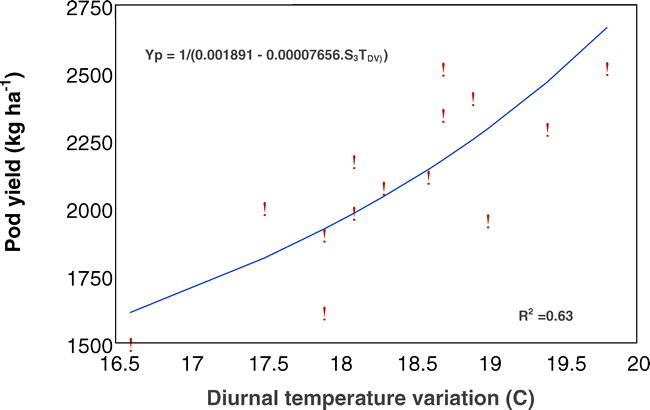
Relationship between diurnal temperature variation during the pod filling phase and pod yield of peanut cv.
Vemana planted at varied dates in the winter.
Haulm Yield (yH)
There was significant variation in Yh due to planting dates (Table 3). During 1994 and 1995, significantly higher Yh was due to 30 Jan. planting. Crops planted 1 Nov. and 1 Dec. recorded the significantly lowest Yh. There was a progressive increase in Yh with early planting from 1 Nov. to the latest planting on 30 Jan. during the second year.
Correlation studies indicated that during all the three phases of peanut growth, either increase in Tmin, Tmax, Tmean, ST5, and ST10 or decrease in RHm and RHa significantly increased the Yh of peanut. However, the results of step-down regression analysis revealed that variation in Yh was mainly due to Tmin which prevailed during S3 (Tmin S3) and it alone contributed to 82.1% variation in Yh. The following prediction equation evolved.
 8
8
Differences in Yh increased as the plantings were delayed and temperatures increased (Fig. 4) at each successive stage of the crop. Regression analysis also indicated that increased Tmin favored the Yh without translocating the energy reserves into pods as reflected on HKW and SP.
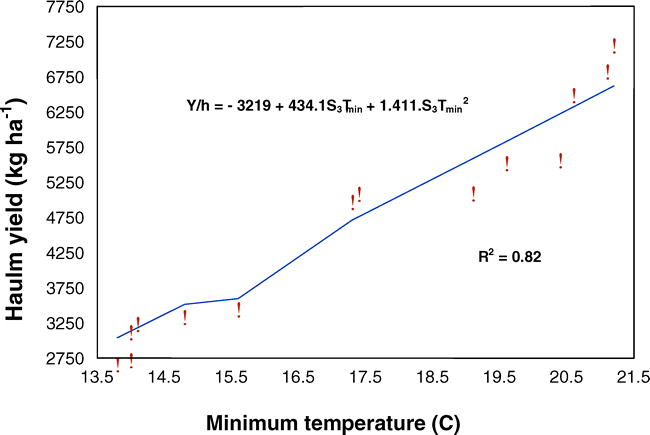
Relationship between minimum temperature during the pod filling phase and haulm yield of peanut cv.
Vemana planted at varied dates at the winter.
Harvest Index (hi)
In first year, the highest HI of 41.9% was due to the 16 Nov. planting and was significantly higher compared with other planting dates (Table 3). The lowest HI occurred on 30 Jan. A similar trend was followed even in the second year.
Correlation studies revealed similar results as per HKW and SP. Tmin S3 alone accounted for 82.8% variation (R2 = 0.828) in HI. The prediction equation was
 9
9
Variations in HI due to planting dates were significant in both years. Differences in HI due to planting dates are an indication of translocation efficiency as peanut has an indeterminate growth habit. There was an overlapping of vegetative and reproductive phases that results in the formation of actively growing stems and leaves that might have competed with pod formation and maturation for photosynthates. Hence, there might have been hindrance to the translocation to photosynthates to pods in the delayed plantings, leading to low HI with the late plantings of January (Fig. 5). This is evident from the influence of planting date on pod growth studies.
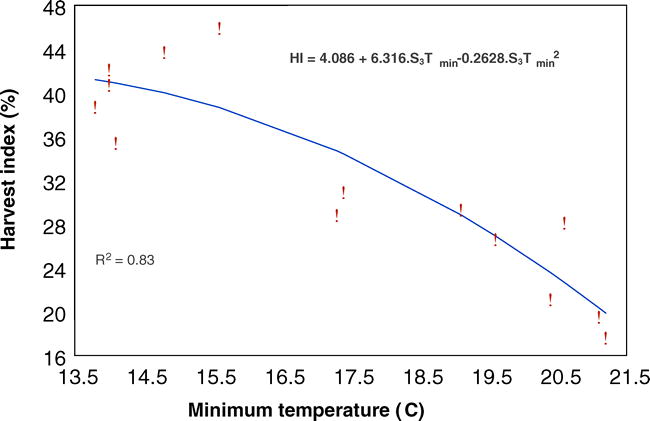
Relationship between minimum temperature during the pod filling phase and harvest index of peanut cv.
Vemana planted at varied dates in the winter.
Conclusions
The results of this study indicated that different phenophases of peanut coincided with different climatic regimes due to different planting dates from 1 Nov. to 30 Jan.. Yield parameters were related with weather parameters during crop growth periods for all the planting dates to find an ideal climatic regime for improving the productivity of winter peanut on shallow Alfisols. From the results it is evident that peanut productivity during the winter season in India is primarily dictated by diurnal variation in temperature and minimum temperature during the pod filling phase. Diurnal variation in temperature ranging from 17.9 to 19.8 C with minimum temperature ranging from 13.8 to 19.6 C during the pod filling phase was optimum for higher pod yields as such, the hypothesis postulated that the development of peanut fruit is temperature-dependent has been proven. The objective of planting winter peanut should be such that it passes through optimum diurnal variation in temperature and minimum temperature during the pod filling phase.
Literature Cited
Bell M. J. , Shorter R. , and Mayer R. 1987 Serial planting date studies on peanut in Southeast Queensland. In Food legume improvement for Asian farming systems
Boote K. J. 1982 Growth stages of peanut. Peanut Sci 9 : 35 – 40 .
Cox F. R. 1979 Effect of temperature treatment on peanut vegetative and fruit growth. Peanut Sci 6 : 14 – 17 .
Elangoan R. and Gopalaswamy N. 1976 Effect of temperature and humidity on the yield of summer bunch peanut (Arachis hypogaea L.). Food Farming and Agric 16 : 15 – 16 .
Krista Rao K. 1996 Impact of drought at different phenophases on yield and yield attributes in groundnut (Arachis hypogaea L.) in scarce rainfall region. Ph.D. Thesis, Acharya N.G. Ranga Agricultural University Hyderabad, India .
Leong S. K. and Ong C. K. 1983 The influence of temperature and soil water deficit on the development and morphology of groundnut (Arachis hypogaea L.). J. Expt. Botany 34 : 1551 – 1561 .
Ntare B. R. , Ndunguru B. J. , and Williams J. H. 1993 Adaptation of groundnut (Arachis hypogaea L.) to the post-rainy season in a Sahelian environment. Summmary proc. 3rd ICRISAT regional groundnut meeting for West Africa, Quagadougou, Burkina Faso, 14–17 1992. Hyderabad, India.
Ong C. K. 1984 The influence of temperature and water deficits on the partitioning of dry matter in groundnut (Arachis hypogaea L.). J. Exptl. Botany 35 : 746 – 755 .
Rao G. H. 1987 (i) Studies on the influence of time of planting Spanish groundnut varieties during rabi under irrigated conditions on growth, yield and in relation to weather factors (ii) Agrotechniques to improve productivity of irrigated JL – 24 groundnut Ph.D., Thesis submitted to Andhra Pradesh Agricultural University Hyderabad, India .
Vara Prasad J. V. L. and Ramakrishna Reddy T. 1990 Effect of date of planting on yield and yield components in rabi groundnut varieties. J. Res. Andhra Pradesh Agricultural University 18 : 54 – 56 .
Williams J. H. , Hildebrand G. L. , and Tattersfield J. R. 1978 The effect of weather and genotype × environment interaction on the yields of groundnut (Arachis hypogaea L.). Rhodesian J. Agric. Res 16 : 163 – 204 .
Notes
- Senior Scientist, ARS, DCMS Buildings, Kamalanagar, Anantapur - 515 001, A.P., India. [^]
- Retired Pro. and Head, S.V. AgriculturalCollege, Tirupati - 517 501, A.P., India. [^]
- Principal Scientist, ARS, DCMS Buildings, Kamalanagar, Anantapur - 515 001, A.P., India. [^] *Corresponding author (e.mail : ypl_agro@hotmail.com)
Author Affiliations