


Introduction
Peanut, Arachis hypogaea L., is a major agricultural commodity grown in the United States, with Georgia serving as the nation’s leading producer. In 2023, U.S. Peanut growers planted approximately 665,700 ha, of which an estimated 313,631 ha were planted in Georgia. Peanut production in Georgia had a farm gate value of 783 million U.S. dollars, accounting for about 50% of the total peanut production in the United States (NASS-USDA 2023). The peanut burrower bug (PBB), Pangaeus bilineatus (Say), is a polyphagous, subterranean insect belonging to the order Hemiptera, family Cydnidae, and is considered a major pest of peanut in the southeastern United States (Chapin et al.,, 2006). Adults and nymphs use piercing sucking mouthparts to penetrate the hull of a peanut pod and feed directly on the seed inside. Once the proboscis is inserted into the seed, digestive enzymes are injected to break down plant tissue prior to ingestion of liquefied nutrients (Cantón and Bonning 2020). This feeding results in unsightly, discolored lesions on the peanut seed, reducing crop value and providing an entry point for the pathogenic fungus Aspergillus flavus, which produces carcinogenic metabolites called aflatoxins (Chapin et al.,, 2006). Feeding lesions range in color from light yellow to dark brown and often are not visible until the testa is removed (Smith and Pitts 1974). Farmer stock peanut lots containing greater than 3.49% burrower bug injured kernels, by weight, are downgraded to Segregation II, resulting in an approximate 35% reduction in crop value (USDA 2019). Although PBB infestations are sporadic, even low levels of injury can result in substantial economic loss (Abney 2014, Abney 2015, Abney 2016, Abney 2017).
The subterranean life cycle of PBB makes the insect difficult to sample and manage effectively (Aigner et al., 2021). Currently, no published economic thresholds or established scouting methods exist for this pest. Although the organophosphate insecticide chlorpyrifos is effective against PBB, its use was discontinued in 2025 due to regulatory action, leaving no effective chemical control options available (Georgia Pest Management Handbook 2024 Commercial Edition). As a result, PBB poses a serious threat to peanut production in the Southeastern U.S., highlighting the need for effective, sustainable management strategies.
In the absence of effective insecticides, cultural control remains the primary management option for PBB. Tillage has been shown to reduce injury caused by various subterranean arthropods across multiple cropping systems (Rowen et al 2020). Although the underlying mechanisms have not been fully explored, studies by Chapin and Thomas (2003) and Abney et al., (2017) demonstrated that conventional tillage significantly reduced PBB injury to peanuts. Conventional tillage disrupts soil structure, destroying PBB tunnels and impeding the formation of new tunnels. However, adoption of conservation tillage practices is widespread in peanut producing regions. Wade and Claassen (2017) reported that across the southern seaboard, which includes the majority of Georgia peanut growing areas, 49% of growers used continuous reduced till practices, 36% alternating no-till practices, and 15% of growers utilized continuous tillage. In Georgia peanut production specifically, strip tillage is the most common type of conservation tillage practice used (Bogati et al., 2023). These practices may contribute to increased PBB infestations by maintaining soil structures favorable to burrow construction. Although it reduces the risk of PBB injury, conventional tillage has several drawbacks, including increased soil erosion and oxidation of organic matter (Rowen et al., 2020), higher production costs, and ineligibility for government conservation programs. These disadvantages are driving a shift from conventional to conservation tillage by Georgia peanut producers (Monfort, 2025 personal communication).
Host plant resistance (HPR) represents a promising long-term strategy for managing PBB. HPR refers to a plant’s inherent ability to deter, tolerate, or recover from pest injury. Although genetic bottlenecks occurred during peanut domestication and in the early years of hybridization-based breeding that limit the genetic diversity of modern cultivars, genes conferring natural resistance to PBB may exist. Peanut breeding programs in the southeastern United States have successfully developed cultivars with genetic resistance to several economically important fungal and viral diseases, including the insect transmitted tomato spotted wilt virus (TSWV) (Liu et al., 2015). The cultivar Georgia-06G (GA-06G) was released in 2006 (Branch 2007) and is currently the most widely planted runner type peanut cultivar in the southeastern United States. Although PBB was first recognized as a peanut pest in the 1970s, it was studied extensively in South Carolina by Chapin and colleagues in the late 1990s and early 2000s (Chapin and Thomas 2003; Chapin et al., 2006); its pest status increased markedly following the widespread adoption of GA-06G. The factors contributing to the increased incidence of PBB injury beginning in 2010 remain unclear; however, potential differences in cultivar susceptibility have been suggested as a contributing factor.
The first objective of this study was to evaluate PBB feeding injury among commercial peanut cultivars to identify cultivar(s) exhibiting natural resistance or tolerance. The second objective was to quantify hull strength (measured as the force required to penetrate the hull) among these cultivars and assess its potential role as a mechanism of host plant resistance to PBB.
Materials and Methods
Six field plot experiments were conducted over five growing seasons (2016-2020) on commercial farms in Brooks and Emmanuel counties, Georgia. Treatment was equivalent to cultivar, and the number of treatments varied by site year. Peanut seed was provided by the Georgia Seed Development program. Cultivars were direct seeded using a two row Monosem vacuum planter at six seeds per 30.48 cm and at a depth of 5.08 cm. Planting dates varied slightly among years due to environmental conditions. Trials were planted on 10 May 2016, 10 May 2017, 3 May 2018, 9 May and 15 May 2019, and 4 May 2020. All experiments were arranged in randomized complete block design with four replications. Plot size varied by year due to differences in field size and the number of cultivars per experiment. In 2016, plots were 3.6m wide by 12m long with 1.5m alleys between blocks. In 2017, plots were 14.6m by 15.2m with 3m alleys between blocks. Plots in experiments planted between 2018-2020 were 5.4m wide and 9m long with 1.5m alleys between blocks. The granular insecticide phorate (Thimet®, IRAC Group 1B) was applied in-furrow at planting at a rate of 5.58 kg/ha in all experiments to reduce the incidence of TSWV; no other insecticides were applied. All agronomic practices other than planting and harvest were performed by the cooperating grower and were uniform across treatments within each experiment. Peanuts were dug between the last week in September and the first week in October in all study years. Plots were harvested using a two row Lilliston 1580 peanut combine equipped with a bagging attachment. All pods from each plot were bagged, weighed, and transported to the University of Georgia Peanut Entomology Laboratory in Tifton, GA for injury assessment.
Injury Evaluation
Following harvest, a 100g subsample of peanut pods was collected from each harvest bag (plot) for PBB injury assessment. Peanut pods were shelled, and the seeds were heated in a forced air electric oven set to 121 C for 25 minutes. After cooling, the testa was removed by gently rubbing the exterior of the peanut seed. Naked seeds were visually evaluated for burrower bug injury; the number and weight of injured and uninjured seed were recorded.
Hull Strength: Pod Penetration
Ten peanut cultivars from field trials in 2019 and 2020 were tested to determine the force required to penetrate the hull. Five pods were arbitrarily selected from the bulk pods harvested from each plot. The pods were shelled by hand taking care not to crack the shell or otherwise reduce its integrity; one half of each of the five pods was used for the test. Penetration force (N) was measured using an Imada DST -4A digital force gauge equipped with the Imada SC-3 small chuck jaws containing a # 3 insect pin (40 mm x 0.45 mm). Each pod half was penetrated 10 times: five times on the stem end and five times on the beak end.
Statistical Analysis
Pod Injury
The initial analysis of pod injury considered how pod injury in the reference cultivar GA-06G varied across sampling years, α = 0.05. In the absence of direct observations of pest abundance, this was the best approach to selecting sampling years with high enough PBB population for valid comparison of pod injury across cultivars. A linear model was fit to test the relationship between year and percent injury weight of the kernels. The pod injury values were arcsine square root transformed to meet the linear model assumption of normally distributed residuals. Model assumptions (i.e., normally distributed residuals, homogeneity of variance, etc.) were assessed using 1,000 simulated residuals with the simulateResiduals() function from the DHARMa package (Hartig 2024). Following the identification of significant differences among years from the ANOVA table, estimated marginal means were calculated using the emmeans function from the emmeans package (Lenth and Piaskowski 2024) and the Fisher’s LSD multiple comparisons test. This identified the two years with greatest observed pod injury – 2017 and 2018.
Following the identification of sample years with high pest injury, separate linear models were fit to determine if differences in percent injured kernel weight existed between the reference GA-06G cultivar and other cultivars in 2017 and 2018. The other cultivars evaluated were TUFRunner 297 (FloRunner 297) (Tillman 2018), TUFRunner 511 (FloRunner 511) (Tillman and Gorbet 2017), Georgia-12Y (GA-12Y) (Branch 2013), Georgia-13M (GA-13M) (Branch 2014), and Georgia-14N (GA-14N) (Branch and Brenneman 2015). The pod injury values were arcsine square root transformed to meet the linear model assumption of normally distributed residuals. Model assumptions (i.e., normally distributed residuals, homogeneity of variance, etc.) were assessed using 1,000 simulated residuals with the simulateResiduals() function from the DHARMa package (Hartig 2024). The estimated marginal means were calculated using the emmeans function from the emmeans package (Lenth and Piaskowski 2025) and contrasts were estimated using the Dunnett method using the GA-06G cultivar as the reference for comparison and the Dunnett multiple comparisons test to control for the increased type-I error rate. This identified which cultivars performed better (i.e. less pod injury) compared to GA-06G when pest populations were high.
Hull Strength: Pod Penetration
Ten cultivars were evaluated for pod strength; TUFRunner 297, FloRunner 331(Tillman 2021), GA-12Y, GA-14N, GA-06G, Georgia-18RU (GA-18RU) (Branch 2019), Tif-NV-HiO/L (Tif-NV-HiOL) (Holbrook et al., 2017), Georgia-16HO (GA-16HO) (Branch 2017), Georgia-13M (GA-13M) (Branch 2014), and Georgia-Green (GA-Green) (Branch 1996).The pod strength of different cultivars and position (side or bottom) was compared by fitting a linear mixed effect model using the lmer function from the lme4 package (Bates et al., 2015) where the cultivar, position, and their two-way interaction were the fixed effects, and the location, plot, and pod were nested random intercepts, and an additional random intercept for year was the random effects. The strength values were log transformed to meet the linear model assumption of normally distributed residuals. The random effect of location and year were shown to account for very little variance and were removed from the model to avoid overfitting. The final model with the random effects structure of pod nested within plot was retained, and the model converged properly. Model assumptions (i.e., normally distributed residuals, homogeneity of variance, etc.) were assessed using 1,000 simulated residuals with the simulateResiduals() function from the DHARMa package (Hartig 2024). Following identification of significant results from the ANOVA table, the estimated marginal means were calculated using the emmeans function from the emmeans package (Lenth and Piaskowski 2025) and the Tukey’s HSD multiple comparisons test for all pairwise comparisons within each position. Figures showing the raw data, estimated marginal means and 95% confidence intervals were made using the ggplot function from the ggplot2 package (Wickham 2016).
Results
Pod Injury
The results of the linear model testing the relationship between year and percent injury using the reference cultivar GA-06G (commercial standard) indicated significant variation among the different years (F4,18=3.55, p =0.027). Results of the multiple comparisons test using the emmeans function from the emmeans package (Lenth and Piaskowski 2025) with Fisher’s LSD method show that 2017 and 2018 had the greatest pod injury compared to the other years in this study.
When analyzed separately by year, cultivar effects were not statistically significant in either 2017 (F5,17=1.95, p =0.138) or 2018 (F6,21=2.27, p =0.076), although trends in cultivar injury were generally consistent between years and GA-06G exhibited among the greatest levels of injury.
To evaluate whether pooling across years improved inference regarding cultivar injury levels, an additional combined analysis was conducted using the six cultivars common to both 2017 and 2018. The cultivar x year interaction was not significant (F5,35=0.65, p =0.660), indicating that cultivar responses were consistent between years and supporting pooled inference across years. In the reduced additive model, cultivar significantly affected percent injured kernel weight (F5,40=3.60, p =0.009), whereas year was not significant (p =0.158). Pooled comparisons indicated that GA-06G experienced greater injury relative to several cultivars across years.
The subsequent Dunnett’s multiple comparison test where GA-06G was considered the reference cultivar, indicated that GA-06G had significantly greater injury compared to TUFRunner 297 (t40 = 2.96, p = 0.0226), TUFRunner 511 (t40 = -3.01, p = 0.0200), GA-12Y (t40 = -3.83, p =0.0021), and GA-14N (t40 = -3.45, p = 0.0062). There was no significant difference between GA-06G and GA-12Y (t40 = -2.56, p = 0.0595) (Fig. 1 (b)).
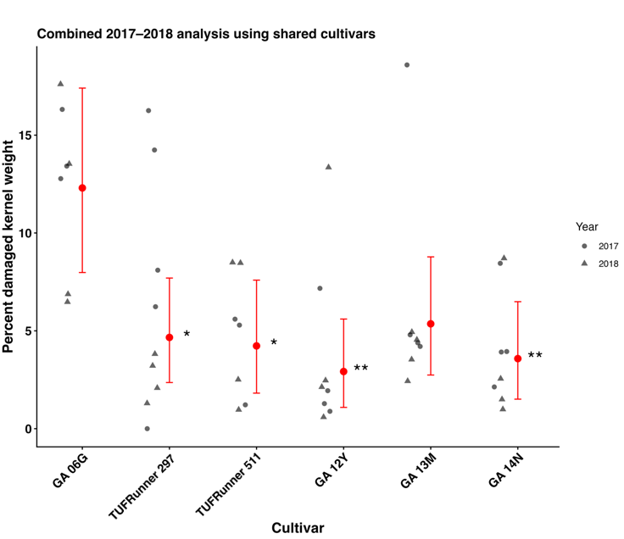
Figure 1. Percent damaged kernel weight for peanut cultivars included in the combined 2017-2018 peanut burrower bug injury analysis. Only cultivars common to both years were included in the pooled analysis. Points represent raw plot-level observations from 2017 (circles) and 2018 (triangles). Red points and error bars represent estimated marginal means ± 95% confidence intervals from the pooled additive model. Asterisks indicate Dunnett-adjusted comparisons relative to the reference cultivar GA-06G (* (P < 0.05), ** (P < 0.01)). The cultivar by year interaction was not significant, indicating that cultivar responses were consistent across years and supporting pooled inference across years.
Hull Strength: Pod Penetration
The results of the linear mixed effects model comparing log(strength) across the interaction of cultivar and position showed that there was not a significant interaction between cultivar and position (F9,4801.4 = 2.53, p < 0.07) (Fig. 2). When averaged across positions, GA-18RU had the lowest numerical hull strength compared to all other cultivars tested. TUFRunner 297 had the overall greatest numerical hull strength at both positions, but it was only significantly greater than six of ten cultivars on the beak end and seven of the ten on the stem end (Fig. 2). AU-NPL17 and TUFRunner 297 took significantly more strength to penetrate compared to GA-06G, while GA-06G took more force to penetrate than GA-14N and GA-18RU on the stem end and GA-18RU on the beak end.
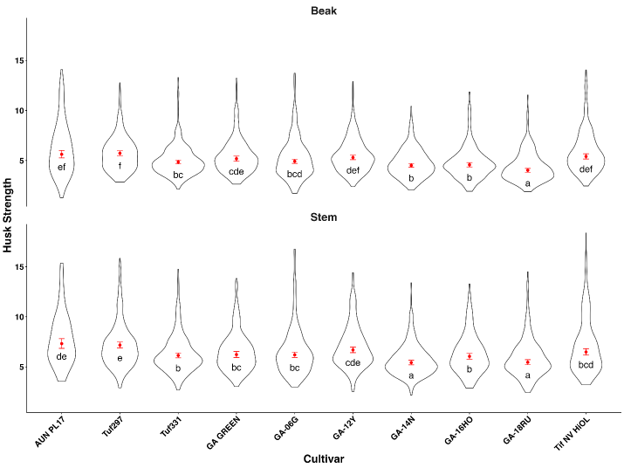
Figure 2. Effect of peanut cultivar and position on hull strength (N) from 2017 and 2018. Means within columns followed by the same letter are not significantly different; P < 0.05. Violin plots are shaped by the distribution of data values, with width reflecting observation density and internal markers showing summary statistics.
Discussion
GA-06G, the predominant peanut cultivar grown in Georgia for more than a decade, exhibited the greatest susceptibility to peanut burrower bug (PBB) injury in this study. However, the underlying cause(s) of its susceptibility compared to other cultivars remain unclear. We hypothesized that cultivars with pod hulls requiring greater force for proboscis penetration would be less susceptible to PBB feeding injury. Although TUFRunner 297 exhibited the greatest hull strength on both the beak and stem ends, this trait did not consistently correspond with reduced feeding injury. In 2017, TUFRunner 297 did not experience significantly lower pod injury than GA-06G, but in 2018 it did, suggesting that variation in hull strength alone is not sufficient to explain differences in PBB feeding injury among cultivars.
When examined more closely, GA-06G sustained significantly greater injury than only one cultivar (GA-12Y) in 2017, but in 2018 it had significantly greater injury than TUFRunner 297, FloRunner 331, and GA-14N. Although GA-06G exhibited significantly lower hull strength on both the beak side and stem side compared to TUFRunner 297, and on the stem side compared to GA-14N, these differences in physical strength were only associated with differences in feeding injury in a single year. These results indicate that while hull strength may affect PBB feeding, it was likely not the main factor influencing differences in feeding injury between GA-06G and other cultivars in 2017 and 2018.
Peanut burrower bug injury appears to be a multifactorial host pest interaction rather than the result of resistance conferred by a single gene underlying a single phenotypic trait. Factors such as the rate of pod hardening, pod moisture and oil content, and testa thickness may influence cultivar susceptibility to PBB feeding and were not evaluated in this study. Future research incorporating these factors may help identify specific mechanisms of resistance that could be manipulated in breeding programs to decrease PBB injury. Despite the unclear physiological basis of the susceptibility of GA-06G, the cultivar remained the most heavily injured cultivar in this study. As a result, planting alternative cultivars may reduce risk in fields that have a history of burrower bug infestations, particularly in years of high pressure such as 2018.
Host plant resistance remains the most viable long-term management strategy for PBB in the absence of effective insecticidal control options. Cultivated peanut has been described as possessing genetic bottle necks resulting from domestication and sexual reproductive isolation from wild relatives (Leal-Bertioli et al., 2021). This genetic bottleneck may limit the availability of strong resistance traits among modern commercial cultivars. In this study, hull strength was not the mechanism that explained GA-06Gs susceptibility to peanut burrower bug feeding which suggests that resistance may be governed by a complex antibiosis or antixenosis traits that are not readily apparent in commercial germplasm. Identification of these mechanisms, and subsequent introgression of resistance traits from wild species into breeding lines, would represent a critical step towards developing cultivars with improved resistance to PBB and reducing injury across peanut production systems in the southeastern United States.
Literature Cited
Abney M.R. 2014. Georgia Entomological Society arthropod survey. Georgia Entomological Society.
Abney M.R. 2015. Georgia Entomological Society arthropod survey. Georgia Entomological Society.
Abney M.R. 2016. Georgia Entomological Society arthropod survey. Georgia Entomological Society.
Abney M.R. 2017. Georgia Entomological Society arthropod survey. Georgia Entomological Society.
Abney M.R., Aigner B.L., Crosby P.M., and Hollifield S.. 2017. Peanut burrower bug (Hemiptera: Cydnidae) distribution and management in southeast U.S. runner type peanut. Proc. Amer. Peanut Res. Educ. Soc. 49:149 (Abstr.), Albuquerque, NM.
Aigner B.L., Crossley M.S., and Abney M.R.. 2021. Biology and management of peanut burrower bug (Hemiptera: Cydnidae) in southeast U.S. peanut. J. Integr. Pest Manag. 12:29.
Bates D., Mächler M., Bolker B., and Walker S.. 2015. Fitting linear mixed-effects models using lme4. J. Stat. Softw. 67(1):1–48.
Bogati S., Leclerc M.Y., Zhang G., Kaur Brar S., Tubbs R.S., Monfort W.S., and Hawkins G.L.. 2023. The impact of tillage practices on daytime CO₂ fluxes, evapotranspiration, and water use efficiency in peanut. Front. Agron. 5:1228407.
Branch W.D., and Brenneman T.B. 2015. Registration of ‘Georgia-14N’ peanut. J. Plant Regist. 9:159–161.
Branch W.D. 1996. Registration of ‘Georgia Green’ peanut. Crop Sci. 36:806.
Branch W.D. 2007. Registration of ‘Georgia 06G’ peanut. J. Plant Regist. 1:120.
Branch W.D. 2013. Registration of ‘Georgia-12Y’ peanut. J. Plant Regist. 7:151–153.
Branch W.D. 2014. Registration of ‘Georgia-13M’ peanut. J. Plant Regist. 8:253–256.
Branch W.D. 2017. Registration of ‘Georgia-16HO’ peanut. J. Plant Regist. 11:231–234.
Branch W.D. 2019. Registration of ‘Georgia-18RU’ peanut. J. Plant Regist. 13:326–329.
Cantón P.E., and Bonning B.C.. 2020. Extraoral digestion: Outsourcing the role of the hemipteran midgut. Curr. Opin. Insect Sci. 41:86–91.
Chapin J.W., and Thomas J.S.. 2003. Burrower bugs (Heteroptera: Cydnidae) in peanut: Seasonal species abundance, tillage effects, grade reduction effects, insecticide efficacy, and management. J. Econ. Entomol. 96:1142–1152.
Chapin J.W., Sanders T.H., Dean L.O., Hendrix K.W., and Thomas J.S.. 2006. Effect of feeding by a burrower bug, Pangaeus bilineatus (Say) (Heteroptera: Cydnidae), on peanut flavor and oil quality. J. Entomol. Sci. 41:33–39.
Georgia Pest Management Handbook. 2024. Vol. 1.2024 Commercial ed.Univ. of Georgia Cooperative Extension.
Hartig F. 2024. DHARMa: Residual Diagnostics for Hierarchical (Multi-Level / Mixed) Regression Models. R package version 0.4.7.
Holbrook C.C., Ozias-Akins P., Chu Y., Culbreath A.K., Kvien C.K., and Brenneman T.B. 2017. Registration of ‘TifNV-High O/L’ peanut. J. Plant Regist. 11:228–230.
Leal-Bertioli S.C.M., Nascimento E.F., Chavarro M.C.F., Custódio A.R., Hopkins M.S., Moretzsohn M.C., Bertioli D. J., and Araújo A.C.G.. 2021. Spontaneous generation of diversity in Arachis neopolyploids (Arachis ipaënsis × Arachis duranensis) 4x replays the early stages of peanut evolution. G3: Genes Genomes Genet. 11: [: jkab289].
Lenth R., and Piaskowski J.. 2025. emmeans: Estimated marginal means, aka least squares means. Version 2.0.0. R package. CRAN.
Liu L., Dang P.M., and Chen C.Y.. 2015. Development and utilization of InDel markers to identify peanut (Arachis hypogaea) disease resistance. Front. Plant Sci. 6:988.
Rowen E.K., Regan K.H., Barbercheck M.E., and Tooker J.F.. 2020. Is tillage beneficial or detrimental for insect and slug management? A meta-analysis. Agric. Ecosyst. Environ. 294:106849.
Smith J.W., and Pitts J.T.. 1974. Pest status of Pangaeus bilineatus attacking peanuts in Texas. J. Econ. Entomol. 67:111–113.
Tillman B.L., and Gorbet D.W. 2017. Registration of ‘TUFRunner ‘511’’ peanut. J. Plant Regist. 11:235–239.
Tillman B.L. 2018. Registration of ‘TUFRunner ‘297’’ peanut. J. Plant Regist. 12:31–34.
Tillman B.L. 2021. Registration of ‘FloRun ‘331’’ peanut. J. Plant Regist. 15:294–299.
U.S. Department of Agriculture. 2019. Peanut Buyers and Handlers Program guidelines for 2019 and subsequent crop years. FSA Handbook. USDA FSA, Washington, DC. https://www.fsa.usda.gov/sites/default/files/documents/1-PPG.pdf.
U.S. Department of Agriculture, National Agricultural Statistics Service. . Quick Stats: Peanut production—Georgia.
Wade T., and Claassen R.. 2017. Modeling no-till adoption by corn and soybean producers: Insights into sustained adoption. J. Agric. Appl. Econ. 49:186–210.
Wickham H. 2016. ggplot2: Elegant Graphics for Data Analysis. Springer-Verlag, New York.
Notes
- Assistant Professor, Department of Entomology, Virginia Tech Eastern Shore Agricultural Research and Extension Center, Painter, VA, 23420; [^]
- Research Scientist, College of Agricultural and Environmental Sciences. University of Georgia, Griffin, GA, 30224. [^]
- Professor, Department of Entomology, University of Georgia, Tifton, GA, 31793 [^] Corresponding author’s E-mail: Klsutton@vt.edu