

Peanut Growth and Development
Growth Requirements.
Peanut is a highly nutritious and high-valued crop worldwide; but achieving competitive yield and quality is often challenged by biotic and abiotic stresses as well as relatively high production requirements compared with other crops. To successfully address these challenges, it is important to understand peanut physiology and its essential requirements for growth and development.
Soil requirements:
It is generally accepted that peanut grows and produces best on light-textured soils with a pH between 6.0 and 6.5 (USDA-ARS, 2005; Putnam et al., 2014). Texture is an important soil physical property affecting the movement of water, nutrients, heat, and air with important effects on root development, crop growth and ultimately yield (Juma, 1993; Wu et al., 2011a). Because peanut fruits develop in the ground, soil texture is even more critical for peanut compared with other crops (Adams et al., 1993; Jackson et al., 2011). Root dry matter accumulation and distribution were greater in sandy and loam soils than clayey soils; and the largest kernels along with increased pod number resulted from peanut grown in sandy or loam than clay soil (Jia et al., 2013). However, enhanced crop establishment, more uniform stands, and improved seedling growth were observed on clayey soil and not sandy or silty soils (Zerbato et al., 2017). Zhao et al. (2015) compared peanut growth and yield on three soil textures at pH between 5.9 and 6.1, i.e. sandy soil with particle distribution of 9% <0.001 mm and 65 % 1-0.05 mm; loam with particle distribution of 19% <0.001 and 23% 1-0.05 mm; and clay with particle distribution of 45% <0.001 and 9% 1-0.05 mm. They observed significant effects of soil texture on the dry matter accumulation of stems, leaves and pods; number of flowers per plant; and dynamic changes in peg number through the growing season. For example, dry matter accumulation of stems and leaves was greatest at 47 days after beginning flower on all soil types; but on sandy and loam soils, dry matter accumulation was approximately 15% over that on clay. Similarly, pod weight was 19% less on clay at 70 days from beginning flower, probably because pod number was consistently less during 27 to 57 days after beginning flower on clay. Finally, on clay soil the number of flowers was consistently lower than on sandy and loam soils (Zhao et al., 2015). This and similar studies (Zheng et al., 2012) clearly show that understanding the relationship between peanut physiology and soil texture is essential for increasing yield and providing insights on moving towards reduced tillage practices in peanut production. Indeed, reducing the tillage to lower production costs is a tempting option currently practiced by many peanut growers in the USA. In addition to the apparent economic advantage, reduced tillage positively impacts water runoff and infiltration, and soil physical properties (Rowland et al., 2007). The main concerns with reduced tillage, however, are soil compaction, persistence of stubble from the previous crop, and inadequate soil bed-formation that could reverse the benefits of soil properties and decrease peanut yield (Jordan et al., 2003). For example, Jackson et al. (2011) showed greater yield when planting on raised vs. flat beds, depending on whether the soil was coarse or fine textured. Ripping and bedding along with conventional till of fine-textured soils reduced compaction and digging losses, and increased yield. Others (Rowland et al., 2007) were concerned with the inability of peanut gynophores to penetrate cover crop residue and produce pegs. They demonstrated that the combination of strip tillage and subsurface drip irrigation produced half the number of pods per plant compared with conventional tillage. Finally, sandy and coarse-textured soils may be preferred in peanut production. Still, they have less water holding capacity, and the water deficit can easily develop in absence of sufficient rainfall or irrigation. Indeed, more research is needed to elucidate how soil physical properties affect peanut productivity to develop more sustainable production systems in the future.
Water requirements
To grow and produce profitable yields, peanut needs a reliable water supply throughout the growing season. Nevertheless, 60% of global production occurs in semi-arid tropics of Asia and Africa, where these conditions are hardly met (Mortley et al., 2000). Even though considered resilient to water deficit, peanuts have relatively large water requirements, and yield and quality may be affected by erratic rainfall amounts and distribution (Singh et al., 1999; Halilou et al., 2015). Globally, only 16.2% of peanut acreage is irrigated, while the percentage of irrigated area is 49, 31, and 20% for cotton, wheat, and corn globally (Portmann et al., 2010). In the USA, 35% of peanut acreage is irrigated, with differences among growing regions, i.e., in Texas 95% of peanut is irrigated. In comparison, the Virginia-Carolina (VC) region only has 15% irrigation availability (USDA/NASS, 2019).
In a semi-humid environment, data from the Peanut Variety and Quality Evaluation (PVQE) replicated trials in Virginia and North Carolina showed that peanuts produced 6399 kg ha-1 pod yield under 574 mm rainfall and irrigation and yield decreased 8 kg ha-1 for each mm water below 574 mm (Fig. 1). This dataset is based on 30 Virginia market type genotypes (yields are mean of the 30 genotypes) grown under seven year-location environments in 2009 and 2010 (Balota, 2010; Balota, 2011). Not just yield, but a good grade requires adequate amounts of water for maximum quality and economic value. For example, Balota and Phipps (2013) compared the yield and grade of nine Virginia and runner peanut cultivars grown under rainfed conditions at the Tidewater Agricultural Research and Extension Center (TAREC), Suffolk, VA, in 2009 and 2010. In 2009, rainfall in Jun, Jul, and Aug totaled 388 mm while in 2010 only 14 mm occurred during the same time frame. Under this condition, pod yield was reduced by 26 % and economic value by 33 %. The reduction of the economic value was related to the reduction of sound mature kernels (SMK), extra-large kernels (ELK) and total sound mature kernels (TSMK), and increases of damaged kernels (DK) in a dry versus a wet year in the absence of irrigation. Similar decreases of SMK and TSMK were observed on runner peanut in Georgia when water was withheld for 3 weeks (Dang et al., 2013).
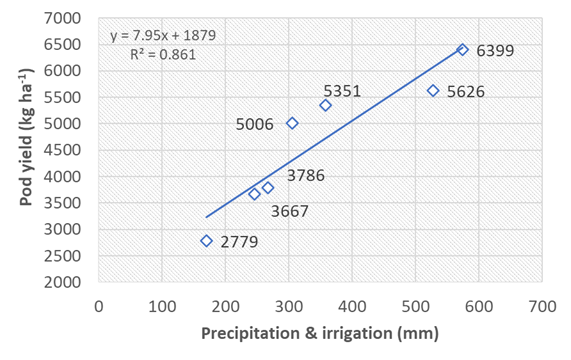
Figure 1. Dependence of peanut yield on the amount of water received from planting to maturity. Each data point represents an average of 30 Virginia market-type varieties tested in replicated trials of the Peanut Variety and Quality Evaluation (PVQE) test in Virginia and North Carolina at four locations in 2009 and three locations in 2010.
In Texas, in a semi-arid environment, Rowland et al. (2012a) showed similar water requirements for runner peanut, indicating that less than 550 mm of total rainfall and irrigation reduced yield and crop value significantly. In this study, the highest yields and values occurred when more than 600 mm of water was supplied to the crop; however, the authors also suggested that less than 600 mm can achieve similar economic value if irrigation is cut to 50 or 75% from the full norm at early growth stages, followed by full irrigation during late growth stages. This was called “primed acclimation” and was proposed as a new irrigation strategy in semi-arid regions conducive to acceptable peanut yields with less water (Vincent et al., 2020). Primed acclimation is based on translational stress memory, i.e. changes in gene expression and function over repeated stress events, and priming, i.e. a stress event may improve the physiological function under subsequent stress cycles, two relatively new concepts in plant biology (Bruce et al., 2007; Balmer et al., 2015; Hu et al., 2015; Racette et al., 2020). Based on plant physiological adaptations to water limitation that allowed accelerated root and flower production, and improved root to shoot partitioning, water use, and photosynthetic characteristics, primed acclimation was shown to work in peanut and other crops (Rowland et al., 2012a; Rivas et al., 2013; Fleta-Soriano et al., 2015; Racette et al., 2019; Vincent et al., 2019).
The temporal distribution of water is important in peanut production. Even though water is needed mainly during the flowering, pegging, and seed growth stages (Rowland et al., 2012a), good stands also need a reliable continuous water supply. Depending on the growth stage and evaporative demand, peanut requires from 25 mm of water weekly in the early stages to 75 mm at seed filling stage, which is difficult to achieve in the absence of irrigation (Putnam et al., 2014). For example, historical data in Virginia shows that 25 mm of rainfall per week is available during peanut early growth stages. However, 75 mm per week from the beginning seed to physiological maturity is rarely received. The weekly rainfall variation is also greater for later than for early peanut growth stages because of summer versus late spring rainfall patterns. The demand for irrigation and timing can be based on simulations with daily monitored weather data using the Cropping System Model (CSM)-CROPGRO-Peanut. CSM-CROPGRO is a decision support system for agrotechnology transfer (DSSAT) and peanut is one of more than 40 crops that can be modeled using this system (Tsuji et al., 1994; Jones et al., 2003; Hoogenboom et al., 2023).
In the coming era of the “water crisis”, it is estimated that increased global food production, including peanuts, will continue to come from rainfed agriculture in developed and developing countries alike; resilience to water scarcity will have to come from more efficient water use by the new cultivars and innovative production systems that exploit plant adaptive physiological mechanisms to water deficit (Rosegrant et al., 2002; FAO, 2012; Vincent et al., 2019).
Germination requirements
Temperature affects peanut germination, growth, and development, with cardinal temperatures being different for each physiological stage. To germinate, peanut needs a base temperature (Tb), i.e. minimum temperature triggering germination, of 13.3 C; optimum temperature (To), i.e. optimum temperature for maximum rate and percent of germination of 25.5 C; and maximum temperature (Tm), i.e. germination ceases at this temperature, of 43 C (Cox and Martin, 1974; Caroca et al., 2016; Grey et al., 2016). Vegetative growth is best at average temperatures ranging from 25 to 30 C. For reproductive growth, somewhat lower temperatures, in the range of 20 to 25 C, are optimum; temperatures over 35 C have a detrimental effect on pollen fertility and pollination and, consequently, yield (Ketring, 1984; Prasad et al., 2003). However, temperature requirements and thresholds vary somewhat with genotype and environment. For example, in Chile, a study including four peanut genotypes showed that Tb for germination ranged from 11.3 to 12.5 C; To from 30.5 to 33.4 C, and Tm from 40.8 to 44.9 C (Caroca et al., 2016). In Florida, USA, Tb for the rates of emergence and development to V2 stage were 11.7 and 9.8 C, respectively, with no significant difference among the six genotypes studied. The thermal time needed to reach 50% germination ranged from 77.2 to 155.2 Cd, and to reach V2 stage, from 144.6 to 218.9 Cd with significant effects of soil temperature and genotype (Prasad et al., 2006). On a thermal gradient table, the germination pattern was non-linear, but the optimum range was similar to field conditions and varied from 22 to 30 C (Grey et al., 2011). However, these differences are likely related to the definition of germination among these researchers. Grey et al. (2016) found that the thermal time to reach max rate for germination and 80% germination, as indicators of seed vigor, were dependent upon genotype, i.e. Georgia Green had greater vigor than Florida-07 across experiments. Germination depended on the year in which seed was produced, at least compared among six years, 2006 to 2012. Seed size was important, and larger seeded cultivars had less seed vigor than smaller-seeded cultivars. In addition to genetic and pre-harvest conditions, post-harvest factors including seed age, i.e. the number of years seed was in storage, contribute to reduced germination and seed vigor, as well as subsequent plant growth. Among the post-harvest factors, seed moisture content, pest and mechanical damage, and ambient storage temperature and relative humidity are the most important (Morton et al., 2008; Isleib et al., 2014).
Factors Affecting Seed Quality, Germination, and Early Growth
Germination begins with water absorption, imbibition, and activation of enzymes needed to degrade seed compounds used for hypocotyl elongation, radicle extension, and cotyledonary leaf opening (Gonnety et al., 2007; Wang et al., 2018). This period is characterized by intense uptake of oxygen and production of carbon dioxide (Prasad et al., 1969; Raymond et al., 1985). Often, “natural anaerobiosis” can develop when the need for oxygen exceeds the supply even under adequate aeration, resulting in accumulation of ethanol, lactate, acid phosphatase enzymes, and cytokinin levels that reach maximum at 5 days after germination initiation (Leblova et al., 1974; Swamy and Sandhyarani, 1986; Gonnety et al., 2007).
On the first day of germination, the most notable change is water content increases up to 65% of the seed weight (Li et al., 2014). Sugars and fatty acids in cotyledons provide the initial energy needed to begin synthesis of DNA, RNA, and new proteins and enzymes ( et al., 2013). Hydrolysis of storage proteins generates free amino acids such as methionine and proline with maximum production at approximately 8 days after imbibition (Isola and Franzoni, 2000). Enzyme and mitochondrial activity are also maximal at approximately 8 days after imbibition (Cherry, 1963) when storage lipids are converted into sugars, which are transported to the growing embryo (Castelfranco et al., 1969). During germination, the cotyledons can lose 60% of their total dry weight and 70% of the proteins which are transferred as amino acids to the forming embryo (Ruiz et al., 2013). Biotic and abiotic factors such as water, temperature, soil mineral and microbial composition, and post-harvest storage conditions can affect germination (Ruiz et al., 2013).
Water availability plays a major role in germination, with larger seeded peanuts needing more water for imbibition than the smaller seeded cultivars (Pallas et al., 1977). Depending on soil water availability, temperature can affect germination differently, for example, hot and dry soils may extend dormancy (Alpert, 2005; Brevedan et al., 2013). Excessive soil moisture, on the other hand, decreases germination rate because of oxygen deprivation (Brevedan et al., 2013).
Seeds drier than 1% may experience loss of viability from altered plasma membrane and electrolyte leakage (Retamal et al., 1990; Walters and Engels, 1998). For overly dry seeds, desiccation signals the production of regulatory molecules inducing dormancy as a survival mechanism (Buitink, 2007). However, once germination begins, the ability of seed to survive desiccation through dormancy is lost and the radicle does not have desiccation tolerance (Hong and Ellis, 1992; Silva et al., 2017).
Offspring of stress-exposed parents can become more tolerant to a particular stress through transgenerational stress memory (Iwasaki and Paszkowski, 2014). In this way, seeds of drought-stressed peanut parents belonging to hypogaea and fastigiata subspecies germinated better under water deficit than seeds from non-stressed parents (Racette et al., 2019). However, stress memory did not apply to peanut seeds previously grown in saline soils. Specifically, saline-grown seed resulted in germination decrease to 57% from 82%. A decrease in germination velocity from 70% to 33% was observed for saline-grown seed vs non-saline seed (Meena and Yadav, 2018).
Increased salinity of soils and irrigation water are becoming major concerns for global crop production (Meena et al., 2016) with negative effects on seed germination, emergence, and early plant growth and survival (Demir and Mavi, 2008; Yuan et al., 2010; Chakraborty et al., 2019). Salt binds water molecules, reducing water availability to the plants, negatively affecting growth. While mechanisms of cellular and subcellular protection can be triggered by increased salt concentrations of soil water, i.e. accumulation of osmotic protectants, salinity applied to the parent plant has negative effects on peanut seed quality (Isola and Franzoni, 2000; Girija et al., 2002; Lim et al., 2012; Meena et al., 2016).
The temperature of the soil at planting is a dominant factor for the onset and rate of seed germination. In standard tests, germination rate increases linearly with temperature from Tb to To and levels off or decreases after Tm is reached (Roberts, 1988). For example, in field trials, peanut emergence rate was 50 to 70% at 14 C and increased to 85% when temperature was 25 C, then leveled off or decreased as soil temperature increased to 32 C (Prasad et al., 2006). The temperature effect is related to the enzymatic activity needed to produce carbohydrates from fatty acids via β-oxidation in the germinating seed (Bagley et al., 1963; Ketring, 1979). It is also related to the regulation of genes encoding membrane and organelle protection under cold and dehydration from freeze (Luster, 1985; Tang et al., 2011). Regions of the USA peanut belt like Virginia, Carolinas, Florida, Georgia, and Western Texas, and other global regions such as Pakistan, Northern India and Indonesia are prone to sub-optimal temperatures for peanut germination and emergence (Prasad et al., 2006).
Mineral and microbial composition of seed and soil affect successful germination. Peanut germination is dependent upon calcium (Ca) and boron (B) content in the seed (Harris and Gilman, 1957; Adams and Hartzog, 1979; Guerke, 2005). Optimum germination of runner peanut, i.e. 95% germination, occurred when seed Ca concentration exceeded 600 mg kg-1 (Howe et al., 2012), but this can vary from a minimum of 450 mg kg-1, which has been recommended for runner and Virginia-type peanut (Spears, 2000; Spears, 2002), to over 700 mg kg-1 (Guerke, 2005). Ca is diffused into the soil solution and then into the pods during pod and seed maturation (Beasley et al., 1989). When seed B was less than 13 mg kg-1, B deficiency developed causing decay of the cotyledons and seed discoloration and malformation between the two cotyledons called “hollow heart” (Harris and Gilman, 1957; Netsangtip et al., 1987). Because sandy soils are often deficient in Ca and B, the application of gypsum (CaSO4) and elemental B are essential in peanut production for quality seed. Current production guides in Virginia, Carolinas, and the SE peanut region recommend application of 300 kg Ca ha-1 when soil Ca content is less than 670 kg ha-1 for Virginia and 450 kg ha-1 for runner types. Recommendations for B require application of 0.30 to 0.60 kg B ha-1 when soil test indicates less than 0.2 kg ha-1 available B, even though relatively new research failed to identify a need for B under current production systems (Benton, 2016). There is increasing evidence that zinc (Zn) is becoming deficient in soils worldwide (Aboyeji et al., 2019). Like Ca and B, Zn is essential for the seed development of many crops, including peanuts (Aboyeji et al., 2019; Rahman et al., 2019).
Specific soil pathogens and residual chemical compounds from previous crops can reduce germination. For example, peanut germination was reduced when sown after sorghum while sorghum roots decomposed (Sène et al., 2000). To prevent infection and improve germination, seed is usually treated with commercial fungicides. Alternatively, naturally produced phytoalexins and polyphenolic antioxidants by germinating seed, or induced by seed microbial colonization with Rhizopus oligoporus, showed a positive effect on peanut germination (Bell, 1984; Cevallos-Casals and Cisnerose-Zevallos, 2010; Sobolev et al., 2010; Wu et al., 2011b; Ahuja et al., 2012; Gan et al., 2017).
Finally, post-harvest storage conditions can affect seed quality (Coffelt et al., 1979). For example, excess rainfall close to harvest can induce sprouting. Sprouted seeds have low nutritional quality and are rejected by food processors; such seed cannot be stored for planting the following year (Vishwakarma et al., 2016). Seed moisture, and storage temperature and humidity can alter germination of peanut (Steele, 1983). Usually, farmer-stock peanuts are dried to 8 to 10% seed moisture for short time storage, e.g. six months, with no significant effect on seed quality and fungal contamination (Smith et al., 1989). In this way, seed can be stored up to one year at ambient temperature of 13 C and 55 to 70% relative humidity and maintain their germination and vigor potential (Butts et al., 2017; Weaver et al., 2021). Reducing seed moisture below 6% appears to allow for higher storage temperature and humidity without effecting seed vigor (HongYan et al., 1997; Sastry et al., 2007; Shinde et al., 2012).
Physiological Growth Stages
As a day-neutral plant, peanut growth and development are not affected by day length; however, peanut needs approximately 2200 Cd growing degree-days (GDD) or approximately 90 to 150 days after planting (DAP) to mature. Boote (1982) developed growth stage descriptions for peanut based on vegetative (V) and reproductive (R) observable events. Except for VE and V0, which were based on the appearance of the cotyledonary leaves aboveground, V stages were numbered from V-1 to V-(N) based on the developed nodes on the main axis and unfolding of the tetrafoliolate leaflets from the first to Nth tetrafoliolate. Eight R stages were identified, with R1 being beginning bloom, i.e. one open flower at any node on the plant; R2 beginning peg, i.e. one visible gynophore on the plant; R3 beginning pod, i.e. one peg swollen belowground; R4 full pod, i.e. one fully-expanded pod; R5 beginning seed, i.e. one seed with visible growth of cotyledon when cross-sectioned; R6 full seed, i.e. one pod with entire cavity filled by seed when fresh; R7 beginning maturity, i.e. one pod showing blotching of inner pericarp or testa; R8 harvest maturity, i.e. 75% of all developed pods have testa or pericarp coloration; and R9 over-mature pod, i.e. one undamaged pod showing orange-tan coloration of the testa or natural peg deterioration (Table 1; Fig. 2) (Boote, 1982). To reach each growth stage, specific thermal time or GDD is needed, and this is dependent upon the peanut type, cultivar, and environment. Runner type peanuts reach R8 in over 160 d after planting and spanish-type in approximately 140 to 145 d in West Texas; whereas in South Texas, spanish-type matured in only 110 to 135 d (Smith and Simpson, 1995; Lopez et al., 2003; Burrow et al., 2014b). The new runner ‘Tamrun OL12’ and spanish ‘Schubert’ peanuts developed in Texas reach R8 two weeks sooner than older cultivars (Burrow et al., 2014a, b); the new Virginia type cultivars developed for the VC reach physiological maturity in approximately 1800 Cd in comparison with old cultivars at 2500 Cd (Caliskan et al., 2008; Balota and Phipps, 2013; Jordan et al., 2018). Developing early maturing cultivars has become an important goal for breeding programs in the USA, especially in drought-prone environments like Texas, Oklahoma and New Mexico because of limited ground water availability, and in SE and VC regions because late season disease pressure and excessive moisture may reduce yield of late maturing cultivars. In Virginia, runner and Virginia type cultivars required on average 400 Cd or 43 d from planting to reach stage R150, i.e. 50 percent of the plant population has at least one open flower; and 200 to 300 Cd or 7 to 10 days from R150, to R2, beginning peg (Balota and Phipps, 2013). This is within the ranges described for runners in Georgia and Florida (Prasad et al., 2001; Rowland et al., 2007). To reach R7, runner and Virginia cultivars grown in Virginia needed 954 Cd and 900 Cd, respectively, from R1. On average, both peanut types, 897 Cd was needed to reach R7 in a humid year and 956 Cd in a dry year (Balota and Phipps, 2013). Similarly, in Georgia, the duration of developmental phases and GDD requirements of ‘Georgia Green’ (Branch et al., 1996) runner peanut were longer under water deficit (Suleiman et al., 2013). Because peanut growth and development is dependent upon cultivar and environment, and direct measurements are time consuming and laborious, simulation models to predict peanut growth, development, and yield have been developed. CSM-CROPGRO-Peanut within DSSAT is one of them (Boote et al., 1989; Suriharn et al., 2008, 2011; Putto et al., 2013). Others, i.e. APSIM (Keating et al., 2003) and CropSyst (CROP System) (Stockle et al., 1994), and Simple Simulation Model (SSM) (Noorhosseini et al., 2018) have also been used for peanut and provided adequate levels of accuracy.
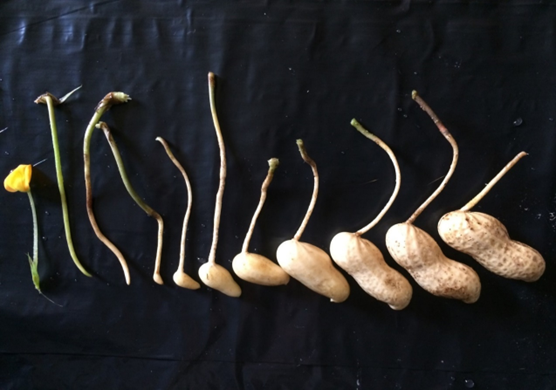
Figure 2. Peanut flower, pegs, and pods at different developmental stages: R1, R2 (2nd & 3rd), R3 (4th & 5th), and R5 (8th & 9th). R7 and R8 are the10th & 11th pods in the image, assuming internal coloration.

Peanut growth stage description.
Determining when harvest maturity (R8) is reached is essential for peanut producers. The most frequently used method is the Williams and Drexler (1981) method using “maturity profile boards” (Fig. 3). This method is based on the temporal change of pod mesocarp color as seeds fully develop from R6 to R7 to R8, i.e. mesocarp color changes from white, denoting immature pods, to yellow, orange, brown and black, with brown and black indicating fully mature pods. In this method, the proportion of these colors is determined in a sample of approximately 150-200 pods freshly collected from the field. To reveal the mesocarp, hull exocarp is removed by high pressure washing or sand blasting with glass beads under high pressure washing. Pods are then placed on profile board and grouped by color. Even though different profile boards exist for different peanut types, they all allow projection with sufficient confidence of the optimal harvest maturity based on the proportion of pods within each color group (Fig. 3).
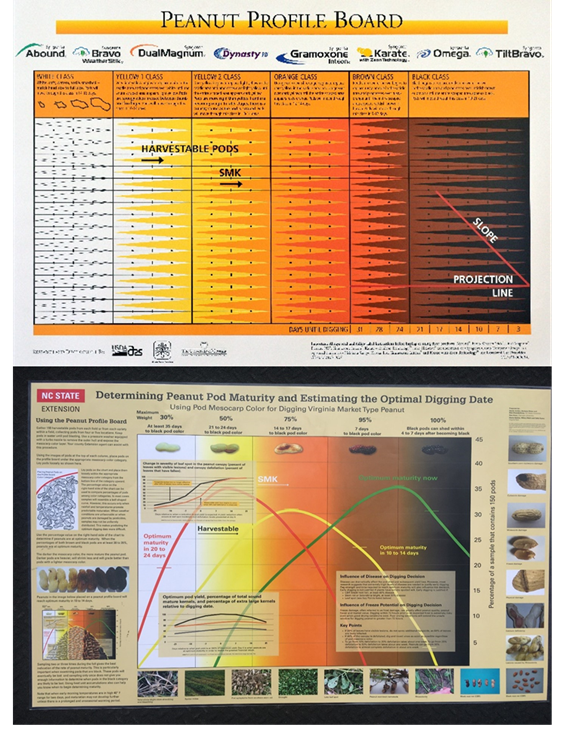
Figure 3. Maturity profile boards for runner (top) and Virginia (bottom) market type peanut used to determine harvest maturity (R8) by the Williams and Drexler (1981) method. Drs. Marshall Lamb, USDA-ARS, and David Jordan, North Carolina State University, are kindly acknowledged for providing the photos for these charts.
Even though hull color is largely accepted by growers of the USA peanut belt, this method has been challenged as subjective, i.e. color assessment and grouping depend on the ability of the operator, and time consuming. Therefore, predictive models have also been developed, along with automated digital analysis of pod mesocarp color to improve the accuracy of the hull method (Colvin et al., 2014; Bindlish et al., 2017). Several methods were developed in the 60’s and 70’s; for some of these, descriptions are available in Sanders et al. (1982). Most models currently used are based on thermal time and cardinal temperatures (Tb and Tm) necessary to achieve R8. Modern approaches using canopy spectral reflectance and peg strength are also underway to offer even more dependable solutions (Carley et al., 2008; Rowland et al., 2008; Sorensen et al., 2015; Monsef et al., 2019; Santos et al., 2021; Santos et al., 2022). Table 2 presents past as well as recently developed maturity predictive models.

Methods, equations, and reflectance indices used to estimate peanut maturity.
Morphological Characteristics
Morphological characteristics of crops are important determinants of yield. Because the harvestable peanut crop develops underground, reliable evaluations of crop progress during vegetative growth are difficult for peanut; during early growth stages, evaluations solely rely on the aboveground morphological traits and their association with plant physiology and yield. Even though time consuming and difficult to directly measure, traits such as biomass amount and color, plant height, lateral branching length and number, leaf area, and leaf area index (LAI), are associated with peanut environmental resilience and breeding for these traits has been shown to be superior to breeding for yield alone (Nigam et al., 2005). Nonetheless, remote sensing tools that are now available can provide dynamic and accurate phenotyping of the morphological characteristics of a canopy and, depending on the application, with single plant and leaf detail (Jones and Vaughan, 2010; Tester and Langridge, 2010).
Plant architecture is an important morphological characteristic of crops. Plant height, leaf mass, LAI, i.e. leaf area distribution per unit land area, and leaf orientation relative to solar zenith angle are directly related to the light capture for photosynthesis, growth, and production of all crops including peanut (Radford, 1967; Mane et al., 2017; Zurweller et al., 2018a). Therefore, they are important determinants of yield.
For peanut, in addition to light harvest, plant architecture derived from the growth angle of the lateral shoots or so called “growth habit” is important because the peanut flowers are produced aboveground, but the fruits develop underground at the end of specialized fruiting organs called gynophores or pegs. The gynophores appear after pollination above ground and, after entering in the ground, their tips start to swell to produce the pods and then the seeds. Under drought, hot and dry soil may prevent gynophores from penetrating into the ground and forming pods (Fig. 4). In addition, high soil temperature can scorch the gynophore when the tip touches the soil, restricting seed development.
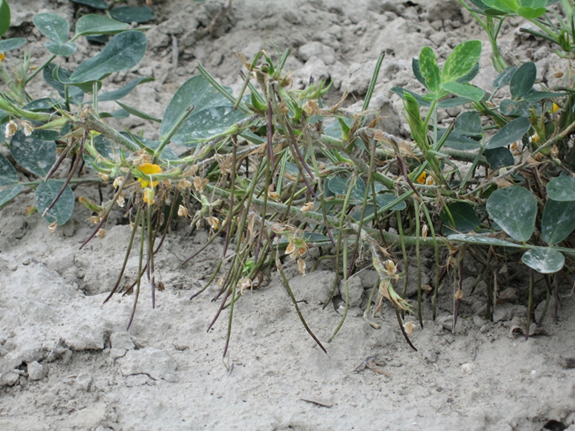
Figure 4. Elongated gynophores (pegs) on a lateral branch with prostrate growth. In this picture, ‘Titan’ peanut has developed numerous pegs but their entry to the soil is delayed because of dry conditions.
Four distinct growth habits have been identified for domesticated peanut (Fig.5 a, b, c, d) (Coffelt, 1974; Pittman, 1995). A prostrate growth habit is defined by lateral branches that spread on the soil surface while the main stem is easy to see but relatively short (Fig. 5a). A spreading growth habit is when lateral branches are only partially on the ground because their tips are curved upward; the main stem is easy to see, yet relatively short (Fig. 5b). A bunch growth habit is defined as semi-erect branches curved upwards, beginning at the base; the main stem is relatively taller than for the prostrate and spreading growth habits (Fig. 5c). Finally, erect growth habit peanuts have branches that grow straight up from the base and are generally 45º or less from the vertical; with relatively tall main stem (Fig. 5d). Growth habit differences among botanical types of cultivated peanut are apparent beginning at early growth stages (Fig. 6). For example, a study in Virginia in 2019 showed small differences among peanut types for the length of lateral branching, but differences were great for the main stem height (Sarkar, unpublished). In this study, Valencia and Spanish genotypes were taller than Virginia and runner types from 30 to 75 DAP; and at 75 DAP height, lateral branching, and LAI plateaued or started to decrease for all types, while biomass increased vigorously (Fig. 7).
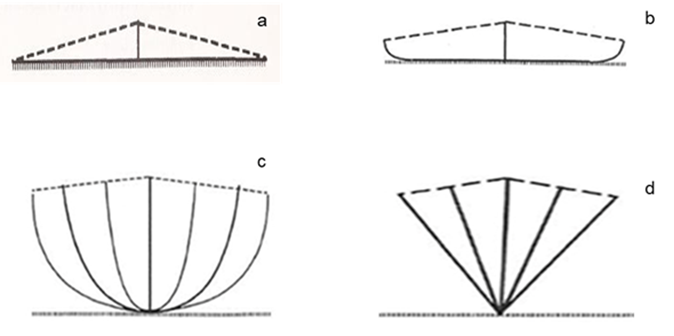
Figure 5. Main types of growth habit of cultivated peanut (from Pittman, 1995). Prostrate (a), spreading (b), bunch (c), and erect (d).
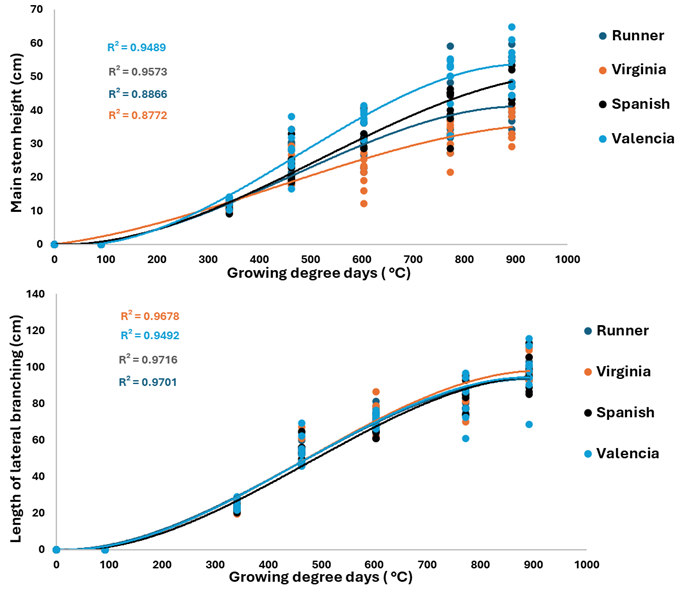
Figure 6. Early season differences for the main stem height and spread of lateral branching for the main types of peanuts grown at the Tidewater AREC in Suffolk, VA. Each type is an average of 2 genotypes and 3 replications (adapted from Sarkar, unpublished).
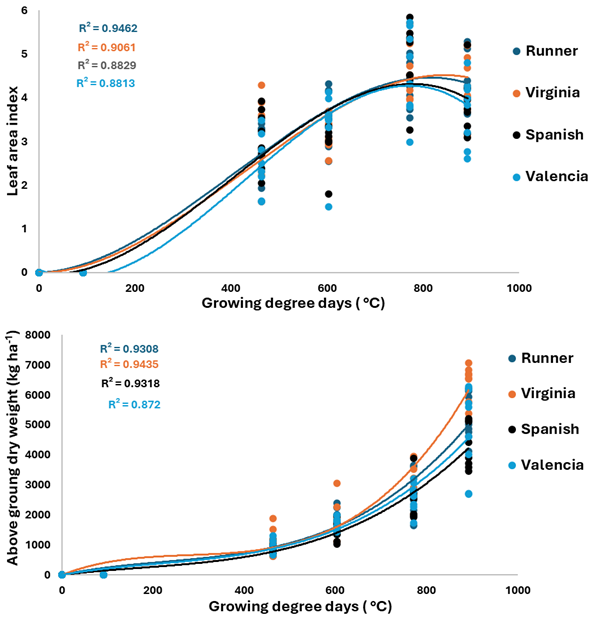
Figure 7. Development of the leaf area index and above ground biomass for the major peanut types up to 75 days after planting at the Tidewater AREC in Suffolk, VA (adapted from Sarkar, unpublished).
Since 1950, the USA peanut yield has increased approximately 46 kg ha-1 yr-1 (USDA-NASS, 2019). This increase is attributed to greater yield potential of newer cultivars with higher seed weight per seed, reproductive efficiency and disease resistance, and improved cultural practices (Coffelt et al., 1989; Isleib et al., 2001; Haro et al., 2013). Nonetheless, in both North and South America, part of the yield increase has also been attributed to shifting the growth habit of the new cultivars from erect growth of the fastigiata types to prostrate growth of the hypogaea descendants (Haro et al., 2013). This shift was associated with increased LAI, aboveground biomass accumulation, interception of photosynthetic active radiation, and harvest index (Haro et al., 2017). The harvest index increase seems to have come from increased weight per seed and number, increased partitioning intensity to pods, and more efficient partitioning of thermal time towards greater seed-filling duration (Duncan et al., 1978; Haro et al., 2015).
Recognized as an important agronomic trait contributing to yield, peanut growth habit has been widely studied to find the “ideotype” of peanut, i.e. peanut with optimum plant architecture that has comprehensive agronomic traits known to positively influence photosynthesis, growth, and yield. In addition, crop architecture has been considered as an important trait to breed for to improve mechanical cultivation, disease resistance and drought tolerance of peanut (Donald, 1968; Butzler et al., 1998). Numerous studies identified that early biomass accumulation and LAI are important characteristics related to peanut tolerance to water deficit stress (Kiniry et al., 2005; Nigam and Aruna, 2007; Arunyanark et al., 2008; Zurweller et al., 2018a; Zurweller et al., 2018b). In these studies, water deficit stress reduced biomass and LAI more for drought susceptible than for drought tolerant cultivars; LAI was positively related to pod yield. The length of main axis and cotyledonary branches was reduced, and taller plants wilted faster than shorter peanuts under soil moisture deficit (Fig. 8) (Reddy et al., 2003; Sarkar et al., 2022). Drought also reduced plant density, light interception by plants, and dry matter accumulation (Pandey et al., 1984; Bell et al., 1993; Collino et al., 2001).
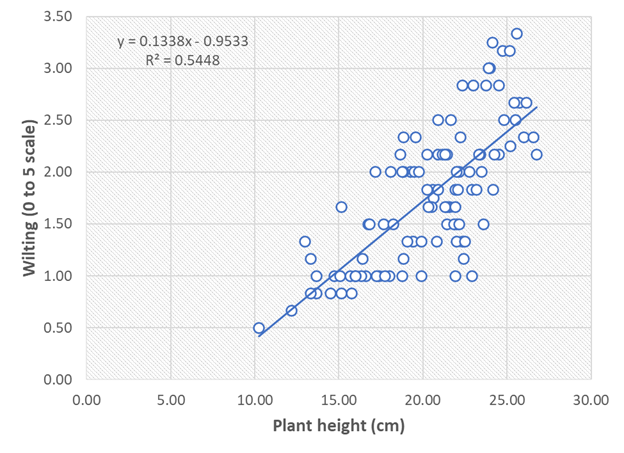
Figure 8. The relationship between peanut height and wilting at the full pod stage (R4) in response to high temperature and soil drying in a sub humid environment. Each point represents an average of three replications for 104 genotypes of the Mini-core peanut collection. Wilting was visually scored on a scale from 0 to 5, i.e. 0 = no visual wilting; 2 = upper branches showing rolled leaves; 3 = upper and mid branches showing rolled leaves; 4 = upper and middle canopy becoming dry; and 5 = entire plant severely dry (Sarkar et al., 2022).
In addition to crop water deficit stress, peanut canopy architecture can affect disease resistance. For example, upright and less dense canopies contributed to plant resistance to soil borne diseases by creating microclimates with reduced opportunities for plant contact with infested soil (Chappell et al., 1995; Hollowell et al., 2008). Upright canopies of Spanish market type peanut cultivars were more resistant than runner and Virginia types to Sclerotinia blight (Coffelt and Porter, 1982; Chappell, et al., 1995; Goldman, et al., 1995). Studies by Blad et al. (1978) compared soybean (Glycine max (L.) Merr.) cultivars with different canopy architectures. These authors found that dense and shorter canopies had the coolest, wettest microclimate and increased severity of white mold (caused by Sclerotinia sclerotiorum (Lib.) de Bary) than cultivars with open canopies and upright growth habits which were warmer, drier, and had a low incidence of white mold. Similarly, treatments supporting or maintaining dense foliar canopies such as irrigation resulted in the highest incidences of stem rot (caused by Sclerotium rolfsii Sacc.) in peanuts (Shew and Beute, 1984).
In other crops, e.g., corn (Zea mays L.), components of plant architecture such as plant height are directly related to yield and proposed as selection tools for increased yield (Freeman et al., 2007; Yin et al., 2011). Phenotyping for plant architecture by direct measurement of its components is tedious and logistically difficult to accomplish in large breeding populations. Fortunately, biomass, LAI, plant height, and lateral branching can be estimated with sufficient accuracy using remote sensing and imaging technologies; research of this type has recently started for peanut (Yang et al., 2017; Sarkar et al., 2020). Alternatively, the development of molecular markers for marker assisted selection (MAS) may offer viable options to improve peanut architectural components contributing to improved yield, and resistance to biotic and abiotic stresses. Numerous recent studies in peanut are geared towards the development of high-density genetic maps to connect molecular markers to plant height, first lateral branching, and total branch numbers (Hake et al., 2017; Kayam et al., 2017; Li et al., 2017; Lv et al., 2018; Wang et al., 2018; Li et al., 2019).
Leaf color and specific leaf area are often associated with tolerance to water deficit stress in peanut via improved transpiration efficiency (TE) and water use efficiency (WUE), i.e. carbon assimilated, or biomass accumulated per unit of water used by or applied to the plants. For example, specific leaf area (SLA), i.e. leaf area divided by leaf weight, and leaf color or relative chlorophyll content determined non-destructively from light transmission through the leaf using a SPAD-502 color meter (Spectrum Technologies, Inc, Aurora, IL) showed good correlations with peanut yield and water use characteristics, i.e. 13C discrimination (Δ13C), TE, and WUE, across numerous environments (Nageswara Rao and Wright., 1994; Bindu Mathava et al., 2003; Rowland and Lamb, 2005; Upadhyaya, 2005; Sheshshayee et al., 2006; Arunyanark et al., 2008; Nigam and Aruna, 2008; Songsri et al., 2008; Balota et al., 2012a; Chen et al., 2013; Singh et al., 2014). However, in micro-plot experiments in India, under well-watered conditions, yield did not correlate well with TE (Vadez and Ratnakumar, 2016). In general, SPAD was positively, and SLA negatively related to yield (Janila et al., 2015), but not always. In some studies, high rather than small SLA was associated with high yield (Balota et al., 2012a; Suriharn et al., 2011). Because significant diversity in response to water deficit was found in peanut genotypes and for simplicity of measurements, SLA and SPAD were further proposed and used as surrogate traits for breeding for high yield and efficient water use in cultivated peanut (John et al., 2014; Vasanthi et al., 2015). They were also proposed for evaluation of drought tolerance of wild species (Leal-Bertioli et al., 2012), used with crop simulation models to design peanut “ideotypes” (Suriharn et al., 2011), and were further studied to identify potential molecular mechanisms underlying these morphological characteristics (Dang et al., 2013).
Root architecture is essential for the acquisition of water and nutrients, and its adaptation to specific environmental conditions is important for plant growth and development, especially under stressful conditions. For example, peanut genotypes with deeper roots produce relatively greater pod yields under water stress conditions than genotypes with more shallow roots (Rucker et al., 1995; Songsri et al., 2008; Jongrungklang et al., 2011; Jongrungklang et al., 2012). While shifting from erect to prostrate growth habit was clearly related to increased yield potential in peanut, little is known about how this shift affected root morphology; and how root morphology contributed to the current growth in yield (Coffelt et al., 1989; Seaton et al., 1992; Haro et al., 2013). Zurweller et al. (2018a) showed that fastigiata genotypes had greater total root length than hypogaea, but similar root total surface area distribution at 80 cm of soil depth. These authors concluded that more prolific root growth at depth may not necessarily result in an advantage for increased water acquisition and utilization, and higher yield of peanut. However, this conclusion may only reflect the years, location, and genotypes used in this work. Therefore, more research is needed to elucidate the role of root morphological characteristics for peanut yield and performance under environmental stress. Nonetheless, root analysis is more complicated when performed at field scale than with aboveground biomass, and current methods are imprecise, expensive and laborious. At the same time, relying on root analysis in controlled conditions is not an option for breeding programs because the physiological and morphological root adaptations are highly dependent on the environment in which plants grow (Cattivelli et al., 2008; Sinclair, 2011). Identifying new methods for field scale root analysis under conditions where plants are grown seems to be an important benchmark for peanut in order to elucidate the importance of root morphology to yield and quality. New methods using remote sensing and non-invasive techniques such as ground penetrating radar (GPR) hold promise to address this aspect. Used with success to detect and measure coarse roots of trees nondestructively (Barton and Montagu, 2004; Cox et al., 2005), GPR is now being tested for efficacy in detecting fine roots of agricultural crops (Liu et al., 2018), including peanut. For example, the peanut breeding program in Lubbock, TX, is currently working with Dr. Hayes’s group at Texas A&M University to evaluate the GPR efficacy to detect root traits (Burrow, personal communication).
Stress Effect on Peanut Physiology
Water Deficit Stress
Water deficit stress is responsible for more crop loss than any other abiotic or biotic stress. In peanut, recent work is focusing on understanding physiological responses associated with plant dehydration (Borém et al., 2012). Examination of these physiological responses is often done under the context of identifying specific plant traits governing possible tolerance to “drought” conditions. In general, water deficit tolerance refers to crop traits providing adaptations of dehydration avoidance or tolerance strategies to water limitation (Blum, 1988; Pallardy, 2007), while drought refers to the severity and timing of water deficit events occurring during crop development in a given environment. Avoidance is different from tolerance; avoidance can be accomplished by deeper rooting to sustain water uptake, while tolerance is more related to survival via osmotic adjustment. An intermediate strategy can be that of reducing transpiration (whether caused by stomatal response to VPD or naturally low hydraulic conductance) to maintain relatively high turgor and less stress, while forgoing some carbon gain from photosynthesis whereby some yield may be lost.
In the United States, peanut production is primarily in the southeast (GA, FL, AL, MS), southwest (TX, OK, NM), and the Virginia-Carolina (VC) region (VA, NC, SC). The Ogallala aquifer is the primary source of irrigation for production of peanuts, cotton, corn, sorghum, and wheat in the southwestern U.S. This aquifer has been used heavily since the 1950s and, although irrigation efficiency has improved, the current rate of decline in the water table is 0.8 – 1.1 feet per year and it is estimated that the aquifer could be depleted within 30 to 40 years (Paxton, personal communication). Decline in some locales is already reducing the ability to irrigate when plant demand is the highest, during the midsummer months from flowering to mid-pod fill when air temperatures routinely exceed 40 C. For the southeastern U.S. peanut producing region, there are also issues of water scarcity compounded with high growing season temperatures. This region is not inherently thought of as having water resource issues, but because rainfall is typically erratic during the growing season and groundwater supplies are increasingly being diverted to rapidly growing major urban areas, the issues related to water quantity are reaching critical proportions. Similarly, in the VC region, precipitation amount and distribution are erratic, and, unlike the other regions, irrigation is unavailable for over 90% of the peanut growing land. In addition to the obvious implications for yield, a significant concern is that water deficit stress promotes production of the highly carcinogenic aflatoxin mycotoxins (Butts et al., 2023; Williams et al., 2004), which can be minimized by irrigation.
Recent examples abound of abiotic stress affecting U.S. peanut production. Approximately one-third of Texas peanut acreage was not harvested in 2000 and again in 2011 due to drought and heat stress. In Georgia, drought and aflatoxin contamination of the crop resulted in an inability to market large quantities of peanuts in 2002 and 2019. In Virginia, severe drought in 2010 caused a 60% decline of the state average yield. The severe drought in 2006 and 2007 caused a 40% decline in southwest peanut production. On a global scale, the effects of these abiotic stresses on peanut crops are increasingly more severe and will continue to affect directly and indirectly through sparking of new diseases and pest insect cycles as the result of climate change (Prasad et al., 2000; Ramsey, Tack & Balota, 2020; Paredes et al., 2024; Porcuna-Ferrer et al., 2024). Particularly in Africa and Asia, where irrigation water quantity and quality are limited, the effects of water stress are compounded by the effects of high temperature. In these regions, drought tolerant indigenous crops, including peanut, seem to lose their resilience in the face of climate change (Porcuna-Ferrer et al., 2024).
Droughts and high temperatures reduce not just yield but also peanut seed size and quality, with negative effects on crop revenue (Balota, 2020; Ramsey, Tack & Balota, 2020). For example, Balota (2020) showed that a relatively moderate drought reduced sound mature kernel (SMK) content by 7.5% while severe drought depressed SMK by 25%. The SMK is an important grade factor with significant contribution to the revenue, i.e. the higher the SMK the higher the revenue. Similarly, Ramsey et al. (2020) predicted an approximately 11% revenue decline for Virginia-type peanut producers with 1 C temperature increase due to both yield and seed size reduction. These authors examined the varietal improvement as an adaptation strategy to heat and dryland conditions using data from a unique multi-state project, the Peanut Variety and Quality Evaluation (PVQE), collected on Virginia-type peanut accessions for over 35 years in the Virginia-Carolina peanut region of the USA. They concluded that breeding could offset moderate climate warming, but is unlikely to sustain revenue if warming exceeds 1 C. With limited water resources to supply irrigation to peanut crops in the future, solutions must be found to support production and maintain economic sustainability. Recently, progress has been made toward identification of cultivated and diploid peanut accessions that exhibit phenotypic expression of traits associated with drought tolerance that can be used in breeding for resistance (Balota & Isleib, 2020; Bennett et al., 2022; Kumar et al., 2022; Kumar et al., 2024; Massa et al., 2024). Risk management tools have been, also, deployed along with management practices to reduce the effect of drought (Martins et al., 2023; Nboyine et al., 2023), but more research is needed to achieve sustaining yields and nutritional quality of peanuts under increasingly harsh conditions.
A decrease in gas exchange is one of the first physiological responses to drought in peanut, as evident by decreases in transpiration, stomatal conductance, and photosynthesis (Balota et al., 2024; Mohandass et al., 1989; Reddy et al., 2003; Pilon et al., 2018; Zhang et al., 2022; Soba et al., 2024). Ultimately, decreased growth and leaf area, as well as lower photosynthetic efficiency, leads to a decline in net canopy carbon assimilation, directly impacting yield (Reddy et al., 2003; Soba et al., 2024). Thus, of particular interest is the identification of the limiting factors and susceptibility of photosynthetic mechanisms to drought which reduce yield. These factors include stomatal and non-stomatal photosynthetic mechanisms that respond differently to abiotic stress depending on species and severity of the stress (Rucker et al., 1995; Pilon et al., 2018). Additionally, morphological factors such as root architecture, rooting depth, and plant acclimation capacity can contribute directly to plant water status and photosynthetic/source strength (Dang et al., 2024; Puppala et al., 2023; Rowland et al., 2012a; Rowland et al., 2012b). Pilon et al. (2018) addressed stomatal and non-stomatal limitations to carbon assimilation in peanut and showed that while declines in net CO2 assimilation were driven by decreased stomatal conductance, the primary mechanisms contributing to low photosynthetic rates were non-stomatal (Soba et al., 2024). These non-stomatal limitations included both disruption of electron transport rates through photosystem (PS) II, RuBP regeneration, rubisco carboxylation, and diffusional limitations in the chloroplast (Pilon et al., 2018; Soba et al., 2024). Presumably both the stomatal and non-stomatal mechanisms are affected by and even damaged by low leaf water potential status.
From a plant breeding perspective, research aimed at the discovery and modeling of targeted photosynthetic traits to improve yield and stress tolerance in peanut and other crops; these traits included early biomass accumulation and leaf area index (LAI), ‘chlorophyll stability’, and net assimilation rate (A) (Balota et al., 2024; Bennett et al., 2022; Dang et al., 2024; Zhang et al., 2022; Rucker et al., 1995; Fischer et al., 1998; Kiniry et al., 2005; Nigam and Aruna, 2007; Arunyanark et al., 2008; Balota et al., 2008; Songsri et al., 2008). A comprehensive analysis of traits proposed to improve drought and heat resistance in peanut has been recently published by Puppala et al. (2023). Earlier research showed that LAI and early biomass accumulation had significant effects on peanut yield under stress conditions through improved light interception, radiation use efficiency, higher A, and extended photosynthetic duration (Collino et al., 2001; Kiniry et al., 2005; Arunyanark et al., 2008). This research also emphasized that substantial genetic variation for these traits exists in peanut (Kiniry et al., 2005; Nigam and Aruna, 2007; Arunyanark et al., 2008). In particular, A seemed to be a key trait as its cumulative rate over the growing season is the main driver of biomass and yield. For example, experimental and theoretical analyses suggested that improvement of assimilation in C3 plants is feasible and can be achieved through increasing photosynthetic rate per unit leaf area (Zhang et al., 2022). Using carbon isotope composition and discrimination (Δ13C) chemistry terms, Farquhar and colleagues (1989) developed the theory linking Δ13C to A, transpiration efficiency (TE, the ratio of A to transpiration rate), and water use efficiency (WUE, the ratio of biomass to water used to produce that biomass). Since then, numerous studies used Δ13C to estimate water use of C3 plants, including peanut, but this analysis is expensive and low throughput for regular use in breeding (Nageswara Rao and Wright, 1994; Rowland and Lamb, 2005; Zhang et al., 2022). Limited-transpiration (LT) rate at elevated vapor pressure deficit (VPD) and transpiration decrease (TD) early in the soil drying were also proposed as two physiological mechanisms by which soil water could be conserved and used by plants for a longer time in between rain events (Devi et al., 2010).
A fundamental strategy that plants have evolved for regulating water use is altering hydraulic conductance, ultimately influencing transpiration flux. Alterations in transpiration flux can have significant impacts on crop yield because of its impact on CO2 assimilation for photosynthesis (de Wit, 1958; Passioura, 1996; Blum, 2009). For warm-season C3 plants like peanut, the general pattern of water use for non-stressed plants is a gradual increase in water use during morning hours peaking at mid-day and declining in the afternoon as leaf water potential decreases (Mohandass et al., 1989). Declining leaf water potential has also been closely related to declines in stomatal conductance ultimately reducing water use (Brodribb and Holbrook, 2003).
Relative humidity (RH), dew, and rain vary greatly across the peanut producing regions of the U.S. For example, RH, the ratio of actual vapor pressure to saturation vapor pressure, depends greatly on temperature. In general, the western hot-semi-arid regions of the U.S. have lower vapor pressures than the hot-humid climate of the southeastern and eastern U.S. Vapor pressure deficit (VPD), i.e. the difference between the amount of actual moisture and how much moisture air can hold, is a measure of how close air is to saturation. For a given environment, VPD is easily derived from RH and temperature, and has spatial and temporal variation through the crop growth cycle. When soil water is unlimited, because the sub-stomatal cavity of the leaf is saturated with water vapor, water diffuses through open stomata outside the leaf under high atmospheric VPD (less moisture in the air). This may result in leaf dehydration, faster soil water depletion, and on-set of water deficit stress.
Sinclair et al. (2017) and others (Turner et al., 1985; Devi et al., 2009; Shekoofa et al., 2014, 2015a, b; Pradhan et al., 2019) capitalized on the response of stomatal conductance to diurnal VPD variation and proposed that LT response to increased midday VPD could be a mechanism of dehydration avoidance. Through this mechanism, plants can conserve soil water at early growth stages for use later in the season to sustain seed filling. The predominant physiological mechanism most likely influencing the LT trait is stomatal regulation. Shekoofa et al. (2015a) documented the LT trait threshold occurring across peanut genotypes was not influenced by relative water content. This indicates that bulk leaf water status or active metabolic processes (abscisic acid transport) is not influencing the LT trait (McAdam and Brodribb, 2014; Sinclair et al., 2017). The current evidence is that LT trait could be a result of particular genotypes having relatively lower hydraulic conductivity (passive metabolic process) (Sinclair et al., 2008; Choudhary et al., 2013; Choudhary et al., 2014; Ocheltree et al., 2014). The general concept is that low hydraulic conducting genotypes under higher VPD have insufficient water flux into leaves to match water loss via transpiration, thus reducing stomatal aperture (stomatal limitation) balancing the water flux in and out of the leaf (Sinclair et al., 2017). Therefore, the presence of LT trait may be associated with resistance factors limiting leaf water transport between xylem and guard cells (Sinclair et al., 2008).
When day/night temperature was maintained at 27/21 C in a growth chamber, Devi et al. (2009) reported the LT trait was present in 9 of the 17 peanut genotypes, i.e. 9 genotypes showed a break of linearity between transpiration and VPD when VPD was greater than 2.2 kPa. Other controlled chamber studies evaluating the impact of temperature on the genotypic LT response concluded that increasing temperature could cause a lack of expression of this trait (Shekoofa et al., 2015a). When the chamber temperature was 31 C, three of the 6 genotypes expressed the LT trait, but at a temperature of 36 C the LT trait was diminished in all genotypes. The lack of response of this trait at warmer temperatures was also observed in a field study (Shekoofa et al., 2015a). The impact of temperature on the expression of this trait seems to be more influential on peanut than C4 determinate crops of sorghum and maize (Shekoofa et al., 2013; Shekoofa et al., 2015b). Transpiration decrease (TD) in response to soil drying expressed as the fraction transpirable soil water (FTSW) was also investigated as a peanut strategy to conserve soil water at early stages for later use. Devi et al. (2009) studied 17 peanut genotypes and found large variation in the FTSW among the genotypes, i.e. FTSW ranged from 0.22 to 0.71. However, less variability of this trait has been reported for the U.S. commercial peanut cultivars (Devi et al., 2011; Shekoofa et al., 2013). Stomatal sensitivity to soil drying was observed in a field study when comparing genotypes of subspecies fastigiata and hypogaea (Zurweller et al., 2022).
Crop production loss from water deficit stress primarily occurs because of reduction in photosynthesis from stomatal closure limiting CO2 assimilation (de Witt, 1958; Pilon et al., 2018; Tanner and Sinclair, 1983). Therefore, mechanisms that limit transpiration such as LT and TD must, to some extent, also reduce CO2 assimilation and may result in counterproductive effects on yield. For peanut, LT and TD were documented with certainty under growth chamber conditions, but evidence of the traits’ expression in the field is limited and their direct contribution to soil water conservation and yield advantage under drought is still to be determined.
Diurnal monitoring of air and canopy temperature allows measurement of canopy temperature depression (CTD), a surrogate for stomatal conductance and transpiration of plants in the field. This technique was used with success for decades in plant breeding for drought and heat tolerance (Ehrler et al., 1978; Blum et al., 1982; Reynolds et al., 1994; Amani et al., 1996; Fischer et al., 1998; Balota et al., 2007). For field grown peanut in a sub humid environment, diurnal CTD variation was monitored with wireless infrared thermometers (Balota et al., 2012a, b). As temperature and VPD increased, transpiration rate estimated from CTD increased from 8:00 to 10:00 EST, i.e., VPD went from 0 to 1.5 kPa during this time; CTD decreased at midday, i.e. from 11:00 to14:00 when VPD went from 2 to 2.5 kPa; then CTD increased again in the afternoon until 15:00 when it started to decline, one hour after VPD began to decline (Fig. 9). A negative linear relationship between transpiration rate and VPD from 11:00 to 14:00 EST for field grown peanut was confirmed by directly measuring stomatal conductance on 8 peanut genotypes with a LI-6400 portable photosynthesis meter (LI-COR Biosciences Inc.) (Hawkins, 2014). This agrees with the classical model that stomata closes when the water content in the sub-stomatal cells declines from intensified water diffusion outside the leaf and reopens when the water content is replenished by hydraulic conductivity (Taiz et al., 2014; Brodribb and McAdam, 2011). Unlike results noted in growth chamber tests, when LT and TD to soil drying were expressed in a handful of peanut lines when temperature was 32 C and even in fewer lines when temperature was 36 C (Shekoofa et al., 2015a; Pradhan et al, 2019), in tests in the field by Balota et al. (2012b) on 30 peanut genotypes, all genotypes partially closed stomata in response to midday VPD increase, regardless of temperature and soil moisture content (Fig. 10). However, by this mechanism of LT, yield variation among genotypes from 4992 to 6758 kg ha-1 was not explained (Balota, 2010).
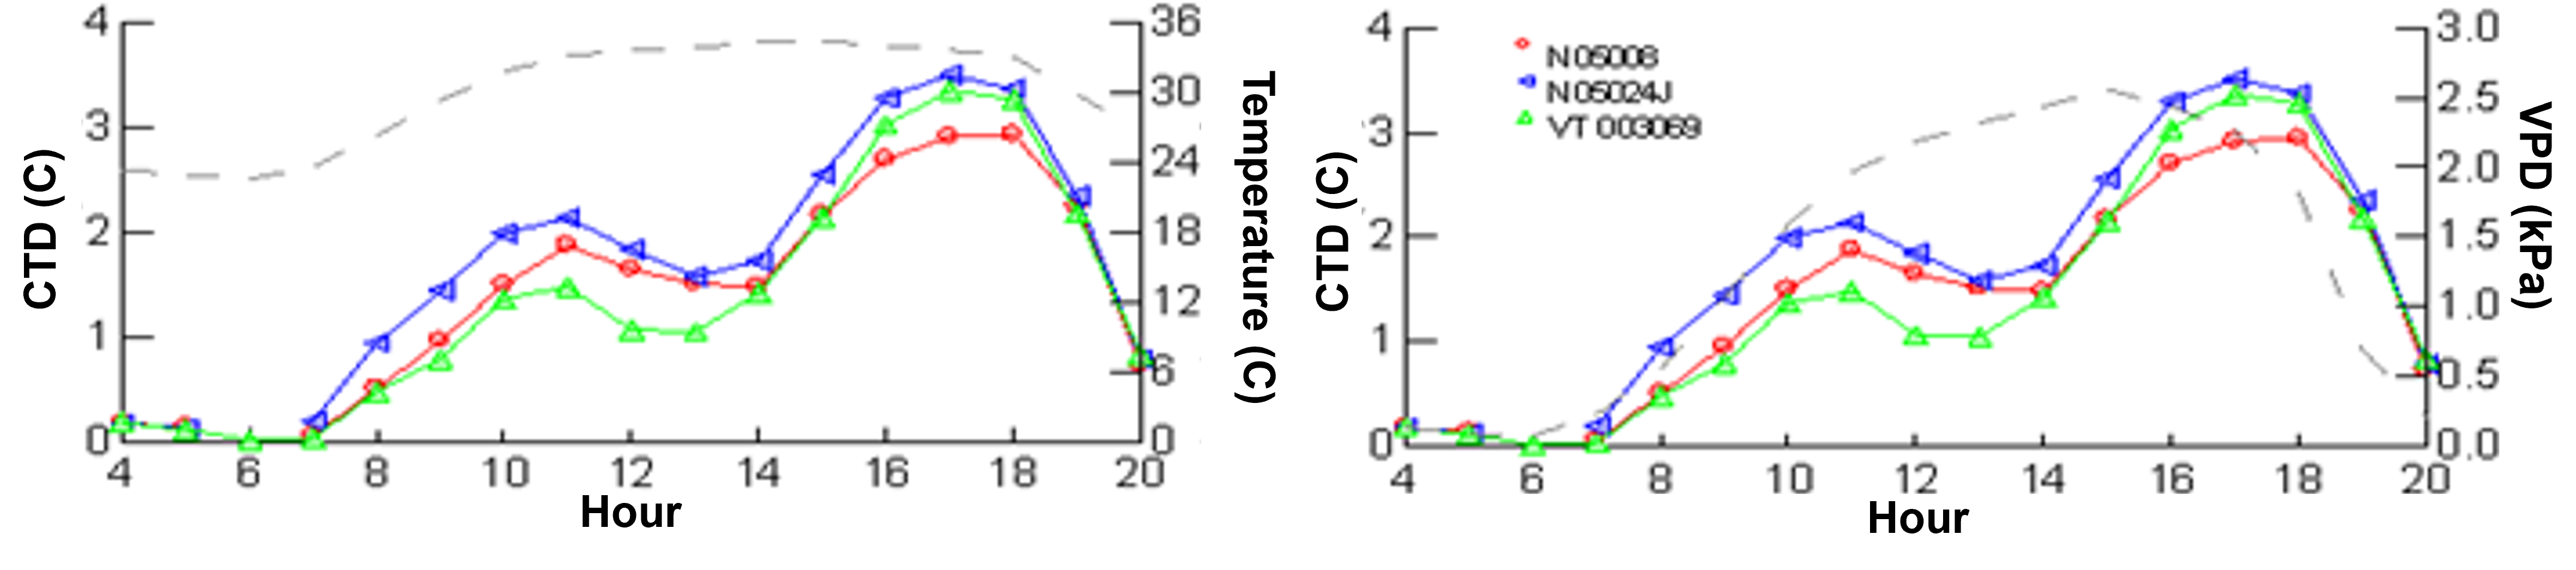
Figure 9. Diurnal variation of canopy temperature depression (CTD) as an estimate of transpiration and stomatal conductance response to increased temperature and vapor pressure deficit (VPD) in a sub-humid environment. CTD was calculated as air minus canopy temperature with high values denoting cool canopy due to increased transpiration. Air temperature and VPD are the dashed lines; the continuous lines with symbols represent CTD of three peanut breeding lines in the Peanut Variety and Quality Evaluation tests in 2009 (Balota et al., 2012a, Balota et al.,2012b). Data over 10 days of continuous temperature monitoring in mid-August are averaged.
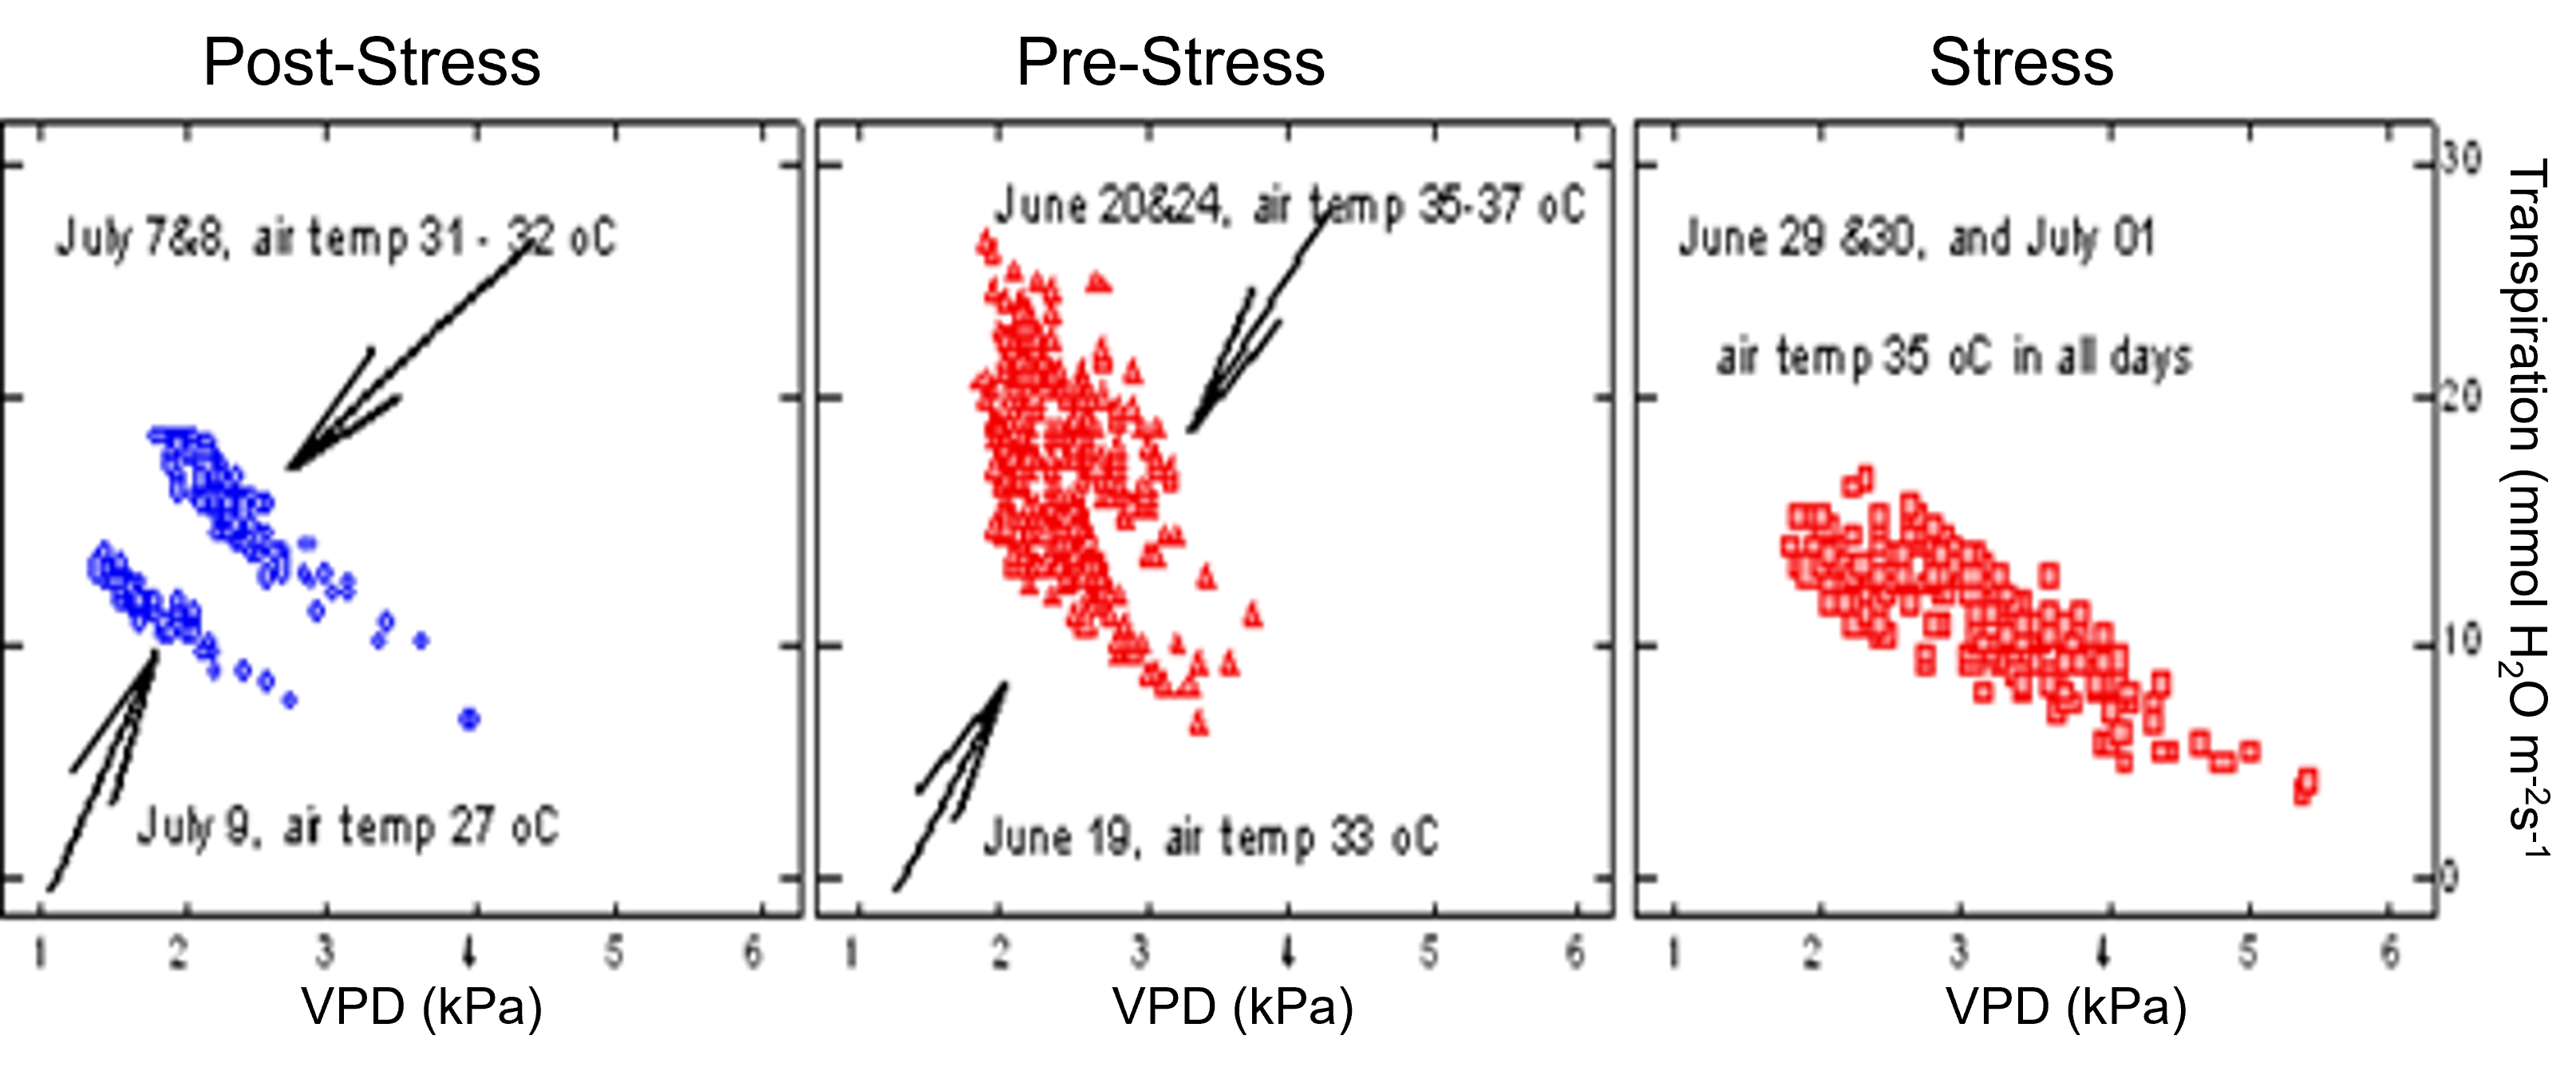
Figure 10. Response of transpiration to midday (11:00 to 14:00) VPD increase on days with different air temperatures and soil moisture content (Balota et al., 2012a, Balota et al., 2012b). Transpiration was measured with a LI-6400 portable photosynthesis meter (LI-COR Biosciences Inc.) 30 peanut genotypes grown in the field at Tidewater AREC, in Suffolk, VA. Each data point is an average of three replicates. Pre-stress represented a period with 10 d of no significant rain event at the beginning peg stage; stress period was after 20 consecutive days of no rain and peanut was at the beginning pod stage; post-stress was after 35.4 mm of combined rainfall and irrigation in 2009.
Similarly, there is little evidence that growth chamber selected peanut genotypes for LT response to increased VPD or TD with soil drying have yield advantage when grown in the field. For example, in growth chamber testing, Sinclair et al. (2018) found line N12006ol with decreased transpiration rate to soil drying in terms of FTSW, i.e. high FTSW, and speculated that TD may have caused higher yield of N12006ol in low-yield environments in the 2014 PVQE testing. Indeed, in 2014 PVQE trials, line N12006ol had an average yield of 5426 kg ha-1 across five locations, like the popular cultivar Bailey, but its sister line, N12008olFCSmT, produced 15% more yield than Bailey and N12006ol when grown under the same environmental conditions (Balota et al., 2015). N12008olFCSmT had significantly lower FTSW than N12006ol (Sinclair et al., 2018) but was released as Bailey II in 2017 for its superior yield.
There is no evidence that LT and TD traits expressed early in the season can conserve water for use at later physiological growth stages of seed development under field conditions. In general, growth chamber studies not only provide conditions different than in the field and expressed phenotypes may be different in controlled conditions than in the field, but they disregard the soil-plant-atmosphere relationships, which are the driving force for crop production. For example, in the VC region, the soil is sandy and shallow, and drought stress can develop within 10 to 20 days of no rainfall. Also, at early growth stages, evaporation is more intense than later in the season when plants cover the ground. Under these conditions, field crops in Suffolk, VA, may become more drought stressed than crops in TX in mid-July (Fig. 11). However, some phenotypes can withstand severe field dehydration. The peanut genotype that remains green and turgid plants in Fig. 11, while the entire field is water-stressed, is GP-NC WS 17 (Tallury et al., 2014). This line is an exotic derived line from interspecific hybridization with Arachis cardenasii (Krapov. & W.C. Gregory) with drought and heat tolerance (Tallury et al., 2014). This genotype was screened for LT in growth chambers by Shekoofa et al. (2015a) and did not show the LT trait. However, GP-NC WS 17 showed the greatest stomatal conductance recovery after water deficit stress, greater chlorophyll fluorescence estimated as the ratio of variable to maximum fluorescence (Fv/Fm), and the least membrane injury, when compared with other genotypes in the field (Rosas-Anderson et al., 2014; Singh et al., 2014). Pilon et al. (2018) also documented that non-stomatal factors such as electron transport are important for maintaining relatively high levels of CO2 assimilation under drought. Similarly, under field conditions when drought was imposed by coverage with rainout shelters, Zhang et al., (2022) showed that some peanut genotypes, i.e. PI 502120 and AU-NPL 17, maintained high photosynthetic and stomatal conductance rates, and produced high yields under drought. The authors called these genotypes “water spenders”, like cultivars of wheat (Triticum aestivum L.) and common bean (Phaseolus vulgaris L.) previously identified with similar responses to drought (Blum et al., 2009; Sanz-Saez et al., 2019). Other cultivars, however, developed an opposite strategy to cope with drought; they closed the stomata early during the onset of drought. These cultivars, i.e. Line-8 and AU16-28, called “water savers” showed lower stomatal conductance but similar yields with “water spenders” (Zhang et al., 2022). The authors concluded that, indeed, water savers did not have a yield advantage over water spenders under field-imposed drought.

Figure 11. Left, a corn field in Suffolk VA, on July 17, 2010, after 20 days of no rainfall. At the right, an entire peanut field (the 2010 Peanut Variety and Quality Evaluation trials) at the same location after 2 months of rainfall absence on Sep 24, 2010. The green plot to the extreme left of the peanut picture is genotype GP-NC WS 17 (Tallury et al., 2014) tested at line SPT 06-07.
Drought tolerance is a complex of morphological and physiological adaptive plant responses including escape, avoidance, and resistance (Blum, 1988). Considering that drought is usually accompanied by high temperatures, the complexity may become overwhelming and unrealistic to address with single traits identifiable through low-throughput techniques in controlled conditions. For agricultural production, adaptive responses must have a yield benefit under drought, while biotic resistance needs not to be forgotten; this makes drought tolerance even more complicated from a breeding perspective. The single trait selection approach has limited physiological applications in plant breeding and constitutes a major point of controversy among breeders and physiologists for decades. Hopefully, the next generation strategy of genomic breeding coupled with advances in phenomics, and machine learning will allow for increasingly more effective inclusion of physiology in breeding and accelerated development of peanut cultivars with improved drought tolerance. Because these strategies have the power to combine a diversity of plant responsive traits, i.e. traits associated with yield, biotic and abiotic tolerance, the mechanisms mostly contributing to increased yield under various “drought” conditions will be more likely to be successfully identified and further used to develop drought tolerant peanut cultivars.
Cold and Heat Effects on Peanut
Temperature influences peanut growth and development throughout the season. For optimal productivity, air temperatures for vegetative growth should be from 30 to 35 C, whereas for reproductive development, the optimal range is from 22 to 30 C (Wood, 1968; Cox, 1979; Williams and Boote, 1995).
Multiple physiological processes are affected by sub- or supra-optimal temperatures. Soil temperatures below 18 C slow the germination rate and result in a high percentage of seedlings with thick hypocotyls and underdeveloped, curled root system (Kvien et al., 2022). Conversely, a rise in soil temperatures above 35 C decreases the overall germination percentage and necrotic areas are likely to develop on hypocotyls and roots of seedlings due to disruption in cell membranes.
The balance between photosynthesis and respiration mediates cell growth and expansion in peanut leaves; thus, photosynthesis and respiration are essential physiological processes associated with tissue growth and development. The air temperature for optimal photosynthesis in peanut plants is around 30 C, but photosynthesis occurs with variable rates over an extended temperature range (10 to 35 C). Cold stress is more likely to occur over the first 30 DAP in spring-sown peanut fields, when temperatures are not consistently warm enough to sustain plant growth. Low temperatures can considerably impair early season growth. The lowest critical average temperature at which growth is interrupted, is near 12 C (Cox and Martin, 1974). At temperatures below 20 C, peanut seedlings produce fewer smaller leaves and shorter stems when compared to seedlings grown at 30 C. Faster development of the first peanut true leaves contributes to overall plant growth at early season (Virk et al., 2019). The reduced growth of leaves and stems caused by low temperatures is primarily associated with decreased photosynthetic rate. The underlying factors causing decreased photosynthetic rate under low temperatures include reduced quantum efficiency of PS II and poor performance of the PS II and PS I intersystem, which reduces the overall energy produced during the light-dependent reactions with further inhibition of photosynthetic performance (Virk et al., 2019). Temperatures below 22 C resulted in delayed flower appearance, decreased number of flowers, and impaired pollination (Zhang et al., 2019a). Shifting planting to a later date can provide higher temperatures at the seedling stage. Moreover, temperatures lower than 10 C or higher than 35 C may promote irreversible damage to the photosynthetic system (Berry and , 1980).
High air temperatures generally accelerate the progress of reproductive growth stages in peanut. Plants initiate and complete flowering earlier and pods mature more rapidly under heat stress (Akbar et al., 2017). In a study with 62 peanut genotypes, plants reached 75% flowering between 35 and 50 days under temperatures ranging from 28 to 30 C. When the genotypes were exposed to temperatures from 33 to 39 C, 75% flowering was achieved in 29 to 37 days (Akbar et al., 2017). Pod maturity also occurred sooner under hot environments. Although early pod set and maturity may benefit planting and harvest logistics, overall yield is considerably decreased by warmer temperatures, partly because of shorter growth cycle and less resource capture (Prasad et al., 2003).
The reproductive stages of peanut are more susceptible to the negative effects of high temperatures than the vegetative stages. Flower fertility is highly sensitive to temperatures above 35 C, resulting in low fruit set (Prasad et al., 2000). Flower bud temperature is typically similar to air temperature up to 30 C. However, at air temperatures above 35 C, the cooling effects are insufficient to prevent the flower buds’ heat injury. Fruit-set may be reduced due to impaired micro- and mega-sporogenesis, and reduced fertilization of flowers present on the plant (Prasad et al., 2003). Reduced flower fertilization under high temperatures occurs due to poor pollen production and viability, and low pollen tube growth (Prasad et al., 2003). Since self-pollination of peanut flowers occurs early morning and the flower opens only after fertilization, the most critical period for heat is the first hours of the day. Optimum temperatures for flower production are between 25 and 30 C, whereas plants tolerate temperatures up to 34 C for pod development. Pollen viability is above 90% at temperatures of approximately 32 C, decreasing to 68% at 40 C with a further decline to 0% at 44 C (Prasad et al., 2003).
High air temperatures also negatively impair the photosynthetic process in peanut leaves. Temperatures above 40 C during flowering and pod development (74 DAP) decreased net photosynthesis and stomatal conductance by 35% on average for seven genotypes (Pilon et al., unpublished). However, nighttime respiration was not impacted by midday high temperatures. The lower photosynthetic rate resulted in less pod dry weight only for two of the seven genotypes, suggesting that five peanut genotypes exhibited greater heat tolerance. These genotypes decreased photosynthesis during heat stress but subsequently increased their photosynthetic rates after the stress period, allocating a greater proportion of photoassimilates to pod development (Pilon et al., unpublished).
Soil temperature is important in regulating pod initiation, pod growth rate, and mature seed mass. Soil temperatures near 20 C in the fruiting zone improved pod initiation rate, resulting in a greater number of pods per plant; but 20 C did not result in optimal pod growth rate, thus seed mass at maturity was low at this temperature (Golombek and Johansen, 1997). Temperatures between 30 and 32 C are suitable for greater pod growth rate and mature seed mass (Golombek and Johansen, 1997). Yet, soil temperature increases to 35 C may reduce peg and pod development by 33% (Ketring, 1984), and seed mass by 45%, resulting in lower overall pod yield (Akbar et al., 2017).
Growth of vegetative tissues (leaves and stems) is generally accelerated by high temperatures up to 35 C (Prasad et al., 2003). In contrast, reproductive units (pegs and pods) require slightly lower temperatures (near 30 C) for optimal growth. Under heat stress, crop growth rate (CGR) is high, suggesting great accumulation of photo-assimilates; however, pod growth rate (PGR) is generally low, thus indicating insufficient partitioning of accumulated photoassimilates (Craufurd et al., 2003), which is caused by poor pod-set (Prasad et al., 2003). The ultimate consequence of low pod-set and poor partitioning of photosynthates from the leaves to pods under heat stress results in significant reduction in pod yield, regardless of vigorous aboveground growth.
The partitioning factor (ratio of PGR to CGR) has been used as a criterion for heat tolerance selection in peanuts (Ntare et al., 2001; Craufurd et al., 2003). Other physiological assessments employed as screening techniques for temperature tolerance included cell membrane thermostability, chlorophyll fluorescence, and flower to fruit-set ratio (Srinivasan et al., 1996; Talwar et al., 1999). Comprehensive knowledge of the physiological mechanisms underlying tolerance to cold and heat would contribute to identifying cultivars adapted to locations with predominant extreme temperatures.
Phenotyping Tools for Yield and Environmental Stresses
Phenotyping Is the Bottleneck for Crop Improvement
Phenotype corresponds to plant characteristics that can be quantitatively measured, and which depend on the interaction between genotype and environment (G × E). Plant physiologists and breeders have collected phenotypic data for decades to understand how plants respond to biotic and abiotic stressors, and how to breed for the most suitable phenotypes under specific environmental conditions. Historically, phenotypes of interest include but are not limited to plant height, biomass, LAI, photosynthesis, root angle, root length density, seed number, and hundred seed weight (Balota et al., 2024; Kolhar and Jagtap, 2023; Sarkar et al., 2020; Sarkar et al., 2021). Currently, phenotypes can be taken using simple and more technologically complex methodologies that, although appropriate and accurate, are limited by the cost and time to collect the data. As breeding programs analyze hundreds of genotypes in multiple spatial and temporal conditions, deployment of high throughput methods is needed.
The development of DNA sequencing technologies has generated the opportunity to analyze plant genomes, providing scientists with tools to understand the genetic regulation of specific phenotypes in quick and affordable ways (Jiao and Schneeberger, 2017; Yang et al., 2017). Development of recombinant inbred lines (RIL), near isogenic lines, and diversity panels of plant populations, makes it possible to map Quantitative Trait Loci (QTL) and thus code quantitative phenotypes needed to improve crop performance under different environments (Adachi et al., 2011; Dhanaphal et al., 2015; Oakley et al., 2018; Kassie et al., 2023). In peanut, QTLs have been identified for plant height, leaf length, yield components, and yield (Khedikar et al., 2018; Lv et al., 2018; Mondal et al., 2019); seed composition traits such as oil content (Hu et al., 2018; Liu et al., 2024); seed dormancy (Wand et al., 2022); mineral nutrient contents (Zhang et al., 2019b); disease tolerance (for a review on this theme see Desmae et al., 2018; Choudhary et al., 2019; Liang et al., 2021); and yield components related with drought tolerance (Faye et al., 2015; Desmae et al., 2018; Kumar et al., 2024). However, to produce strong correlations between phenotypes and their genomic regions, thousands of genotypes have to be phenotyped across environments, growth stages, and years; this is difficult to accomplish with traditional phenotyping methods. Thus, phenotyping has become the bottleneck for genomic discovery and the breeding efforts (Ninomiya, 2022).
In the past 30 years, improvements in digital image acquisition, automation, and robotics have made high-throughput phenotyping (HTP) possible (Furbank and Tester 2011; Fiorani and Schurr, 2013). HTP methods were initially developed for greenhouses and growth chamber applications using plants in early stages of growth; thus, they were unreliable for field screening and not valid for breeding (Araus et al., 2014; Ninomiya, 2022). After 2010, field HTP platforms started to be developed (Araus and Cairns, 2014; Araus et al., 2018a). Field HTP combines remote sensing via satellite and aerial sensing and uses terrestrial and unmanned aerial vehicle (UAV) platforms equipped with a variety of sensors to assess physiological phenotypes related with yield and stress adaptation (Araus and Cairns, 2014; York et al., 2015).
Field HTP: Platforms and Sensors
Remote sensing technologies are becoming increasingly more affordable to the end-users, breeders, and farmers. These technologies collect multiple plant characteristics in a relatively short time, repeatedly and consistently over the season with increased accuracy. Each of these technologies requires two main components. First, they require a vehicle or a platform to bring the sensors on site. Platforms are of different types, and they are complex and costly. The second part is the technology itself in the form of one or multiple sensors for data collection.
Phenotyping platforms
Several types of systems are currently available, with different levels of adaptability and upgradability, mobile or stationery, and with a drastic price range from hundreds to millions of dollars (Fig. 12) (Yuan et al., 2023). Platforms can be immobile, using single or multiple cameras and other sensors mounted on single or multiple poles to take time-lapse images (Brocks et al., 2016; Zhou et al., 2017). Others are stationary field scanner systems on a movable gantry (Virlet et al., 2017; Burnette et al., 2018). The Field Phenotyping Facility at the University of Nebraska Lincoln is one acre in size, and includes sensors and cameras mounted on an automatic cable suspended carrier system (Spidercam) attached to four giant poles in each corner of the field (Kirchgessner et al., 2017; Bai et al., 2019). Significant limitations of the stationary platforms are the high maintenance cost and the limited number of experiments that can be accommodated, e.g. use of any chemicals as treatments may result in negative effects on the subsequent experiments.
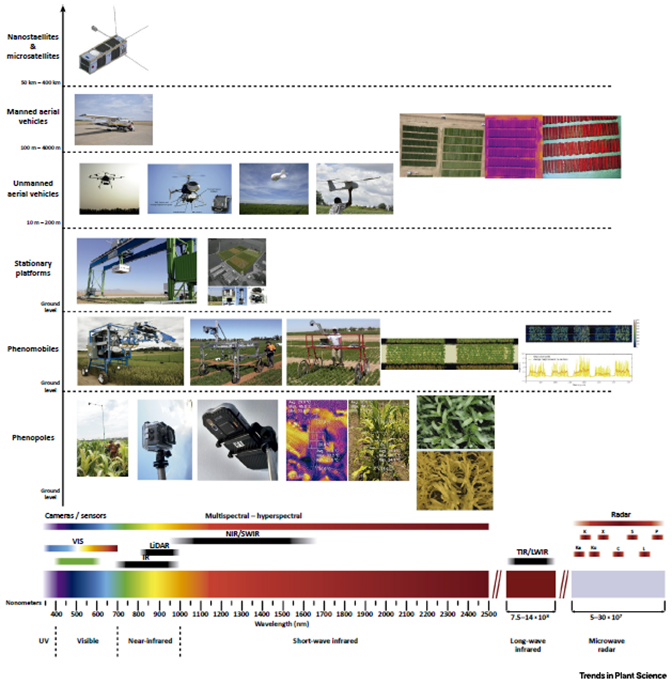
Figure 12. Different categories of potential and actual ground and aerial phenotyping platforms, along with the spectral ranges used for different remote-sensing tools. RGB cameras (VIS), multispectral and hyperspectral sensors and cameras, light detection and ranging (LiDAR) sensors, thermal sensors and cameras (TIR/LWIR), and the different categories of Radars. The ground stationary platforms correspond to the Maricopa Agricultural Center (USA) and the ETH field phenotyping platform (Switzerland). The images of the phenomobile correspond to (from left to right) a proximal remote sensing buggy, the phenomobile lite, and a phenocart. IR, infrared; LWIR, long-wave infrared; NIR, near-infrared; SWIR, short-wave infrared; TIR, thermal infrared; VIS, visible (Adapted from Araus et al., 2018b).
Alternatives to the stationary platforms are mobile, manned or unmanned, platforms. Mobile remote sensing systems include phenomobiles, aircraft, and satellites. The phenomobiles are ground-based vehicles such as unmanned robots or manned diesel-powered tractors and pushcarts (Pittman et al., 2015; Yuan et al., 2018; Antonucci et al., 2023). While phenomobiles allow freedom of use in multiple environments over stationary platforms, they are also limited by the geography of the land through which they can be driven. For example, their use can be limited for tall canopies, wide-spread ground cover crops, and uneven ground. For tractor-based platforms, a significant limitation is the area where they can be safely and time-effectively moved to collect data.
Manned and unmanned aircraft bypass the terrain limitations of the terrestrial platforms. Aerial imaging allows faster and broader coverage of a field than ground-based vehicles. Manned aircraft are well-suited for large landscapes consisting of several hundred to thousands of acres, but their high cost, flight restrictions to certain zones, and the requirement and availability of pilots make their use limited. Drones or unmanned aircraft (UAVs) with either fixed wings or multi-rotors are better options for small farms and research areas. A disadvantage of UAVs, however, is that battery capacity limits the flight mission and payload.
Satellite imagery collected from the Sentinels of the European Space Agency and Landsat from the US is used for phenotyping, mainly for large landscape areas. Satellite imagery is based on vegetation-derived reflectance at multiple wavelengths, from which numerous vegetative indices have been developed for different applications (Reed et al., 1994; Labus et al., 2002; Johnson et al., 2003). The major disadvantage of satellites is their lower spatial resolution in comparison with aircraft. Image resolution is 30 m2 or more for Landsat 8, 3 m2 for Planetscope, and 1 m2 for SkySat, which eliminates small plot comparisons, and intra-plot and plant-level phenotyping. The passage of the satellite above the experiment area as well as the presence of clouds can also limit their use. A general disadvantage of all terrestrial and aerial HTP platforms is that they require expertise at multiple levels to use and maintain them.
Sensors used in field phenotyping
The sensors used in remote sensing are diverse. Laser and ultrasonic sensors are mainly used on ground-based vehicles to estimate plant height. These systems emit a laser or an ultrasonic pulse at a recurrent frequency, which hit the ground or a plant, then reflect back to the sensor. The longest distance measured by the emitted pulse is the bare ground and the smaller is the plant. The subtraction of both distances gives the height of the plant. In this way plant height of maize, bermudagrass, wheat, and alfalfa (Fumiki and Omasa, 2009; Ehlert et al., 2010; Selbeck et al., 2010; Pittman et al., 2015; Cazenave et al., 2019a, b) was successfully estimated.
Light Detection and Ranging (LiDAR) technology has been used for several decades in meteorological applications. More recently, LiDAR is being used to phenotype crops, including peanut, by creating 3D images, either from terrestrial or aerial platforms (Yuan et al., 2019; Sun et al., 2017; Saeed et al., 2023). LiDAR has been used to successfully estimate plant height and, in combination with ground-based platforms, estimate canopy architecture and its components, i.e. stem height, length of lateral branches, and canopy shape and density (Fig. 13).
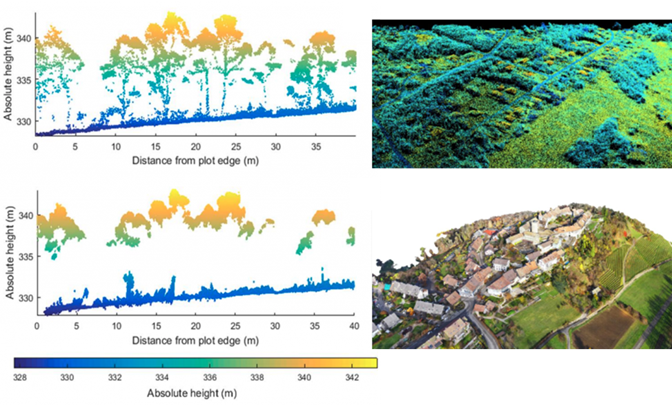
Figure 13. Comparison between 3D reconstruction from LiDAR (top) vs photogrammetry RGB (bottom). The LiDAR can provide more details than RGB by penetrating denser canopy (left, Wallace et al., 2016) while the RGB (bottom right) is allowing some high-resolution visual data in full color as compared to the colorized LiDAR version based on intensity of reflection (top right, USGS, 2018).
Photogrammetry uses high resolution cameras mounted on either terrestrial or aerial platforms to sense reflected light in the visible red, green, and blue (RGB) bands of the electromagnetic spectrum. In peanut, seedling vigor, main stem height, wilting, and yield under drought and late leaf spot disease [caused by the fungus Northopassarola personata (Berk and Curt)] were RGB-estimated with great accuracy (Balota and Oakes, 2016, 2017; Sarkar et al., 2020; Sarkar et al., 2021a; Sarkar et al., 2021b; Kassim et al., 2022; Sie et al., 2022; Oteng-Frimpong et al., 2023; Balota et al., 2024; Chapu et al., 2022; Chapu et al., 2024).
Near infra-red and thermal multispectral sensors are used to assess crop color, temperature as result of transpiration, and biomass accumulation from reflectance in the near infra-red and other spectra. Reflectance-derived vegetation indices such as the Normalized Difference Vegetation Index (NDVI), Normalized Difference Red Edge (NDRE), LAI, and canopy temperature in peanut (Balota and Oakes, 2017; Yuan et al., 2018; Sarkar et al., 2020) and other crops (Freeman et al., 2007; Erdle et al., 2011; Gnyp et al., 2014; Pittman et al., 2015; Cazenave et al., 2019b) have been recently developed.
Phenotyping complex physiological traits
Phenotyping complex physiological processes and hidden plant organs, e.g. roots and peanut pods, is challenging. For these, HTP and remote sensing can only be partially implemented. Therefore, phenotyping mainly relies on low throughput methods (LTP). However, recently Gimode et al. (2023) used Ground Penetrating Radar (GPR) to analyze the below-ground peanut pods non-destructively.
Gas exchange phenotyping
Photosynthesis is a complex process that includes different complex reactions that, for simplification, can be divided into light reactions driven by electrons passing the different photosystems, and CO2 fixation. Measurement of CO2 fixation parameters uses infrared gas analyzers (IRGA). Depending on the type of photosynthetic parameter, measurements can take between one min, i.e. midday CO2 fixation (A), to 90 min, i.e. the maximum rate of Rubisco carboxylation (Vcmax) and electron transport (Jmax), and A response to internal CO2 (Ci) (A-Ci) curves (Farquhar et al., 1980; Bernacchi et al., 2003). Nonetheless, IRGA measurements only give periodic information that may not be representative of the whole plant performance over the growing season. Farquhar et al. (1989) used carbon isotope discrimination (Δ13C), as it offers information on photosynthesis and WUE in a more integrated way over the life span of the plant.
WUE phenotyping through carbon isotope discrimination
In peanut, WUE has been demonstrated to be an important trait to select to improve drought stress tolerance (Vadez and Ratnakumar, 2016; Zhang et al., 2022). Water use efficiency can be calculated as the amount of biomass fixed per amount of water used by the plant. The most accurate way to calculate the amount of water used by a plant is gravimetrically, i.e. weighing potted plants every day, re-watering to pre-calculated weights to achieve desired water levels and calculating the amount water lost through transpiration (Vadez and Ratnakumar, 2016; Zhang et al., 2022). However, this method is time consuming, and few facilities can afford to perform such big scale, controlled experiments. Farquhar et al. (1989) reported a strong relationship between WUE calculated gravimetrically and Δ13C. This relationship has been demonstrated in several crop species such as common bean (Ehleringer et al., 1991), soybean (Dhanapal et al., 2015), wheat (Del Pozo et al., 2016), and peanut (Wright et al., 1993), allowing Δ13C to be used as surrogate phenotyping for WUE. In peanut, Δ13C is highly inheritable (Hubick et al., 1988), therefore allowing identification of the genomic regions responsible for changes in Δ13C and then WUE. However, the Δ13C method is expensive, i.e. mass spectroscopy analysis costs around $8 per sample.; Due to the cost and complexity of the peanut genome, Δ13C method has not yet been connected successfully to QTLs in peanut breeding; it is more successfully used in soybean and wheat (Dhanapal et al., 2015; Del Pozo et al., 2016). In soybean and wheat, GWAS and QTL mapping have been performed and genomic regions codifying Δ13C are now available (Dhanapal et al., 2015; Mora et al., 2015). Despite its success, Δ13C is far from being considered an HTP technique because of the time required for biomass sampling and preparation, and the subsequent spectroscopy analysis. Near infrared (NIR) technology is based on the unique reflectance patterns that different leaf and seed chemical compounds produce when they are exposed to light with a known light spectrum. Ferrio et al. (2001) used NIR technology to accurately predict Δ13C, and thus WUE. These authors predicted Δ13C from NIR reflectance with an accuracy ranging from 82 to 86%.
Hyperspectral reflectance to predict photosynthetic parameters.
Hyperspectral sensors capture electromagnetic radiation reflected from vegetation in the visible (VIS, 400–700 nm), near-infrared (NIR, 700–1,300 nm), and short-wavelength infrared (SWIR, 1,400–3,000 nm) regions of the electromagnetic spectrum, which contain information about leaf physiological status including pigments, structural constituents of biomass, and water content (Curran, 1989; Penuelas and Filella, 1998). Variation of foliar reflectance at different wavelengths is specific to the variations in chemical and structural characteristics of the leaf and photosynthetic apparatus (Fig. 14a, b, c) (Serbin et al., 2012). Hyperspectral reflectance spectroscopy as an HTP tool is becoming recognized as promising in agricultural research (Serbin et al., 2012; Weber et al., 2012; Araus and Cairns, 2014; Silva-Perez et al., 2017; Yendrek et al., 2017). Hyperspectral hand-held sensors such as the Field Spec Hi-Res-4, have been used to predict photosynthetic parameters including maximum rate of rubisco carboxylation Vcmax (Fig. 14) and midday CO2 assimilation of peanut plants (Buchaillot et al., 2022). However, this technology is low throughput as individual plants need to be measured one by one. To reach high throughput phenotyping, researchers are currently using hyperspectral cameras mounted on drones to predict these parameters with similarly accurate results predicted with the hand-held equipment (Bagherian et al., 2023). The combination of drone and hyperspectral technologies will allow breeding programs to phenotype plant photosynthetic parameters in a high throughput manner in the future.
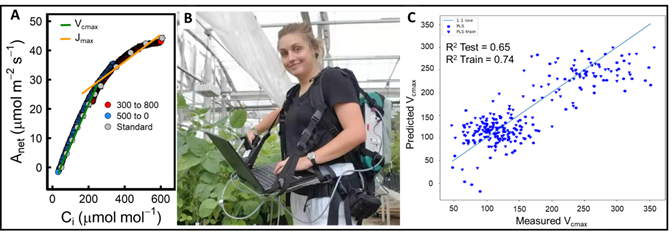
Figure 14. (A) Example of standard A-Ci curve (grey dots), Rapid A-Ci curve (blue and red dots), and data used to calculate Vcmax and Jmax. Figure modified with permission from Stinziano et al. (2019). (B) Example of the FieldSpec HiRes4 (ASD technology) used to take hyperspectral data from the leaves. (C) Correlation test used to demonstrate the accuracy of the Partial-Least (PLSR) model and hyperspectral data to predict Vcmax for peanut and soybean (Buchaillot et al., 2022).
Phenotyping roots - the hidden resource.
Roots provide water and nutrient uptake. Different root traits enable plants to respond, adapt and tolerate different environmental stresses. For example, peanut cultivars with drought tolerance showed greater root length at deeper depths than drought-sensitive cultivars (Thangthong et al., 2017). As the root system is underground, historically, it has been difficult to phenotype (York et al., 2015; Atkinson et al., 2019). However, recently, technological improvements in image acquisition and data analysis have allowed great advancements in root and pod phenotyping, as mentioned earlier in this section (Gimode et al., 2023). Regardless of various obstacles, e.g. soil type, heterogeneity and moisture, GPR technology can accurately detect below-ground plant parts significantly contributing to the understanding of plant response mechanisms to tolerate stress (Dobreva et al., 2021; Gimode et al., 2023).
Other non-destructive field measurements rely on rhizotrons and rhizo-boxes systems with different automation capabilities and, more recently, on X-ray computed tomography and GPR (Garbout et al., 2012; Nagel et al., 2012; Rogers et al., 2016; Thangthong et al., 2016; Liu et al., 2018). For example, for peanut, Thangthong et al. (2016) developed a rhizotron that can be placed in the field to monitor root development in quadrants of 10 cm2 (Fig. 15a), from the beginning of the season until harvest. Although this type of system is advanced and more representative of “normal” root development in the field, soil particles can interrupt the visibility of the roots causing missed data (Atkinson et al., 2019). Soil and soilless systems (Fig. 15b, c) used in greenhouse applications are less informative as root phenotypes can be drastically different from the phenotypes in the field (Kuijken et al., 2015).
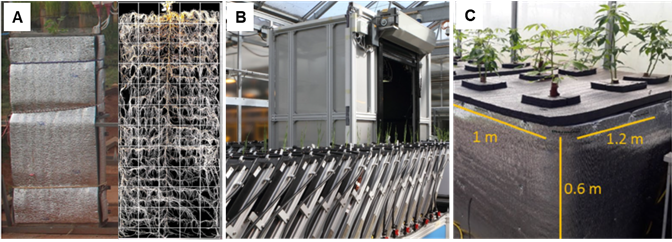
Figure 15. Examples of different root phenotyping platforms used in field and under controlled conditions. (A) Rhizotron used in field experiments to image root profile using RGB camera (Thangthong et al., 2016). (B) Greenhouse based automated root phenotyping GROWSCREEN-Rhizo System (Nagel et al., 2012). (C) Aeroponic system used to study cassava root development in the greenhouse (Gomez-Selvaraj et al., 2019).
In summary, research achievements in peanut physiology have been numerous in recent years. These achievements are predominant in the areas of crop requirements for sustainable production, plant growth and development, mechanisms of adaptation to biotic and abiotic factors, and, more recently, the development of high-throughput tools for phenotyping. Along with the achievements in genome sequencing and genetic mapping technologies, plant physiology discoveries and advancements in HTP technologies pave the way for the implementation of new strategies in peanut breeding, i.e. molecular breeding and genomic selection. These strategies appear more robust than traditional breeding for predicting valuable traits for increased yield and adaptation to environmental conditions; and allow pyramiding these traits more effectively in future peanut cultivars to meet production requirements for the specific geographical regions in which cultivars will be grown.
Literature Cited
Aboyeji C., Dunsin O., Adekiya A.O., Chinedum C., Suleiman K.O., Okunlola F.O., Aremu C.O., Owolabi I.O., and Olofuntoye T.A.J.. 2019. Zinc sulphate and boron-based foliar fertilizer effect on growth, yield, minerals, and heavy metal composition of groundnut (Arachis hypogaea L.) grown on an alfisol. Int. J. Agron. [: doi: 10.1155/2019/5347870].
Adachi S., Tsuru Y., Nito N., Murata K., Yamamoto T., and Ebitani T.. 2011. Identification and characterization of genomic regions on chromosomes 4 and 8 that control the rate of photosynthesis in rice leaves. J. Exp. Bot. 62:1927–1938. [: doi:10.1093/jxb/erq387].
Adams F., and Hartzog D.. 1979. Effects of lime slurry on soil pH, exchangeable calcium, and peanut yields. Peanut Sci. 6:73-76. doi: [: 10.3146/i0095-3679-6-2-2].
Adams J. F., Hajek B.F., Davies D.P., and Hartzog D.L.. 1993. Relationship between peanut yield and soil classification of Ultisols in southeastern Alabama. Agric. Ecosystems and Environ. 43:79-86. [: doi: 10.1016/0167-8809(93)90007-C].
Ahuja I., Kissen R., and Bones A.M.. 2012. Phytoalexins in defense against pathogens. Trends in Plant Sci. 17 (2):73-90. doi: [: 10.1016/j.tplants.2011.11.002].
Akbar A., Manohar S.S., Variath M.T., Kurapati S., and Pasupulet J.. 2017. Efficient partitioning of assimilates in stress-tolerant groundnut genotypes under high-temperature stress. Agronomy. 7:30.
Alpert P. 2005. The limits and frontiers of desiccation-tolerant life. Integr. Comp. Biol. 45:686-695. doi: [: 10.1093/icb/45.5.685].
Amani I., Fischer R.A., and Reynolds M.P.. 1996. Canopy temperature depression association with yield of irrigated spring wheat cultivars in hot climate. J. Agron. Crop Sci. 176:119-129.
Antonucci F., Costa C., Figorilli S., Ortenzi L., Manganiello R., Santangelo E., Gierz L., and Pallottino F.. 2023. A low-cost sensorized vehicle for in-field crop phenotyping. Applied Sciences. 13(4):2436.
Araus J.L., and Cairns J.E.. 2014. Field high-throughput phenotyping, the new frontier in crop breeding. Trends Plant Sci. 19:52–61. doi: [: 10.1016/j.tplants.2013.09.008].
Araus J.L., Kefauver S.C., Zaman-Allah M., Olsen M.S., and Cairns J.E.. 2018a. Field high-throughput phenotyping: the new crop breeding frontier. Trends Plant Sci. 23:5. doi: [: 10.1007/978-1-4939-2493-6_1036-1].
Araus J.L., Kefauver S.C., Zaman-Allah M., Olsen M.S., and Cairns J.E.. 2018b. Translating high-throughput phenotyping into genetic gain. Trends Plant Sci. 23:451-66.
Arunyanark A., Jogloy S., Akkasaeng C., Vorasoot N., Kesmala T., Nageswara R. Rao G.C. , and Patanothai A.. 2008. Chlorophyll stability is an indicator of drought tolerance in peanut. J. Agron. Crop Sci. 194:113-125. doi: [: 10.1111/j.1439-037X.2008.00299.x].
Atkinson J.A., Pound M.P., Bennett M.J., and Wells D.M.. 2019. Uncovering the hidden half of plants using new advances in root phenotyping. Curr. Op. Biotech. 55:1-8. doi: [: 10.1016/j.copbio.2018.06.002].
Bagherian K., Bidese-Puhl R., Bao Y., Zhang Q., Sanz-Saez A., Chen C., and Dang P.. 2023. Phenotyping agronomic and physiological traits in peanut using UAV-based hyperspectral imaging and machine learning. The Plant Phenome Journal. doi: [: 10.1002/ppj2.20081].
Bagley B.W., Cherry J.H., Rollins M.L., and Altschul A.M.. 1963. A study of protein bodies during germination of peanut (Arachis hypogaea) seed. Amer. J. Bot. 50:523-532. doi: [: 10.1016/0098-8472(90)90002-L].
Bai G., Ge Y., Scoby D., Leavitt B., Stoerger V., Kirchgessner N., Irmak S., Graef G., Schnable J., and Awada T.. 2019. NU-Spidercam: A large-scale, cable-driven, integrated sensing and robotic system for advanced phenotyping, remote sensing, and agronomic research. Computers and Electronics in Agriculture. 160:71-81.
Balmer A., Pastor V., Gamir J., Flors V., and Mauch-Mani B.. 2015. The ‘prime-ome’: towards a holistic approach to priming. Trends Plant Sci. 20:443-452.
Balota M., Sarkar S., Bennett R.S., and Burow M.D.. 2024. Phenotyping peanut drought stress with aerial remote-sensing and crop index data. Agriculture 2024. 14:565. doi: [: 10.3390/agriculture14040565].
Balota M. 2020. Rainout shelter-induced water deficit negatively impacts peanut yield and quality in a sub-humid environment. Peanut Sci. 47(2):54-65. doi: [: 10.3146/PS20-5.1].
Balota M., and Isleib T.G.. 2020. Registration of ‘GP-VT NC 01’ peanut germplasm. J. Plant Registrations. 14(2): 172-178. doi: [: 10.1002/plr2.20028].
Balota M. 2010. Peanut Variety and Quality Evaluation results I: 2009 agronomic and grade data. Virginia Tech and Virginia Coop. Ext. Publ. 3001-1432. 75 pp. https://www.pubs.ext.vt.edu/3001/3001-1432/3001-1432.html.
Balota M. 2011. Peanut Variety and Quality Evaluation results I: 2010 agronomic and grade data. Virginia Tech and Virginia Coop. Ext. Publ. 3101-1523. 81 pp. http://pubs.ext.vt.edu/3101/3101-1523/3101-1523.html.
Balota M., and Oakes J.. 2016. Exploratory use of a UAV platform for variety selection in peanut. Proc. SPIE 9866, Autonomous Air and Ground Sensing Systems for Agricultural Optimization and Phenotyping, 98660F. doi: [: 10.1117/12.2228872].
Balota M., and Oakes J.. 2017. UAV remote sensing for phenotyping drought tolerance in peanuts. Proc. SPIE 10218, Autonomous Air and Ground Sensing Systems for Agricultural Optimization and Phenotyping II, 102180C. doi: [: 10.1117/12.2262496].
Balota M., and Phipps P.. 2013. Comparison of virginia and runner-type peanut cultivars for development, disease, yield potential, and grade factors in eastern Virginia. Peanut Sci. 40:15-23. doi: [: 10.3146/PS12-4.1].
Balota M., Isleib T.G., and Tallury S.. 2012a. Variability for drought related traits of virginia-type peanut cultivars and advanced breeding lines. Crop Sci. 52:2702-2713. doi: [: 10.2135/cropsci2012.03.0207].
Balota M., Isleib T.G., Tallury S.P., and Chapin J.. 2015. 2014 Peanut Variety and Quality Evaluation results. I. Agronomic and grade data. Info. Ser. 507. Virginia Polytech. Inst. State Univ., Virginia Agric. Exp. Stn., Tidewater Agric. Res. Ext. Ctr., Suffolk, VA.
Balota M., McGrath S., Isleib T.G., and Tallury S.. 2012b. Transpiration response to vapor pressure deficit in field grown peanut. Peanut Sci. 39:53-61. doi: [: 10.3146/PS11-13.1].
Balota M., Payne W. A., Evett S.R., and Lazar M.. 2007. Canopy temperature depression sampling to assess grain yield and genotypic differentiation in winter wheat. Crop Sci. 47:1518-1529.
Balota M., Payne W.A., Rooney W., and Rosenow D.. 2008. Gas exchange and transpiration ratio in sorghum. Crop Sci. 48:2361-2371. doi: [: 10.2135/cropsci2008.01.0051].
Barton C.V.M., and Montagu K.D.. 2004. Detection of tree roots and determination of root diameters by ground penetrating radar under optimal conditions. Tree Physiol. 24:1323-1331. doi: [: 10.1093/treephs/24.12.1323].
Beasley J.P. Jr., Hodges S.C., and Thompson S.S.. 1989. The role of calcium in peanuts. Ext. Cir. 800. Univ. Georgia, Athens, GA, USA.
Bell D.K. 1984. Performance of a testa and intact peanut seed in field plots, field microplots, germination and pathogenicity tests. Peanut Sci. 11:74-77. doi: [: 10.3146/i0095-3679-11-2-7].
Bell M.J. and Wright G.C.. 1998. Groundnut growth and development in contrasting environments 2. Heat unit accumulation and photo-thermal effects on harvest index. Exp. Agric. 34:113-124.
Bell M., Wright G., and Harch G.. 1993. Environmental and agronomic effects on the growth of four peanut cultivars in a sub-tropical environment. II. Dry matter partitioning. Exp. Agric. 29: 491-501.
Benítez V., Cantera S., Aguilera Y., Moliá Esteban R. M., Díaz M.F., and Martín-Cabrejas M.A.. 2013. Impact of germination on starch, dietary fiber and physicochemical properties. I. Non-conventional legumes. Food Res. Int. 50:64-69. doi: [: 10.1016/j.foodres.2012.09.044].
Bennett R., Burow M., Balota M., Chagoya J., Sarkar S., Sung C., Payton M., Wang N., Payton P., Chamberlin K., and Mornhinweg D., 2022. Response to drought stress in a subset of the U.S. peanut mini-core evaluated in Oklahoma, Texas, and Virginia. Peanut Sci. 49(1):71-87. doi: [: 10.3146/0095-3679-491-PS21-14].
Benton A.N. 2016. Effectiveness of current boron application recommendations and practices on peanut (Arachis hypogaea L.) in Virginia-Carolina region. Virginia Polytechnic Institute and State University. M.S. Thesis. 61 pp.
Bernacchi C.J., Pimentel C., and Long S.P.. 2003. In vivo temperature response functions of parameters required to model RuBP-limited photosynthesis. Plant Cell Environ. 26:1419–1430. doi: [: 10.1046/j.0016-8025.2003.01050.x].
Berry J., and Björkman O.. 1980. Photosynthetic response and adaptation to temperature in higher plants. Annual Review of Plant Biology. 31:491-543.
Bindlish E., Abbott A., and Balota M.. 2017. Assessment of peanut pod maturity. Proceedings: IEEE Winter Conference on Applications of Computer Vision (WACV). Santa Rosa, CA, pp. 688-696. doi: [: 10.1109/WACV.2017.82].
Bindu Mathava H., Sheshshayee M.S., Shankar A.G., Prasad T.G., and Udayakumar M.. 2003. Use of SPAD chlorophyll meter to assess efficiency of peanut. In Cruickshank A.W., Rachaputi N.C., Wright C.G., and Nigam S.N. (eds): Conf. Proc. Breeding for Drought-Resistant Peanuts. Publ. Austral. Centre for International Research, Canberra, Australia, 2003.
Blad B., Steadman J., and Weiss A.. 1978. Canopy structure and irrigation influence white mold disease and microclimate of dry edible beans. Phytopathology. 68:1431-1437.
Blum A. 1988. Plant Breeding for Stress Environments. CRC PressBoca Raton, Fl.
Blum A. 2009. Effective use of water (EUW) and not water-use efficiency (WUE) is the target of crop yield improvement under drought stress. Field Crops Res. 112:119-123.
Blum A., Mayer J., and Gozlan G.. 1982. Infrared thermal sensing of plant canopies as a screening technique for dehydration avoidance in wheat. Field Crops Res. 5:137-147.
Boote K. 1982. Growth stages of peanut (Arachis hypogaea L.). Peanut Sci. 9:35-40. doi: [: 10.3146/i0095-3679-9-1-11].
Boote K.J., Jones J.W., Hoogenboom G., Wilkerson G.G., and Jagtap S.S.. 1989. PNUTGRO V1.02. Peanut crop growth simulation model User’s Guide, Florida Agricultural Exp. StationGainesville, Florida, USA.
Borém A., Ramalho M.A.P., and Fritsche-Neto R.. 2012. Abiotic stresses: challenges for plant breeding in the coming decades. pp. 1-12, In: Fritsche-Neto R. and Borem A. (Eds), Plant Breeding for Abiotic Stress Tolerance, Springer, New York.
Branch W.D. 1996. Registration of ‘Georgia Green’ peanut. Crop Sci. 36(3):806.
Brevedan R., Busso C., Fioretti M., Toribio M., Baioni S., Torres Y., Fernández H., Giorgetti D., Bentivegna J., Entío J., Ithurrart L., Montenegro O., Mujica M., Rodríguez G., and Tucat G.. 2013. Water stress and temperature effects on germination and early seedling growth of Digitaria eriantha. Chapter 12. pp. 211-224 In Busso C.A. (ed). From Seed Germination to Young Plants: Ecology, Growth and Environmental Influences. New York, Nova Biomedical.
Brocks S., Bendig J., and Bareth G.. 2016. Toward an automated low-cost three-dimensional crop surface monitoring system using oblique stereo imagery from consumer-grade smart cameras. J. Applied Remote Sensing. 10(4): 046021. doi: [: 10.1117/1.Jrs.10.046021].
Brodribb T.J., and Holbrook N.M.. 2003. Changes in leaf hydraulic conductance during leaf shedding in seasonally dry tropical forest. New Phytol. 158:295–303.
Brodribb T.J., and McAdam S.A.M.. 2011. Passive origins of stomatal control in vascular plants. Science. 331:582–585.
Bruce T.J.A., Mathes M.C., Napier J.A., and Pickett J.A.. 2007. Stressful “memories” of plants: evidence and possible mechanisms. Plant Sci. 173:603-608.
Buchaillot M.L., Soba D., Shu T., Liu J., Aranjuelo I., Araus J.L., Runion B., Prior S.A., Keufaver S.C., and Sanz-Saez A.. 2022. Estimating peanut and soybean photosynthetic traits using leaf spectral reflectance and advance regression models. Planta. 255:93. doi: [: 10.1007/s00425-022-03867-6].
Buitink J. 2007. Desiccation tolerance in the –omics era: New tools for an old enigma? Chapter 1. pp.1-17. In Adkins S., Ashmore S., and Navie S.C., eds. Seeds: Biology, Development and Ecology. London, CAB International.
Burnette M., Sagan V., Andrade-Sanchez P., Shakoor N., Sidike P., Ward R., LeBauer D., Kooper R., Maloney J.D., Rohde G.S., Terstriep J.A., Willis C., Fahlgren N., Mockler T., and Newcomb M.. 2018. TERRA-REF Data Processing Infrastructure. Proceedings of the Practice and Experience on Advanced Research Computing - PEARC '18: 1-7. doi: [: 10.1145/3219104.3219152].
Burrow M.D., Baring M.R., Ayers J.L., Schubert A.M., Lopez Y., and Simpson C.E.. 2014a. Registration of ‘Tamrun OL12’ peanut. J. Plant. Reg. 8:117-121. doi: [: 10.3198/jpr2013.07.0036crc].
Burrow M.D., Baring M.R., Puppala N., Simpson C.E., Ayers J.L., Cason J., Schubert A.M., Muitia A., and Lopez Y.. 2014b. Registration of ‘Schubert’ peanut. J. Plant. Reg. 8:122-126. doi: [: 10.3198/jpr2013.07.0042crc].
Butts C.L., Lamb M.C., Zimmer K., Santos R., Hoisington D., Adams J., Cowart D., Tillman B., Kemerait R.C., Marshall J., Jackson M., Davis J., Sterlin S., Elder J.. 2023. U.S. peanut quality: industry priorities to mitigate aflatoxin risk from farm to consumer. Peanut Sci. 50(1): 29-40.
Butts C.L., Lamb M.C., Sorensen R.B., Powell S., Cowart D., Horm K., Anthony B., and Bennett J.. 2017. Alternative storage environments for shelled peanuts. Peanut Sci. 44(2):111-123. doi: [: 10.3146/0095-3679-501-PS22-15].
Butzler T.M., Bailey J., and Beute M.K.. 1998. Integrated management of Sclerotinia blight in peanut: utilizing canopy morphology, mechanical pruning, and fungicide timing. Plant Dis. 82:1312-1318.
Caliskan S., Caliskan M.E., Erturk E., Arslan M., and Arioglu H.. 2008. Growth and development of Virginia-type groundnut cultivars under Mediterranean conditions. Acta Agriculturae Scandinavica. 58:105-113. doi: [: 10.1080/09064701312041].
Carley D.S., Jordan D.L., Dharmasri L.C., Sutton T.B., Brandenburg R.L., and Burton M. G.. 2008. Peanut response to planting date and potential of canopy reflectance as an indicator of pod maturity. Agron. J. 100(2):376-380.
Caroca R., Zapata N., and Vargas M.. 2016. Temperature effect on the germination of four peanut genotypes (Arachis hypogaea L.). Chil. J. Agric. Anim. Sci. 32(2). doi: [: 10.4067/S0719-38902016000200002].
Castelfranco P., Lott J., and Sabar N., 1969. Respiratory changes during seed germination. Histological distribution of respiratory enzymes and mobilization of fat reserves in castor bean endosperm and peanut cotyledons. Plant Physiol. 44:789-795. doi: [: 10.1104/pp.44.6.789].
Cattivelli L., Rizza F., Badeck F.W., Mazzucotelli E., Mastrangelo A.M., Francia E., Mare C., Tondelli A., and Stanca A.M.. 2008. Drought tolerance improvement in crop plants: an integrated view from breeding to genomics. Field Crops Res. 105:1-14.
Cevallos-Casals B. A., and Cisnerose-Zevallos L.. 2010. Impact of germination on phenolic content and antioxidant activity of 13 edible seed species. Food Chem. 119:1485-1490. doi: [: 10.1016/j.foodchem.2009.09.030].
Chakraborty K., Bishi S. K., Goswami N., Singh A. L., Bhaduri D., and Zala P. V.. 2019. Salinity-induced changes in seed germination and the expression profile of antioxidant enzymes in peanut as early and late responses in emerging radicles. Acta Phys. Plant. 41(134):1-16. doi: [: 10.1007/s11738-019-2927-5].
Chappell G., Shew B., Ferguson J., and Beute M.. 1995. Mechanisms of resistance to Sclerotinia minor in selected peanut genotypes. Crop Sci. 35:692-696.
Chapu I., Chandel A., Sie E.K., Okello D.K., Oteng-Frimpong R., Okello R.C.O., Hoisington D.,and Balota M.. 2024. Comparing regression and classification models to estimate leaf spot disease in peanut (Arachis hypogaea L.) for implementation in breeding selection. Agronomy 2024, 14:947. doi: [: 10.3390/agronomy14050947].
Chapu I., Okello D.K., Okello R.C.O., Odong T.L., Sarkar S., and Balota M.. 2022. Exploration of alternative approaches to phenotyping of late leaf spot and groundnut rosette virus disease for groundnut breeding. Front. Plant Sci. 13: 912332, doi: [: 10.3389/fpls.2022.912332].
Chen C.Y., Nuti R.C., Rowland D.L., Faircloth W.H., Lamb M.C., and Harvey E.. 2013. Heritability and genetic relationships for drought-related traits in peanut. Crop Sci. 53:1392-1402.
Cherry J.H. 1963. Nucleic acid, mitochondria, and enzyme changes in cotyledons of peanut seeds during germination. Plant Phys. 38:440-446. doi: [: 10.1104%2Fpp.38.4.440].
Choudhary D., Agarwal G., Wang H., Pandey M.K., Culbreath A.K., Varshney R.K., and Guo B.. 2019. Molecular markers and genomic resources for disease resistance in peanut-A review. Legume Res. 42(2):137-144. doi: [: 10.18805/LR-409].
Choudhary S., Sinclair T.R., Messina C.D., and Cooper M.. 2014. Hydraulic conductance of maize hybrids differing in transpiration response to vapor pressure deficit. Crop Sci. 54:1147-1152.
Choudhary S., Sinclair T.R., and Prasad P.V.. 2013. Hydraulic conductance of intact plants of two contrasting sorghum lines, SC15 and SC1205. Funct. Plant. Biol. 40:730–738.
Coffelt T.A. 1974. Inheritance of growth habit in an intraspecific-cross population of peanut. J. Heredity. 65:160-162.
Coffelt T. and Porter D.. 1982. Screening peanuts for resistance to Sclerotinia blight. Plant Dis. 66:385-387.
Coffelt T.A., Seaton M.L., and Van Scoyoc W.. 1989. Reproductive efficiency of 14 Virginia type peanut cultivars. Crop Sci. 29:1217-1220.
Coffelt T.A., Wright F.S., and Steele J.L.. 1979. New harvesting and curing technology in the production of breeder’s seed peanuts. Peanut Sci. 6:70-72. doi: [: 10.3146/i0095-3679-6-2-1].
Collino D., Dardanelli J., Sereno R., and Racca R.. 2001. Physiological responses of Argentine peanut varieties to water stress: Light interception, radiation use efficiency and partitioning of assimilates. Field Crops Res. 70:177-184.
Colvin B.C., Rowland D.L., Ferrell J.A., and Faircloth W.H.. 2014. Development of a digital analysis system to evaluate peanut maturity. Peanut Sci. 41:8-16. doi: [: 10.3146/PS13-9.1].
Cox F.R. 1979. Effect of temperature treatment on vegetative and fruit growth. Peanut Sci. 6:14-17. doi: [: 10.3146/i0095-3679-6-1-4].
Cox F.R., and Martin C.K.. 1974. Effect of temperature on time from planting to flowering in Virginia type peanuts (Arachis hypogaea L.). Peanut Sci. 1:86-90. doi: [: 10.3146/i0095-3679-1-2-12].
Cox K., Scherm H., and Serman N.. 2005. Ground-penetrating radar to detect and quantify residual root fragments following peach orchard clearing. Hort. Technology. 15:600-607.
Craufurd P.Q., Prasad P.V., Kakani G.V., Wheeler T.R., and Nigam S.N.. 2003. Heat tolerance in groundnut. Field Crops Res. 80:63-77.
Curran P.J. 1989. Remote sensing of foliar chemistry. Remote Sens. Environ. 30:271–278. doi:1 [: 0.1016/0034-4257(89)90069-2].
Dang P.; Patel J., Sorensen R., Lamb M., and Chen C.Y., Genome-wide association analysis identified Quantitative Trait Loci (QTLs) underlying drought-related traits in cultivated peanut (Arachis hypogaea L.). Genes 2024. 15(7):868. doi: [: 10.3390/genes15070868].
Dang P.M., Chen C.Y., and Holbrook C.C.. 2013. Evaluation of five peanut (Arachis hypogaea) genotypes to identify drought responsive mechanisms utilizing candidate-gene approach. Funct. Plant Biol. 40:1323-1333.
Del Pozo A., Yáñez A., Matus I.A., Tapia G., Castillo D., Sanchez-Jardón L., and Araus J.L.. 2016. Physiological traits associated with wheat yield potential and performance under water-stress in a Mediterranean environment. Front. Plant Sci. 7. doi: [: 10.3389/fpls.2016.00987].
Demir I., and Mavi K.. 2008. Effect of salt and osmotic stress on the germination of pepper seeds of different maturation stages. Braz. Arch. Biol. Technol. 51:987-902. doi: [: 10.1590/S1516-89132008000500004].
Desmae H., Janila P., Okori P., Pandey M.K., Motagi B.M., Monyo E., Mponda O., Okello D., Sako D., Echeckwu C., Oteng-Frimpong R., Miningou A., Ojiewo C., and Varshney R.K.. 2018. Genetics, genomics and breeding of groundnut (Arachis hypogaea L.). Plant Breeding. 138:425–444. doi: [: 10.1111/pbr.12645].
Devi J.M., and Sinclair T.R.. 2011. Diversity in drought traits among commercial southeastern US peanut cultivars. Int. J. Agronomy. doi: [: 10.1155/2011/754658].
Devi J.M., Sinclair T.R., and Vadez V.. 2010. Genotypic variation in peanut for transpiration response to vapor pressure deficit. Crop Sci. 50:191-196.
Devi J.M., Sinclair T.R., Vadez V., and Krishnamurthy L.. 2009. Peanut genotypic variation in transpiration efficiency and decreased transpiration during progressive soil drying. Field Crops Res. 114: 280-285.
Dhanapal A.P., Ray J.D., Singh S.K., Hoyos-Villegas V., Smith J.R., Purcell L.C., King C.A., Cregan P.B., and Fritschi F.B.. 2015. Genome-wide association study (GWAS) of carbon isotope ratio (Δ13C) in diverse soybean [Glycine max (L.) Merr.] genotypes. Theor. Appl. Genet. 128:73-91. doi: [: 10.1007/s00122-014-2413-9].
Dhanapal A.P., Ray J.D., Singh S.K., Hoyos-Villegas V., Smith J.R., Purcell L.C., King C.A., and Fritschi F.B.. 2015. Genome-wide association analysis of diverse soybean genotypes reveals novel markers for Nitrogen derived from atmosphere (Ndfa), nitrogen concentration ([N]) and C/N ratio. Plant Genome 8:3. doi: [: 10.3835/plantgenome2014.11.0086].
Dobreva I.D., Ruiz-Guzman H.A., Barrios-Perez I., Adams T., Teare B.L., Payton P., Everett M.E., Burow M.D., and Hays D.B.. 2021. Thresholding analysis and feature extraction from 3D ground penetrating radar data for noninvasive assessment of peanut yield. Remote Sensing. 13(10):1896.
Donald C.M. 1968. The breeding of crop ideotype. Euphytica. 17:385-403. doi: [: 10.1007/bf00056241].
Duncan W.G., McCloud D.E., McGraw R.L., and Boote K.J.. 1978. Physiological aspects of peanut yield improvement. Crop Sci. 18:1015-1020.
Ehleringer J.R., Klassen S., Clayton C., Sherrill D., Fuller-Holbrook M., Fu Q.A., and Cooper T.A.. 1991. Carbon isotope discrimination and transpiration efficiency in common bean. Crop Sci. 31:1611-1615. doi: [: 10.2135/cropsci1991.0011183X003100060046x].
Ehlert D., Heisig M., and Adamek R.. 2010. Suitability of a laser rangefinder to characterize winter wheat. Precision Agric. 11(6): 650-663. doi: [: 10.1007/s11119-010-9191-4].
Ehrler W.L., Idso S.B., Jackson R.D., and Reginato R.J.. 1978. Diurnal changes in plant water potential and canopy temperature of wheat as affected by drought. Agron. J. 70:999-1004.
Emery D.A., Wynne J.C., and Hexem R.O.. 1969. A heat unit index for Virginia type peanuts. I. germination to flowering. Oleagineux. 24:405-409.
Erdle K., Mistele B., and Schmidhalter U.. 2011. Comparison of active and passive spectral sensors in discriminating biomass parameters and nitrogen status in wheat cultivars. Field Crops Res. 124(1):74-84. doi: [: 10.1016/j.fcr.2011.06.007].
FAO. 2012. Coping with water scarcity, FAO Water Report 38. Food and Agriculture Organization of the United Nations, Rome, Italy. Online available at http://www.fao.org/3/i3015e/i3015e.pdf (accessed 2019Dec).
Farquhar G.D., Ehleringer J.R., and Hubick K.T.. 1989. Carbon isotope discrimination and photosynthesis. Ann. Rev. Plant Phys. Plant Mol. Biol. 40:503-537. doi: [: 10.1146/annurev.pp.40.060189.002443].
Farquhar G.D., von Caemmerer S., and Berry J.A.. 1980. A biochemical model of photosynthetic CO2 assimilation in leaves of C3 species. Planta. 149:78–90. doi: [: 10.1007/BF00386231].
Faye F., Pandey M.K., Hamidou F., Rathore A., Ndoye O., Vadez V., and Varshney R.K.. 2015. Identification of quantitative trait loci for yield and yield related traits in groundnut (Arachis hypogaea L.) under different water regimes in Niger and Senegal. Euphytica. 206:631–647. doi: [: 10.1007/s10681-015-1472-6].
Ferrio J.P., Bertran E., Nachit M., Royo C., and Araus J.L.. 2001. Near infrared reflectance spectroscopy as a potential surrogate method for the analysis of Δ13C in mature kernels of durum wheat. Aust. J. Agric. Res. 52. doi: [: 10.1071/AR00116].
Fiorani F., and Schurr U.. 2013. Future scenarios for plant phenotyping. Ann. Rev. Plant Biol. 64:17.1–17.25. doi: [: 10.1146/annurev-arplant-050312-120137].
Fischer R.A., Rees D., Sayre K.D , Lu Z.-M., Condon A.G., and Larque Saavedra A.. 1998. Wheat yield progress associated with higher stomatal conductance and photosynthetic rate, and cooler canopies. Crop. Sci. 38:1467-1475.
Fleta-Soriano E., Pinto-Marijuan M., and Munne-Bosch S.. 2015. Evidence of drought stress memory in the facultative CAM, Aptenia cordifolia: possible role of phytohormones. PLoS ONE. 10:e135391, doi: [: 10.171/journal.pone.0135391].
Freeman K.W., Girma K., Arnall D.B., Mullen R.W., Martin K.L., Teal R.K., and Raun W.R.. 2007. By-plant prediction of corn forage biomass and nitrogen uptake at various growth stages using remote sensing and plant height. Agron. J. 99(2):530-536. doi: [: 10.2134/agronj2006.0135].
Furbank R.T., and Tester M.. 2011. Phenomics – technologies to relieve the phenotyping bottleneck. Trends Plant Sci. 16:635–644. doi: [: 10.1016/j.tplants.2011.09.005].
Gan R-Y., Lui W-Y., Wu K., Chang C-L., Dai S-H., Sui Z-Q., and Corke H.. 2017. Bioactive compounds and bioactivities of germinated edible seeds and sprouts: An update review. Trends Food Sci. Tech. 59:1-14. doi: [: 10.1016/j.tifs.2016.11.010].
Garbout A., Munkholm L.J., Hansen S.B., Petersen B.M., Munk O.L., Pajor R.. 2012. The use of PET/CT scanning technique for 3D visualization and quantification of real-time soil/plant interactions. Plant Soil. 352:113-127. doi: [: 10.1007/s11104-011-0983-8].
Gimode D., Chu Y., Holbrook C.C., Fonceka D., Porter W., Dobreva I., Teare B., Ruiz-Guzman H., Hays D., and Ozias-Akins P.. 2023. High-throughput canopy and belowground phenotyping of a set of peanut CSSLs detects lines with increased pod weight and foliar disease tolerance. Agronomy. 13(5):1223.
Girija C., Smith B.N., and Swamy P.M.. 2002. Interactive effects of sodium chloride and calcium chloride on the accumulation of proline and glycinebetaine in peanut (Arachis hypogaea L.). Environ. Exper. Bot. 47:1-10. doi: [: 10.1016/S0098-8472(01)00096-X].
Gnyp M.L., Miao Y., Yuan F., Ustin S.L., Yu K., Yao Y., Huang S., and Bareth G.. 2014. Hyperspectral canopy sensing of paddy rice aboveground biomass at different growth stages. Field Crops Res. 155:42-55. doi: [: 10.1016/j.fcr.2013.09.023].
Goldman J., Smith O., Simpson C., and Melouk H.. 1995. Progress in breeding Sclerotinia blight-resistant runner-type peanut. Peanut Sci. 22:109-113. doi: [: 10.3146/i0095-3679-22-2-7].
Golombek S.D., and Johansen C.. 1997. Effect of soil temperature on vegetative and reproductive growth and development in three Spanish genotypes of peanut (Arachis hypogaea L.). Peanut Sci. 24:67-72. doi: [: 10.3146/i0095-3679-24-2-1].
Gomez-Selvaraj M., Montoya M.E., Atanbori J., French A.P., and Pridmore T.. 2019. A low-cost aeroponic phenotyping system for storage root development: unravelling the below-ground secrets of cassava (Manihot esculenta). Plant Methods. 15:131. doi: [: 10.1186/s13007-019-0517-6].
Gonnety J.T., Niamké S., Faulet B.M., Kouradio E. J-P.N., and Kouamé L.P.. 2007. Purification, kinetic properties and physicochemical characterization of a novel acid phosphatase (AP) from germinating peanut (Arachis hypogaea) seed. Ital. J. Biochem. 56:149-157.
Grey T.L., Beasley J.M., Webster T.M., and Chen C.Y.. 2011. Peanut seed vigor evaluation using thermal gradient. Int. J. Agron. http://hindawi.com/journals/ija/aip/202341/ 2020Jan.
Grey T.L., Branch W.D., Tubbs R.S., Snider J.L., Webster T.M., Arnold J., and Li X.. 2016. The impact of genotype × environment effects on runner-type peanut seed vigor response to temperature. Crop Ecol. Physiol. 108(4):1424-1433. doi: [: 10.2134/agronj2015.0420].
Guerke W.R. 2005. Evaluating peanut (Arachis hypogaea L.) seed vigor. Seed Technol. 27(1):121-126.
Hake A.A., Shirasawa K., Yadaward A., Sukruth M.. Patil M., and Nayak S.N.. 2017. Mapping of important taxonomic and productivity traits using genetic and non-genetic transposable element markers in peanut (Arachis hypogaea L.). PLoS ONE. 12:e0186113. doi: [: 10.1371/journal.pone.0186113].
Halilou O., Hamidou F., Taya B.K., Mahamane S., and Vadez V.. 2015. Water use, transpiration efficiency and yield in cowpea (Vigna unguiculata) and peanut (Arachis hypogaea) across water regimes. Crop Pasture Sci. 66:715-728. doi: [: 10.1071/CP14182].
Haro R.J., Baldessari J., and Otegui M.E.. 2013. Genetic improvement of peanut in Argentina between 1948 and 2004: seed yield and its components. Field Crops Res. 149:76-83.
Haro R.J., Baldessari J., and Otegui M.E.. 2015. Genetic improvement of peanut in Argentina between 1948 and 2004: links between phenology and grain yield determinants. Field Crops Res. 174:12-19.
Haro R.J., Baldessari J., and Otegui M.E.. 2017. Genetic improvement of peanut in Argentina between 1948 and 2004: light interception, biomass production and radiation use efficiency. Field Crops Res. 204:222-228.
Harris H.C. and Gilman R.L.. 1957. Effect of boron on peanuts. Soil Sci. 84:233-242.
Hawkins J.F. 2014. The effects of soil moisture and vapor pressure deficit on field grown peanut. M.S. Thesis. Virginia Tech Univ, Blacksburg, VA.
Hollowell J., Isleib T., Tallury S., Copeland S., and Shew B.. 2008. Screening of Virginia-type peanut breeding lines for resistance to Cylindrocladium black rot and Sclerotinia blight in the greenhouse. Peanut Sci. 35:18-24. doi: [: 10.3146/PS07-003.1].
Hong T.D., and Ellis R.H.. 1992. The survival of germinating orthodox seeds after desiccation and hermitic storage. J. Exp. Bot. 43:239-247. https://www.jstor.org/stable/23694018.
HongYan C., GuangHua Z., XinMing J., TinYun K., PeiSong T., KarLing T., MingDe Z., and NaiXiong D.. 1997. Storage of peanut seeds with low moisture content for 11 years in ambient temperature. Plant Gen. Res. News. 110:35-40.
Hoogenboom G., Porter C.H., Shelia V., Boote K.J., Singh U., Pavan W., Oliveira F.A.A., Moreno-Cadena L.P., Ferreira T.B., White J.W., Lizaso J.I., Pequeno D.N.L., Kimball B.A., Alderman P.D., Thorp K.R., Cuadra S.V., Vianna M.S., Villalobos F.J., Batchelor W.D., Asseng S., Jones M.R., Hopf A., Dias H.B., Hunt L.A., and Jones J.W.. 2023. Decision Support System for Agrotechnology Transfer (DSSAT) Version 4.8.2. https://www.DSSAT.net. DSSAT Foundation, Gainesville, Florida, USA.
Howe J.A., Florence R.J., Harris G., van Santen E., Beasley J.P., Bostick J.P., and Balkcom K.B.. 2012. Effect of cultivar, irrigation, and soil calcium on runner peanut response to gypsum. Agron. J. 104:1312-1320. doi: [: 10.2134/agronj2012.0115].
Hu T., Liu S., Amombo E., and Fu J.. 2015. Stress memory induced rearrangements of HSP transcription, photosystem II photochemistry and metabolism of tall fescue (Festuca arundinacea Schreb.) in response to high-temperature stress. Front. Plant Sci. 6:403, doi: [: 10.3389/fpls.2015.00403].
Hu X.H., Zhang S.Z., Miao H.R., Cui F.G., Shen Y., Yang YQ., Xu T.T., Chen N., Chi X.Y., Zhang Z.M., and Chen J.. 2018. High-density genetic map construction and identification of QTLs controlling oleic and linoleic acid in peanut using SLAF-seq and SSRs. Scientific Reports. 8:5479. doi: [: 10.1038/s41598-018-23873-7].
Hubick K.T., Shorter R., and Farquhar G.D.. 1988. Heritability and genotype × transpiration efficiency in peanut (Arachis hypogaea L.). Aust. J. Plant Phys. 15:799-813. doi: [: 10.1071/PP9880799].
Isleib T.G., Day J.L., Coy A.E., Beasley J.P., and Branch W.D.. 2014. Genotype-by-irrigation interaction in the Georgia peanut official variety test. Peanut Sci. 41:1-7. doi: [: 10.3146/0095-3679-41.1.1].
Isleib T.G., Holbrook C.C., and Gorbet D.W.. 2001. Use of plant introductions in peanut cultivar development. Peanut Sci. 28:96-113. doi: [: 10.3146/i0095-3679-28-2-11].
Isola M.C., and Franzoni L.. 2000. Changes of aspartate aminotransferase activity, its isoform pattern, and free amino acids content in peanut cotyledons during seed germination. Acta Phys. Plant. 22:125-128. doi: [: 10.1007/s11738-000-0066-6].
Iwasaki M., and Paszkowski J.. 2014. Epigenetic memory in plants. EMBO J. 33: 1987-1998. doi: [: 10.15252/embj.201488883].
Jackson J.L., Beasley, Jr. J.P., Tubbs R.S., Lee R.D., and Grey T.L.. 2011. Fall-bedding for reduced digging losses and improved yield in strip-till peanut. Peanut Sci. 38 (1):31-40. doi: [: 10.3146/0095-3679-38.1.31].
Janila P., Singh M.S., Abhishek R., and Nigam S.N.. 2015. Inheritance of SPAD chlorophyll meter reading and specific leaf area in four crosses of groundnut (Arachis hypogaea L.) Indian J. Genetics Plant Breeding. 75(3):408-425. doi: [: 10.5958/0975-6906.2015.00067.X].
Jia L., Zhao C., Wang Y., and Wang M.. 2013. Effects of different soil textures on the growth and distribution of root system and yield in peanut. Chinese J. Plant. Ecol. 37(7):684-690.
Jiao W.B., and Schneeberger K.. 2017. The impact of third generation genomic technologies on plant genome assembly. Curr. Op. Plant. Biol. 36:64–70. doi: [: 10.1016/j.pbi.2017.02.002].
John K., Reddy P.R., Reddy K.H., Sudhalar P., and Reddy N.P.E.. 2014. Combining ability studies to identify crosses and good combiners for developing new genotypes for yield and water use efficiency traits in groundnut (Arachis hypogaea L.). Legume Res. 37(3):235-244.
Johnson L.F., Roczen D.E., Youkhana S.K., Nemani R.R., and Bosch D.F.. 2003. Mapping vineyard leaf area with multispectral satellite imagery. Computers and Electronics in Agriculture. 38(1):33-44. doi: [: 10.1016/S0168-1699(02)00106-0].
Jones H.G. and Vaughan R.A.. 2010. Remote Sensing of Vegetation: Principles, Techniques, and Applications. Oxford University Press.
Jones J.W., Hoogenboom G., Porter C.H., Boote K.J., Batchelor W.D., Hunt L.A., Wilkens P.W., Singh U., Gijsman A.J., and Ritchie J.T.. 2003. The DSSAT cropping system model. Eur. J. Agron. 18:235-265.
Jongrungklang N., Toomsan B., Vorasoot N., Jogloy S., Boote K.J., Hoogenboom G., and Patanothai A.. 2011. Rooting traits of peanut genotypes with different yield responses to pre-flowering drought stress. Field Crops Res. 120:262-270.
Jongrungklang N., Toomsan B., Vorasoot N., Jogloy S., Boote K.J., Hoogenboom G., and Patanothai A.. 2012. Classification of root distribution patterns and their contribution to yield in peanut genotypes under mid-season drought stress. Field Crops Res. 127:181-190.
Jordan D.L., Barnes J.S., Bogle C.R., Brandenburg R.L., Bailey J.E., Johnson P.D., and Culpepper S.A.. 2003. Peanut response to cultivar selection, digging date, and tillage intensity. Agron. J. 95:380-385.
Jordan D.L., Brandenburg R.L., Brown A.B., Bullen S.G., Buol G., Dean L., Foote B., Hare A., Kaufman A., Reberg-Horton C., Roberson G.T., Shew B., Washburn D., and Wilkerson G.. 2018. Peanut Information. NC State Extension, CALS, NC State Univ. Online publication https://peanut.ces.ncsu.edu/wp-content/uploads/2018/12/2019-Peanut-Information-Guide-Draft.pdf?fwd=no. 2020Jan.
Juma N.G. 1993. Interrelationships between soil structure/texture, soil biota/soil organic matter, and crop production. Geoderma. 57:3-30. doi: [: 10.1016/0016-7061(93)90145-B].
Kassie F.C., Nguepjop J.R., Ngalle H.B., Assaha D.V., Gessese M.K., Abtew W.G., Tossim H.A., Sambou A., Seye M., Rami J.F. and Fonceka D., 2023. An overview of mapping quantitative trait loci in peanut (Arachis hypogaea L.). Genes. 14(6):1176.
Kassim Y.B., Oteng-Frimpong R., Puozaa D.K., Sie E.K., Abdul Rasheed M., Abdul Rashid I., Danquah A., Akogo D.A., Rhoads J., Hoisington D., Burow M.D., and Balota M.. 2022. High-throughput plant phenotyping (HTPP) in resource-constrained research programs: A working example in Ghana. Agronomy (MDPI). 12:2733. doi: [: 10.3390/agronomy12112733].
Kayam G., Brand Y., Faigenboim-Doron A., Patil A., Hedvat I., and Hovav R.. 2017. Fine-mapping the branching habit trait in cultivated peanut by combining bulked segregant and high-throughput sequencing. Front. Plant Sci. 8:467, doi: [: 10.3389/fpls.2017.00467].
Keating B. P., Carberry G., Hammer M., Probert M., Robertson D., Holtzworth N., Huth J.N.G., Hargreaves H., Meinke Z., Hockman G. McLean K. Verburg V. Snow J.P. Dimes M. Silburn E. Wang S. Brown K.L. Bristow S. Asseng S. , and Smith C.J.. 2003. An overview of APSIM, a model designed for farmer systems simulation. Eur. J. Agron. 18:267-288. doi: [: 10.1016/S1161-0301(02)00108-9].
Ketring D. L. 1979. Physiology of oil seeds. VIII. Germination of peanut seed exposed to subfreezing temperatures while drying in the windrow. Peanut Sci. 6:80-83. doi: [: 10.3146/i0095-3679-6-2-4].
Ketring D.L. 1984. Temperature effect on vegetative and reproductive development of peanut. Crop Sci. 24:877-882.
Khedikar Y., Pandey M. K., Sujay V., Singh S., Nayak S.N., Klein-Gebbinck H. W., and Bhat R.S.. 2018. Identification of main effect and epistatic quantitative trait loci for morphological and yield‐related traits in peanut (Arachis hypogaea L.). Molecular Breeding. 38:1–12. doi: [: 10.1007/s11032-017-0764-z].
Kiniry J., Simpson C., Schubert A., and Reed J.. 2005. Peanut leaf area index, light interception, radiation use efficiency, and harvest index at three sites in Texas. Field Crops Res. 91: 297-306.
Kirchgessner N., Liebisch F., Yu K., Pfeifer J., Friedli M., Hund A., and Walter A.. 2017. The ETH field phenotyping platform FIP: a cable-suspended multi-sensor system. Functional Plant Biology. 44(1):154. doi: [: 10.1071/fp16165].
Kolhar S. and Jagtap J.. 2023. Plant trait estimation and classification studies in plant phenotyping using machine vision–A review. Information Processing in Agriculture. 10(1):114-135.
Kuijken R.C., van Eeuwijk F.A., Marcelis L.F., and Bouwmeester H.J.. 2015. Root phenotyping: from component trait in the lab to breeding. J. Exp. Bot. 66:5389-5401. doi: [: 10.1093/jxb/erv239].
Kumar N.; Haak D.C.; Dunne J.C.; Balota M. 2024. Phenotypic dissection of drought tolerance in Virginia and Carolinas within a Recombinant Inbred Line population involving a Spanish and a Virginia type peanut lines. Agriculture. 14:908. doi: [: 10.3390/ agriculture14060908].
Kumar N. D.C. Haak J.C. , and Balota M.. 2022. Multilocation evaluation of Virginia and Runner type peanut cultivars for yield and grade in Virginia–Carolina region. Agronomy 2022. 12:3206. doi: [: 10.3390/ agronomy12123206].
Kvien C.K., Holbrook C.C., Ozias-Akins P., Pilon C., Culbreath A.K., and Brenneman T.B.. 2022. Peanut Physiology. In: Peanut Production Guide. W.S. Monfort (ed.). Bulletin 1146. University of Georgia Cooperative Extension.
Labus M. P., Nielsen G.A., Lawrence R.L., Engel R., and Long D.S.. 2002. Wheat yield estimates using multi-temporal NDVI satellite imagery. Int. J. Remote Sensing. 23(20):4169-4180. doi: [: 10.1080/01431160110107653].
Leal-Bertioli S.C.M., Bertioli D.J., Guimaraes P.M., Pereira T.D., Galhardo I., Silva J.P., Brasileiro A.C.M., Oliveira R.S., Silva P.I.T., Vadez V., and Araujo A.C.C.. 2012. The effect of tetraploidization of wild Arachis on leaf morphology and other drought-related traits. Environ. Exp. Bot. 84:17-24. doi: [: 10.1016/j.envexpbot.2012.04.005].
Leblova S., Sinecka E., and Vanickova V.. 1974. Pyruvate metabolism in germinating seeds during natural anaerobiosis. Biol. Plant. 16:406-411. doi: [: 10.1007/BF02922229].
Li L., Yang X., Cui S., Meng X., Mu G., Hou M., He M., Zhang H., Liu L., and Chen C.Y.. 2019. Construction of high-density genetic map and mapping quantitative trait loci for growth habit-related traits of peanut (Arachis hypogaea L.). Front. Plant Sci. 10:745, doi: [: 10.3389/fpls.2019.00745].
Li Y., Li L., Zhang X., Zhang K., Ma D., Liu J., Wang X., Liu F., and Wan Y.. 2017. QTL mapping and marker analysis of main stem height and the first lateral branch length in peanut (Arachis hypogaea L.). Euphytica. 213:57. doi: [: 10.1007/s10681-017-1847-y].
Li Y-C., Qian H., Sun X-L., Cui Y., Wang H-Y., Du C., and Xia X-H.. 2014. The effects of germination on chemical composition of peanut seed. Food Sci. Tech. Res. 20:883-889. doi: [: 10.3136/fstr.20.883].
Liang Y., Cason J.M., Baring M.R., and Septiningsih E.M.. 2021. Identification of QTLs associated with Sclerotinia blight resistance in peanut (Arachis hypogaea L.). Genetic Resources and Crop Evolution. 68:629-637.
Lim J-H., Park K-J., Kim B-K., Jeong J-W., and Kim H-J.. 2012. Effect of salinity stress on phenolic compounds and carotenoids in buckwheat (Fagopyrum esculentum M.) sprout. Food Chem. 135:1065-1070. doi: [: 10.1016/j.foodchem.2012.05.068].
Liu N., Luo H., Huang L., Zhou X., Chen W., Wu B., Guo J., Huai D., Chen Y, Lei Y., and Liao B.. 2024. High-resolution mapping through whole-genome resequencing identifies two novel QTLs controlling oil content in peanut. J. Integrative Agric. doi: [: 10.1016/j.jia.2024.08.028].
Liu X., Dong X., Xue Q., Lescovar D.I., Jifon J., Butnor J.R., Marek T.. 2018. Ground penetrating radar (GPR) detects fine roots of agricultural crops in the field. Plant Soil. 423:517-531. doi: [: 10.1007/s11104-017-3531-3].
Lopez Y., Burrow M.D., Baring M.A., Ayers J.L., Cason J., and Simpson C.E.. 2003. Determination of maturity of standard varieties in West Texas. Proc. Am. Peanut. Res. Educ. Soc. 35:34-35.
Luster D.G. 1985. Respiratory metabolism and transport during seed germination: Reponses to biotic and abiotic stress. North Carolina State University, PhD Dissertation. 140 pp.
J Lv.., Liu N., Guo J., Xu Z., Li X., Li Z., Luo H., Ren X., Huang L., Zhou X., Chen Y., Chen W., Lei Y., Tu J., Jiang H., and Liao B.. 2018. Stable QTLs for plant height on chromosome A09 identified from two mapping populations in peanut (Arachis hypogaea L.). Front. Plant Sci. 9:684, doi: [: 10.3389/fpls.2018.00684].
Mane V.A., Ladole M.Y., Shinde A.A., and Bhuyar A.R.. 2017. Physiological analysis of growth and yield variation in groundnut (Arachis hypogaea L.). Electron. J. Plant Breeding. 8(4):1258-1264. doi: [: 10.5958/0975-928X.2017.00180.6].
Massa A.N., Sobolev V.S., Faustinelli P.C., Tallury S.P., Stalker H.T., Lamb M.C., Arias R.S.. 2024. Genetic diversity, disease resistance, and environmental adaptation of Arachis duranensis L.: New insights from landscape genomics. PLoS ONE 19(4): e0299992. doi: [: 10.1371/journal.pone.0299992].
McAdam S.A.M., and Brodribb T.J.. 2014. Separating active and passive influences on stomatal control of transpiration. Plant Physiology. 164:1578-1586.
Meena H.N., and Yadav R.S.. 2018. Effects of reusing peanut seeds grown in saline irrigation water on yield attributes and quality traits. J. Irrig. Drain. Eng. 144:04018002-1-04018002-5. doi: [: 10.1061/(ASCE)IR.1943-4774.0001281].
Meena H.N., Meena M., and Yadav R.S.. 2016. Comparative performance of seed types on yield potential of peanut (Arachis hypogaea L.) under saline irrigation. Field Crops Res. 196:305-310. doi: [: 10.1016/j.fcr.2016.06.006].
Mills W.T. 1964. Heat unit system for predicting optimum peanut-harvesting time. Trans. of the ASAE. 7:307-309, 312.
Mohandass R., Radhakrishnan R., Panchanathan P.M., and Kandaswamy P.. 1989. Diurnal pattern of plant water relations of groundnut under water stress and potassium nutrition. J. Agronomy and Crop Sci. 163:18-20.
Mondal S., and Badigannavar A.M.. 2019. Identification of major consensus QTLs for seed size and minor QTLs for pod traits in cultivated groundnut (Arachis hypogaea L.). 3 Biotech. 9:347. doi: [: 10.1007/s13205-019-1881-7].
Monsef H.A., Smith S.E., Rowland D.L., and Al-Rasol N.A.. 2019. Using multispectral imagery to extract a pure spectral canopy signature for predicting peanut maturity. Computers and Electronics in Agric. 162:561-572.
Mora F., Castillo D., Lado B., Matus I., Poland J., Belzile F., von Zitzewitz J., and del Pozo A.. 2015. Genome-wide association mapping of agronomic traits and carbon isotope discrimination in a worldwide germplasm collection of spring wheat using SNP markers. Mol. Breeding. 35:69. doi: [: 10.1007/s11032-015-0264-y].
Mortley D.G., Bonsi C.K., Loretran P.A., Hill W.A., and Mortis C.E.. 2000. High relative humidity increases yield, harvest index, flowering, and gynophore growth of hydroponically grown peanut plants. Hort. Sci. 35:46–48.
Morton B.R., Tillman B.L., Gorbet D.W., and Boote K.J.. 2008. Impact of seed storage environment on field emergence of peanut cultivars. Peanut Sci. 35:108-115. doi: [: 10.3146/PS07-111.1].
Nagel K.A., Putz A., Gilmer F., Heinz K., Fischbach A., Pfeifer J., Faget M., Blossfeld S., Ernst M., and Dimaki C.. 2012. GROWSCREEN- Rhizo is a novel phenotyping robot enabling simultaneous measurements of root and shoot growth for plants grown in soil-filled rhizotrons. Funct. Plant Biol. 39:891-904. doi: [: 10.1071/FP12023].
Nageswara Rao R.C. and Wright G.C.. 1994. Stability of the relationship between specific leaf area and carbon isotope discrimination across environments in peanut. Crop Sci. 34:98-103.
Nboyine J., Oteng-Frimpong R., Arthur S., Sugri I., Puozaa D., Mahama G., Seidu A., Agrengsore P., Mochiah M., Abudulai M., Dzomeku I., Akromah R., Asibuo J., Appaw W., Abdul-Razak M., Buol G., Jordan D., Brandenburg R., MacDonald G., Hoisington D., and Rhoads J.. 2023. Managing Risk: a decision-tool to enhance yield and quality of peanut (Arachis hypogaea) in Ghana. Peanut Sci. 50(1):65-84. doi: [: 10.3146/0095-3679-501-PS23-2].
Netsangtip R., Rerkasem B., Bell R.W., and Loneragan J.F.. 1987. A field survey of boron deficiency in peanuts grown in the Chiang Mai valley. Food Legume Improve. Asian Farming Syst. 264. Austral. Centre Internl. Res.
Nigam S.N. and Aruna R.. 2007. Improving breeding efficiency for early maturity in peanut. Plant Breeding Rev. 30: 295-322.
Nigam S.N., and Aruna R.. 2008. Stability of soil plant analytical development (SPAD) chlorophyll meter reading (SCMR) and specific leaf area (SLA) and their association across varying soil moisture stress conditions in groundnut (Arachis hypogaea L.). Euphytica. 160:111-117.
Nigam S., Chandra S., Sridevi K.R., Bhukta M., Reddy A., Rachaputi N.R., Wright G.C., Reddy P.V., Desmukh M.P., Mathur R.K., Basu M.S., Vasundhara S., Vindhiya Varman P., and Ngada A.K.. 2005. Efficiency of physiological trait‐based and empirical selection approaches for drought tolerance in groundnut. Annals Appl. Biol. 146: 433-439.
Ninomiya S. 2022. High-throughput field crop phenotyping: current status and challenges. Breeding Sci. 72(1):3-18.
Noorhosseini S.A., Soltani A., and Ajamnoroozi H.. 2018. Simulating peanut (Arachis hypogaea L.) growth and yield with the use of the Simple Simulation Model (SSM). Computers and Electronics in Agric. 145:63-75.
Ntare B.R., Williams J.H., and Dougbedji J.. 2001. Evaluation of groundnut genotypes for heat tolerance under field conditions in Sahelian environment using a simple physiological model for yield. J. Agric. Sci. 136:81-88.
Oakes J., and Balota M.. 2017. Distinguishing plant population and variety with UAV-derived vegetation indices. Proc. SPIE 10218, Autonomous Air and Ground Sensing Systems for Agricultural Optimization and Phenotyping II, 102180G. doi: [: 10.1117/12.2262631].
Oakley C.G., Savage L., Lotz S., Larson G.R., Thomashow M.F., and Kramer D.M.. 2018. Genetic basis of photosynthetic responses to cold in two locally adapted populations of Arabidopsis thaliana. J. Exp. Bot. 69:699–709. doi: [: 10.1093/jxb/erx437].
Ocheltree T.W., Nippert J.B., and Prasad P.V.. 2014. Stomatal responses to changes in vapor pressure deficit reflect tissue-specific differences in hydraulic conductance. Plant Cell Environment. 37:132-139.
Oteng-Frimpong R, Karikari B, Sie E.K., Kassim Y.B., Puozaa DK, Rasheed MA, Fonceka D, Okello DK, Balota M, Burow M and Ozias-Akins P. 2023. Multi-locus genome-wide association studies reveal genomic regions and putative candidate genes associated with leaf spot diseases in African groundnut (Arachis hypogaea L.) germplasm. Front. Plant Sci. 13:1076744. doi: [: 10.3389/fpls.2022.1076744].
Pallardy S. 2007. Transpiration and plant water balance. pgs 325-366, In: Pallardy S. (Eds), Physiology of Woody Plants, Elsevier, Burlington, MA.
Pallas Jr., J.E., Stansell J.R., and Bruce R.R.. 1977. Peanut seed germination as related to soil water regime during pod development. Agron. J. 69(3):381-383.
Pandey R., Herrera W., Villegas A., and Pendleton J.. 1984. Drought response of grain legumes under irrigation gradient: III. Plant Growth 1. Agron. J. 76:557-560.
Paredes J.A., Guzzo M.C., Monguillot J.H., Asinari F., Posada G.A., Oddino C.M. et al. ( 2024) Low water availability increases susceptibility to peanut smut (Thecaphora frezzii) in peanut crop. Plant Pathology. 73:316–325. doi: [: 10.1111/ppa.13810].
Passioura J.B. 1996. Drought and drought tolerance. Plant Growth Regul. 20: 79–83.
Penuelas J., and Filella I.. 1998. Visible and near-infrared reflectance techniques for diagnosing plant physiological status. Trends Plant Sci. 3:151–156. doi: [: 10.1016/S1360-1385(98)01213-8].
Pilon C., Snider J.L., Sobolev V., Chastain D.R., Sorensen R.B., Meeks C.D., Massa A.N., Walk T.D., Singh B., and Earl H.J.. 2018. Assessing stomatal and non-stomatal limitations to carbon assimilation under progressive drought in peanut (Arachis hypogaea L.). J. Plant Physiol. 231:124-134. doi: [: 10.1016/j.jplph.2018.09.007].
Pittman R. N. 1995. United States Peanut Descriptors, ARS 132. Tifton GA; U.S. Department of Agriculture, Agric. Res. Service.
Pittman J.J., Arnall D.B., Interrante S.M., Moffet C.A., and Butler T.J.. 2015. Estimation of biomass and canopy height in bermudagrass, alfalfa, and wheat using ultrasonic, laser, and spectral sensors. Sensors. 15(2):2920-2943. doi: [: 10.3390/s150202920].
Porcuna-Ferrer A., Calvet L., Faye N.F., Klappoth B., Reyes-Garcia V., Labeyrie V.. 2024. Drought-tolerant indigenous crops decline in the face of climate change: A political agroecology account from south-eastern Senegal. J. Rural Studies. 105, doi: [: 10.1016/j.jrurstud.2023.103163].
Portmann F.T., Siebert S., and Doll P.. 2010. MIRCA2000-Global monthly irrigated and rainfed crop areas around the year 2000: a new high-resolution data set for agricultural and hydrological modeling. Global Biogeochemical Cycles. 24:GB1011, doi: [: 10.1029/2008GB003435].
Pradhan D., Shekoofa A., and Sinclair T.R.. 2019. Temperature effect on peanut (Arachis hypogaea L.) transpiration response to vapor pressure deficit and its recovery. J. Crop. Improv. 33:177-186. doi: [: 10.1080/15427528.2018.1552900].
Prasad P.V.V., Boote K.J., Allen, Jr. L.H., and Thomas J.M.G.. 2003. Super-optimal temperatures are detrimental to peanut (Arachis hypogaea L.) reproductive processes and yield at both ambient and elevated carbon dioxide. Global Change Biol. 9(12):1775-1787 doi: [: 10.1046/j.1365-2486.2003.00708.x].
Prasad P.V.V., Boote K.J., Thomas J.M., Allen, Jr. L.H., and Gorbet D.W.. 2006. Influence of soil temperature on seedling emergence and early growth of peanut cultivars in field conditions. J. Agron. Crop Sci. 192:168-177. doi: [: 10.111/j.1439-037X.2006.00198.x].
Prasad P.V.V., Craufurd P.Q., Kakani V.G., Wheeler T.R., and Boote K.J.. 2001. Influence of high temperature during pre- and post-anthesis stages of floral development on fruit-set and pollen germination in peanut. Aust. J. Plant Physiol. 28:233-240.
Prasad P.V.V., Craufurd P.Q., Summerfield R.J., and Wheeler T.R.. 2000. Effects of short episodes of heat stress on flower production and fruit- set of groundnut (Arachis hypogaea L.). J. Exper. Botany. 51:777-784.
Prasad T.N.V.K.V., Sudhakar P., Sreenivasulu Y., Latha P., Munaswamy Castelfranco P., Lott J., and Sabar N.. 1969. Respiratory changes during seed germination. Histological distribution of respiratory enzymes and mobilization of fat reserves in castor bean endosperm and peanut cotyledons. Plant Physiol. 44:789-795. doi: [: 10.1104/pp.44.6.789].
Puppala N., Nayak S.N., Sanz-Saez A., Chen C., Devi M.J., Nivedita N., Bao Y., He G., Traore S.M., Wright D.A., Pandey M.K., and Sharma V.. 2023. Sustaining yield and nutritional quality of peanuts in harsh environments: Physiological and molecular basis of drought and heat stress tolerance. Front. Genet. 14:1121462. doi: [: 10.3389/fgene.2023.1121462].
Putnam D.H., Oplinger E.S., Teynor T.M., Oelke E.A., Kelling K.A., and Doll J.D.. 2014. Peanut alternative field crops manual. http://www.hort.purdue.edu/newcrop/afcm/peanut.html (accessed Oct 2019).
Putto C. A. Patanothai S. Jogloy K.J. , and Hoogenboom G.. 2013. Determination of plant traits that affect genotype × location (G × L) interaction in peanut using the CSM-CROPGRO-peanut model. Int. J. Plant Prod. 7(3):537-568. doi: [: 10.2135/cropsci2006.01.0050].
Racette K., Rowland D., Tillman B., Erickson J., Munoz P., and Vermerris W.. 2019. Transgressional stress memory in seed and seedling vigor of peanut (Arachis hypogaea L.) varies by genotype. Environ. Exp. Bot. 162:541-549. doi: [: 10.1016/j.envexpbot.2019.03.006].
Racette K., Zurweller B., Tillman B., and Rowland D.. 2020. Transgenerational stress memory of water deficit in peanut production. Field Crops Res. 248:107712. doi: [: 10/1016/j.fcr.2019.107712].
Radford P.J. 1967. Growth analysis formulae – their use and abuse. Crop Sci. 7(3):171-175.
Rahman N., Suntoro S., and Sakya A.T.. 2019. Peanut growth and gynophore formation on boron and phosphor applications. J. Soil Sci. and Agrocli. 16(1):57-66. Available online at http://jurnal.uns.ac.id/tanah (accessed Jan 2020).
Ramsey A.F., Tack J.B., and Balota M.. 2020. Double or nothing: impacts on warming on crop quantity, quality, and revenue. J. Agric. and Resource Econ. 47(1):1-22. doi: [: 10.22004/ag.econ.307462].
Raymond P., Al A., and Pradet A.. 1985. ATP production by respiration and fermentation, and energy charge during aerobiosis and anaerobiosis in twelve fatty and starchy germinating seeds. Plant Physiol. 79:879-884. doi: [: 10.1104/pp.79.3.879].
Reddy T.Y., Reddy V.R., and Anbumozhi V.. 2003. Physiological responses of groundnut (Arachis hypogaea L.) to drought stress and its amelioration: a critical review. Plant Growth Regul. 41:75-88.
Reed B.C., Brown J.F., VanderZee D., Loveland T.R., Merchant J.W., and Ohlen D.O.. 1994. Measuring phenological variability from satellite imagery. J. Vegetation Sci. 5(5):703-714. doi: [: 10.2307/3235884].
Retamal N., Lopez-Vences M., and Duran J.M.. 1990. Effect of gramma-irradiation on germination and leakage of electrolytes from peanut (Arachis hypogaea L.) seeds. Environ. Exper. Bot. 30:1-7. doi: [: 10.1016/0098-8472(90)90002-L].
Reynolds M.P., Balota M., Delgado M.I.B., Amani I., and Fischer R.A.. 1994. Physiological and morphological traits associated with spring wheat yield under hot, irrigated conditions. Aust. J. Plant. Physiol. 21:717-730.
Rivas R., Oliviera M.T., and Santos M.G.. 2013. Three cycles of water deficit from seed to young plants of Moringa oleifera woody species improve stress tolerance. Plant Physiol. Biochem. 63:200-208, doi: [: 10.1016/J.Plaphy.2012.11.026].
Roberts E.H. 1988. Temperature and seed germination. pgs 109-132 In: Long S.P., Woodward F.I. (eds.), Plants and Temperature, Symposia Soc. Exper. Biol., Cambridge, UK. Epub 1988/01/01. pmid:3077854.
Rogers E.D., Monaenkova D., Mijar M., Nori A., Goldman D.I., Benfey P.N.. 2016. X-ray computed tomography reveals the response of root system architecture to soil texture. Plant Physiol. 171:2028-2040. doi: [: 10.1104/pp.16.00397].
Rosas-Anderson P., Shekoofa A., Sinclair T.R., Balota M., Isleib T.G., Tallury S., and Rufty T.. 2014. Genetic variation in peanut leaf maintenance and transpiration recovery from severe soil drying. Field Crops Res. 158:65-72. doi: [: 10.1016/j.fcr.2013.12.019].
Rosegrant M., Cai Z., Cline S., and Nakagawa N.. 2002. The role of rainfed agriculture in the future of global food production. EPTD Discussion Paper 90, International Food Policy Research Institute, Washington DC. http://www.ifpri.org/publication/role-rainfed-agriculture-future-global-food-production 2019Dec.
Rowland D.L., and Lamb M.C.. 2005. The effect of irrigation and genotype on carbon and nitrogen isotope composition in peanut (Arachis hypogaea L.) leaf tissue. Peanut Sci. 32:48-56. doi: [: 10.3146/0095-3679(2005)32[48:TEOIAG]2.0.CO;2].
Rowland D.L., Faircloth W.H., and Butts C.L.. 2007. Effects of irrigation method and tillage regime on peanut (Arachis hypogaea L.) reproductive processes. Peanut Sci. 34:85-95. doi: [: 10.3146/0095-3679(2007)34[85:EOIMAT]2.0.CO;2].
Rowland D.L., Faircloth W.H., Payton P., Tissue D.T., Farrell J.A., Sorensen R.B., and Butts C.L.. 2012a. Primed acclimation of cultivated peanut (Arachis hypogaea L.) through the use of deficit irrigation timed to crop developmental periods. Agric. Water Management. 113:85095, doi: [: 10.1016/j.agwat.2012.06.023].
Rowland D., Puppala N., Beasley, Jr. J., Burow M., Gorbet D., Jordan D., Melouk H., Simpson C., Bostick J., and Ferrell J.. 2012b. Variation in carbon isotope ratio and its relation to other traits in peanut breeding lines and cultivars from U.S. trials. J. Plant Breeding and Crop Sci. 4(9):144-155.
Rowland D.L., Sorensen R.B., Butts C.L., and Faircloth W.H.. 2006. Determination of maturity and degree day indices and their success in predicting peanut maturity. Peanut Sci. 33:125-136. doi: [: 10.3146/0095-3679(2006)33[125:DOMADD]2.0.CO;2].
Rowland D.L., Sorensen R.B., Butts C.L., Faircloth W.H., and Sullivan D.G.. 2008. Canopy characteristics and their ability to predict peanut maturity. Peanut Sci. 35:43-54. doi: [: 10.3146/PS06-052.1].
Rucker K.S., Kvien C.K., Holbrook C.C., and Hook J.F.. 1995. Identification of peanut genotypes with improved drought avoidance traits. Peanut Sci. 22:14-18. doi: [: 10.3146/pnut.22.1.0003].
Ruiz M., Golberg A., and Molas M.L.. 2013. From seed to seedling: An ecophysiological point of view. Chapter 1, pgs 29-38, In Busso C.A. (ed.). From Seed Germination to Young Plants: Ecology, Growth and Environmental Influences. Nova Science Publs., Hauppauge, NY.
Saeed F., Sun J., Ozias-Akins P., Chu Y.J. and Li C.C., 2023. PeanutNeRF: 3D radiance field for peanuts. In Proc. IEEE/CVF Conference on Computer Vision and Pattern Recognition. pp. 6254-6263.
Sanders T.H., Schubert A.M., and Pattee H.E.. 1982. Maturity methodology and postharvest physiology, pp. 642-654. In: Pattee H.E. and Young C.T. (eds.) Peanut Sci. Technol. Amer. Peanut Res. Edu. Society, Inc., Yoakum, TX, USA.
Santos A.F., Correa L.N., Lacerda L.N., Tedesco-Oliveira D., Pilon C., Vellidis G., and Silva R.P.. 2021. High-resolution sattelite image to predict peanut maturity variability in commercial fields. Precision Ag. 22:1464-1478. doi: [: 10.1007/s11119-021-09791-1].
Santos A.F., Lacerda L.N., Rossi C., Moreno L.A., Oliveira M.F., Pilon C., Silva R.P., and Vellidis G.. 2022. Using UAV and multispectral images to estimate peanut maturity variability on irrigated and rainfed fields applying linear models and artificial neural networks. Remote Sensing. 14:93. doi: [: 10.3390/rs14010093].
Sarkar S., Cazenave A.B., Oakes J., McCall D., Thomason W., Abbott L., and Balota M.. 2021a. Aerial high-throughput phenotyping of peanut leaf area index and lateral growth. Sci Rep. 11:21661. doi: [: 10.1038/s41598-021-00936-w].
Sarkar S., Oakes J., Cazenave A.B., Burow M.D., Bennett R.S., Chamberlin K.D., Wang N., White M., Payton P., Mahan J., Chagoya J., Sung C-J., McCall D.S., Thomason T.E., and Balota M.. 2022. Evaluation of the U.S. peanut germplasm mini-core collection in the Virginia-Carolina region using traditional and high-throughput methods. Agronomy (MDPI). 12(8):1945, doi: [: 10.3390/agronomy12081945].
Sarkar S., Ramsey A.F., Cazenave A. B., and Balota M.. 2021b. Peanut leaf wilting estimation from RGB color indices and logistic models. Front. Plant. Sci. 18 June 2021. doi.: [: 10.3389/fpls.2021.658621].
Sarkar S., Cazenave A.-B., Oakes J., McCall D., Thomason W., Abbott L., and Balota M.. 2020. High-throughput measurement of peanut canopy height using digital surface models (DSMs). The Plant Phenome J. 3(1): e20003. doi: [: 10.1002/ppj2.20003].
Sastry D.V.S.S.R., Upadhyaya H.D., and Gowda C.L.L.. 2007. Survival of groundnut seeds under different storage conditions. J. SAT Agric. Res. 5(1):1-3.
Seaton M.I., Coffelt T.A., and Van Scoyoc S.W.. 1992. Comparison of vegetative and reproductive traits of 14 peanut cultivars. Oleagineux. 47:471-474.
Selbeck J., Dworak V., and Ehlert D.. 2010. Testing a vehicle-based scanning lidar sensor for crop detection. Can. J. Remote Sens. 36(1):24-35. doi: [: 10.5589/m10-022].
Sène M., Doré T., and Pellissier F.. 2000. Effect of phenolic acids in soil under and between rows of a prior sorghum (Sorghum bicolor) crop on germination, emergence, and seedling growth of peanut (Arachis hypogea). J. Chem. Ecol. 26:625-637. doi: [: 10.1023/A:1005420020135].
Serbin S.P., Dillaway D.N., Kruger E.L., and Townsend P.A.. 2012. Leaf optical properties reflect variation in photosynthetic metabolism and its sensitivity to temperature. J. Exp. Bot. 63:489–502. doi: [: 10.1093/jxb/err294].
Shekoofa A., Balota M., and Sinclair T.R.. 2014. Limited-transpiration trait evaluated in growth chamber and field for sorghum genotypes. Environ. Exp. Botany. 99:175-179.
Shekoofa A., Devi J.M., Sinclair T.R., Holbrook C.C., and Isleib T.G.. 2013. Divergence in drought-resistance traits among parent of recombinant peanut inbred lines. Crop Sci. 53:2569-2573.
Shekoofa A., Rosas-Anderson P., Sinclair T.R., Balota M., and Isleib T.G.. 2015a. Measurement of limited-transpiration under high vapor pressure deficit for peanut in chambers and in field. Agronomy J. 107:1019-1024.
Shekoofa A., Sinclair T.R., Messina C.D., and Cooper M.. 2015b. Variation among maize hybrids in response to high vapor pressure deficit at high temperature. Crop Sci. 55:392-396.
Sheshshayee M.S., Bindunadhava H., Rachaputi N. R., Prasad T.G., Udayakumar M., Wright G.C., and Nigam S.N.. 2006. Leaf chlorophyll concentration relates to transpiration efficiency in peanut. Ann. Appl. Biol. 148:7-15.
Shew B., and Beute M.. 1984. Effects of crop management on the epidemiology of southern stem rot of peanut. Phytopathology. 74:530-535.
Shinde A.K., Bodare A.H., Jadhav B.B., and Shelke R.N.. 2012. Physiological studies on effect of packaging material for storage of groundnut (Arachis hypogaea L.) pods. J. Agric. Res. Technol. 37(3):447-453.
Sie E.K., Oteng-Frimpong R., Kassim Y.B., Puozaa D.K., Adjebeng-Danquah J., Masawudu A.R., Ofori K., Danquah A., Cazenave A.B., Hoisington D., Rhoads J., and Balota M.. 2022. RGB-image method enables indirect selection for leaf spot resistance and yield estimation in a groundnut breeding program in Western Africa. Front. Plant Sci. 13:901561. doi: [: fpls.2022.957061].
Silva M.F.C., Silva C.R.C., Lima L.M., Santos R.C., and Ramos J.P.C.. 2017. Differential expression of dormancy-associated genes in fastigiata and hypogaea peanut. Gen. Mol. Res. 16:gmr16039820. doi: [: 10.4238/gmr16039820].
Silva-Perez V., Molero G., Serbin S.P., Condon A.G., Reynolds M.P., Furbank R.T., and Evans J.R.. 2017. Hyperspectral reflectance as a tool to measure biochemical and physiological traits in wheat. J. Exp. Bot. 69(3):483–496. doi: [: 10.1093/jxb/erx421].
Sinclair T.R. 2011. Challenges in breeding for yield increase for drought. Trends Plant Sci. 16:289-293.
Sinclair T., Devi J., Shekoofa A., Choudhary S., Sadok W., Vadez V., Riar M., and Rufty T.. 2017. Limited transpiration response to high vapor pressure deficit in crop species. Plant Sci. 260:109-118.
Sinclair T.R., Shekoofa A., Isleib T.G., Balota M., and Zhang H.. 2018. Identification of virginia-type peanut genotypes for water-deficit conditions based on early decrease in transpiration rate with soil drying. Crop Sci. 58:2607-2612. doi: [: 10.2135/cropsci2018.05.0293].
Sinclair T.R., Zwieniecki M.A., and Holbrook N.M.. 2008. Low leaf hydraulic conductance associated with drought tolerance in soybean. Physiol. Plant. 132:446–451. doi: [: 10.1111/j.1399-3054.2007.01028.x].
Singh D., Balota M., Isleib T.G., Collakova E., and Welbaum G.E.. 2014. Suitability of canopy temperature depression, specific leaf area, and SPAD chlorophyll reading for genotypic comparison of peanut grown in a sub-humid environment. Peanut Sci. 41:100-110. doi: [: 10.3146/PS13-11.1].
Singh B., Mai-Kodomi Y., and Terao T.. 1999. Relative drought tolerance of major rainfed crops in semi-arid tropics. Indian J. Genetics Plant Breeding. 59:437-444.
Smith J.S., Jr., Sanders T.H., and Crippen K.L.. 1989. Storability of farmer stock peanuts at two moisture levels in mechanically and naturally ventilated miniature warehouses. Peanut Sci. 16(1):58-62. doi: [: 10.3146/i0095-3679-16-1-14].
Smith O.D., and Simpson C.E.. 1995. Selection of peanut cultivars. pgs 19-23, In: Melouk H.A. and Shokes F.M. (eds). Peanut Health Management. APS Press, St. Paul, MN.
Soba D., Parker S., Chen C., Shekoofa A., and Sanz-Saez A.. 2024. Peanut photosynthesis response to drought can include difussive and biochemical limitations depensing on cultivar. Physiologia Plantarum. 176:e14489, doi: [: 10.1111/ppl.14489].
Sobolev V.S., Neff S.A., and Gloer J.B.. 2010. New dimeric stilbenoids from fungal-challenged peanut (Arachis hypogea) seeds. J. Agric. Food Chem. 58:875-881. doi: [: 10.1021/jf903410e].
Songsri P., Jogloy S., Kesmala T., Vorasoot N., Akkasaeng C., Patanothai A., and Holbrook C.C.. 2008. Heritability of drought resistance traits and correlation of drought resistance and agronomic traits in peanut. Crop Sci. 48:2245-2253.
Sorensen R.B., Lamb M.C., and Butts C.L.. 2015. Can peg strength be used as a predictor for pod maturity and peanut yield? Peanut Sci. 42(2):92-99. doi: [: 10.3146/0095-3679-42.2.92].
Spears J.F. 2000. Germination and vigor response to seed maturity, weight, and size within the Virginia-type cultivar VA-C 92R. Seed Technology. 22:23-33.
Spears J.F. 2002. Peanut seed production guide for producers of Virginia type peanut seed. North Carolina Coop. Ext. Serv.NC State Univ.
Srinivasan A., Takeda H., and Senboku T.. 1996. Heat tolerance in food legume as evaluated by cell membrane thermostability and chlorophyll fluorescence techniques. Euphytica. 88:35-45.
Steele J.L. 1983. Germination of direct harvested peanut seed. Trans. ASAE. 26:1239-1244. doi: [: 10.13031/2013.34110].
Stinziano J.R., McDermitt D.K., Lynch D.J., Saathoff A.J , Morgan P.B., and Hanson D.T.. 2019. The rapid A/Ci response: a guide to best practices. New Phytologist. 221:625-627.
Stockle C.O., Martin S.A., and Campbell G.S.. 1994. CropSyst, a cropping system simulation model: water/nitrogen budgets and crop yield. Agric. Syst. 46:335-359.
Suleiman A.A., Tojo Soler C.M., and Hoogenboom G.. 2013. Determining FAO-56 crop coefficients for peanut under different water stress levels. Irrig. Sci. 31:169-178.
Sun S., Li C., and Paterson A.. 2017. In-field high-throughput phenotyping of cotton plant height using LiDAR. Remote Sensing. 9(4):377. doi: [: 10.3390/rs9040377].
Suriharn B., Patanothai A., Boote K.J., and Hoogenboom G.. 2011. Designing a peanut ideotype for a target environment using the CSM-CROPGRO-Peanut model. Crop Sci. 51(5):1887-1902. doi: [: 10.2135/cropsci2010.08.0457].
Suriharn B., Patanothai A., Pannangpetch K., Jogloy S., and Hoogenboom G.. 2008. Yield performance and stability evaluation of peanut breeding lines with the CSM-CROPGRO-Peanut model. Crop Sci. 48(4):1365-1372. doi: [: 10.2135/cropsci2007.09.0523].
Swamy P.M., and Sandhyarani C.K.. 1986. Contribution of the pentose phosphate pathway and glycolytic pathway to dormancy breakage and germination of peanut (Arachis hypogaea L.) seeds. J. Exper. Bot. 37:80-88. doi: [: 10.1093/jxb/37.1.80].
Taiz L., Zeiger E., Moller I.M., and Murphy A.. 2014. Water balance of plants. In Physiology Plant and , 6th edition, Oxford University Press, New York, NY, USA.
Tallury S.P., Isleib T.G., Copeland S.C., Anderson P.R., Balota M., Singh D., and Stalker H.T.. 2014. Registration of two multiple disease-resistant peanut germplasm lines derived from Arachis cardenasii Krapov. & W.C. Gregory, GKP 10017 (PI 262141). J. Plant Reg. 8:86-89.
Talwar H.S., and Yanagihara S.. 1999. Physiological basis for heat tolerance during flowering and pod setting stages in groundnut (Arachis hypogaea L.). JIRCAS Working Report No. 14. pp. 47-65. JIRCAS. Okinawa, Japan.
Tang Y.Y., Wang C.T., Yang G.P., Feng T., Gao H.Y., Wang X.Z., Chi X.Y., Xu Y.L., Wu Q., and Chen D.X.. 2011. Identification of chilling-responsive transcripts in peanut (Arachis hypogaea L.). Electron. J. Biotechnol. 14:1-13. https://scielo.conicyt.cl/scielo.php?script=sci_arttext&pid=S0717-34582011000500005&lng=en.
Tanner C.B., and Sinclair T.R.. 1983. Efficient water use in crop production: research or re-search? pgs 1-27. In H. Taylor M., Jordan W.R., and Sinclair T. R. (eds). Limitations to Efficient Water Use in Crop Production; ASA-CSSA-SSSA, Madison, WI, USA.
Tester M., and Langridge P.. 2010. Breeding technologies to increase crop production in a changing world. Science. 327:818-822.
Thangthong N., Jogloy S., Jongrungklang N., Kvien C.K., Pensuk V., Kesmala T., and Vorasoot N.. 2016. Distribution patterns of peanut roots under different durations of early season drought stress. Field Crops Res. 198:40–49. doi: [: 10.1016/j.fcr.2016.08.019].
Tsuji G.Y., Uchara G., and Balas S.. 1994. DSSAT. International Benchmark Sites Network for Agrotechnology Transfer, version 3 vol. 2University of HawaiiHonolulu.
Turner N.C., Schulze E.D., and Gollan T.. 1985. The response of stomata and leaf gas exchange to vapor pressure deficits and soil water content II. In the mesophytic herbaceous species Helianthus annuus. Oecologia. 65:348-355.
Upadhyaya H.D. 2005. Variability for drought tolerance related traits in the mini core collection of peanut. Crop Sci. 45:1432-1440.
USDA, U.S. Department of Agriculture, National Agricultural Statistics Service. 2019. Agricultural Statistics. U.S. Government Printing Office. Washington, DC. 20190215, from https://quickstats.nass.usda.gov/.
USDA-ARS, U.S. Department of Agriculture – Agricultural Research Service. 2005. Growing peanut for science project. Washington D.C., https://www.ars.usda.gov/southeast-area/dawson-ga/national-peanut-research-laboratory/docs/student-science-project/ 2019Nov.
USGS, U.S. Geological Survey. 2018: Kilauea Volcano, HI June 2018 Acquisition airborne LiDAR survey. U.S. Geological Survey (USGS) in collaboration with GEO1, Windward Aviation, Quantum Spatial, and Cold Regions Research and Engineering Laboratory, distributed by OpenTopography. doi: [: 10.5069/G98K7718].
Vadez V., and Ratnakumar P.. 2016. High transpiration efficiency increases pod yield under intermittent drought in dry and hot atmospheric conditions but less so under wetter and cooler conditions in groundnut (Arachis hypogaea L.). Field Crops Res. 193:16–23. doi: [: 10.1016/j.fcr.2016.03.001].
Vasanthi R.P., Suneetha N., and Sudhakar P.. 2015. Genetic diversity based on physiological attributes among released and pre-release cultures of groundnut (Arachis hypogaea L.). Legume Res. 38(1):47-50. doi: [: 10.5958/0976-0571.2015.00008.9].
Vincent C., Rowland D.L., Schaffer B., Bassil E., Racette K., and Zurweller B.. 2020. Primed acclimation: a physiological process offers a strategy for more resilient and irrigation-efficient crop production. Plant Sci. 295:110240. doi: [: 10.1016/j.plantsci.2019.110240].
Virlet N., Sabermanesh K., Sadeghi-Tehran P., and Hawkesford M.J.. 2017. Field Scanalyzer: An automated robotic field phenotyping platform for detailed crop monitoring. Functional Plant Biol. 44(1):143. doi: [: 10.1071/fp16163].
Virk G., Pilon C., and Snider J.L.. 2019. Impact of first true leaf photosynthetic efficiency on peanut plant growth under different early-season temperature conditions. Peanut Sci. 46:162-173. doi: [: 10.3146/PS19-8.1].
Vishwakarma M.K., Pandey M.K., Shasidhar Y., Manohar S.S., Nagesh P., Jahnila P, and Varshney R.K.. 2016. Identification of two major quantitative loci for fresh seed dormancy using the diversity arrays technology and diversity arrays technology-seq based genetic map in Spanish-type peanuts. Plant Breed. 135:367-375. doi: [: 10.1111/pbr.12360].
Wallace L., Lucieer A., Malenovský Z., Turner D., and Vopěnka P.. 2016. Assessment of forest structure using two UAV techniques: A comparison of airborne laser scanning and structure from motion (SfM) point clouds. Forests. 7(3):62. doi: [: 10.3390/f7030062].
Walters C., and Engels J.. 1998. The effect of storing seeds under extremely dry conditions. Seed Sci. Res. 8(1,Supplement 1):3-8.
Wang Z., Huai D., Zhang Z., Cheng K., Kang Y., Wan L., Yan L., Jiang H., Lei Y., and Liao B.. 2018. Development of a high-density genetic map based on specific length amplified fragment sequencing and its application in quantitative trait loci analysis for yield-related traits in cultivated peanut. Front. Plant Sci. 9:826, doi: [: 10.3389/fpls.2018.00827].
Weaver C.C., Monfort W.S., Grey T.L., Pilon C., and Tubbs R.S.. 2021. Effect of post shelling storage environments on seed germination and vigor of peanut. Agron. J. 113:4116-4131, doi: [: 10.1002/agj2.20795].
Weber V.S., Araus J.L., Cairns J.E., Sanchez C., Melchinger A.E., and Orsini E.. 2012. Prediction of grain yield using reflectance spectra of canopy and leaves in maize plants grown under different water regimes. Field Crops Res. 128:82–90. doi: [: 10.1016/j.fcr.2011.12.016].
Williams J.H., and Boote K.J.. 1995. Physiology and modeling predicting the "unpredictable legume," pp. 301-354. In Pattee H.E. and Stalker H.T. (eds.) Advances in Peanut Science. Amer. Peanut Res. Educ. Soc., Stillwater, OK.
Williams E.J., and Drexler J.S.. 1981. A non-destructive method for determining peanut maturity. Peanut Sci. 8:134-141. doi: [: 10.3146/i0095-3679-8-2-15].
Williams J.H., Phillips T.D., Jolly P.E., Stiles J.K., Jolly C.M., and Aggarwal D.. 2004. Human aflatoxicosis in developing countries: a review of toxicology, exposure, potential health consequences, and interventions. Am. J. Clin. Nutr. 80(5):1106-1122.
Wood I. M. W. 1968. The effect of temperature at early flowering on the growth and development of peanuts (Arachis hypogaea). Australian J. Agric. Res. 19:241-251.
Wright G.C., Hubick K.T., Farquhar G.D., and Rao N.. 1993. Genetic and environmental variation in transpiration efficiency and its correlation with carbon isotope discrimination and specific leaf area in peanut, pp. 247-267. In Ehleringer J.R., Hall A.E., and Farquhar G.D. (eds.), Stable Isotopes and Plant Carbon-Water Relations. Academic Press, Inc., San Diego, CA, USA. doi: 10.1016/B978-0-08-091801-3.50025-8.
Wu Y.Z., Huang M.B., and Gallichand J.. 2011a. Transpirational response to water availability for winter wheat as affected by soil textures. Agric. Water Management. 98:569-76. doi: [: 10.1016/j.agwat.2010.10.015].
Wu Z., Song L., and Huang D.. 2011b. Food grade fungal stress on germinating peanut seeds induced phytoalexins and enhanced polyphenolic antioxidants. J. Agric. Food Chem. 59:5993-6003. doi: [: 10.1021/jf200776w].
Yang C., Huang Q., Li Z., Liu K., and Hu F.. 2017. Big data and cloud computing: innovation opportunities and challenges. Internl. J. Digital Earth. 10(1):13–53. doi: [: 10.1080/17538947.2016.1239771].
Yang G., Liu J., Zhao C., Li Z., Huang Y., Yu H., Xu B., Yang X., Zhu D., Zhang X., Zhang R., Feng H., Zhao X., Li Z., Li H., and Yang H.. 2017. Unmanned aerial vehicle remote sensing for field-based crop phenotyping: current status and perspectives. Front. Plant Sci. 8:1111. doi: [: 10.3389/fpls.2017.01111].
Yendrek C.R., Tomaz T., Montes C.M., Cao Y., Morse A.M., Brown P.J., McIntyre L.M., Leakey A.D.B., and Ainsworth E.A.. 2017. High-throughput phenotyping of maize leaf physiological and biochemical traits using hyperspectral reflectance. Plant Physiol. 173:614-626. doi: [: 10.1104/pp.16.01447].
Yin X., McClure M.A., Jaja N., Tyler D.D., and Hayes R.M.. 2011. In-season prediction of corn yield using plant height under major production systems. Agron. J. 103:923-929.
York L.M., Galindo-Castañeda T., and Schussler Lynch J.P.. 2015. Evolution of US maize (Zea mays L.) root architectural and anatomical phenes over the past 100 years corresponds to increased tolerance of nitrogen stress. J. Exp. Bot. 66:8. doi: [: 10.1093/jxb/erv074].
Yuan G., Wang X., Guo R., and Wang Q.. 2010. Effect of salt stress on phenolic compounds, glucosinolates, myrosinase and antioxidant activity in radish sprouts. Food Chem. 121:1014-1019. doi: [: 10.1016/j.foodchem.2010.01.040].
Yuan H., Bennett R.S., Wang N., and Chamberlin K.D.. 2019. Development of a peanut canopy measurement system using a ground-based LiDAR sensor. Front. Plant Sci. 10:203. doi: [: 10.3389/fpls.2019.00203].
Yuan H., Wang N., Bennett R.S., Burditt D., Cannon A., and Chamberlin K.D.. 2018. Development of a ground-based peanut canopy phenotyping system. IFAC-PapersOnLine 51(17):162-165. doi: [: 10.1016/j.ifacol.2018.08.081].
Yuan H., Song M., Liu Y., Xie Q., Cao W., Zhu Y. and Ni J., 2023. Field phenotyping monitoring systems for high-throughput: A survey of enabling technologies, equipment, and research challenges. Agronomy. 13(11):2832.
Zerbato C., Furlani C.E.A., Ormond A.T.S., Silva Girio L.A., Carneiro F.M., and Silva R.P.. 2017. Statistical process control applied to mechanized peanut sowing as a function of soil texture. PLoS ONE. 12(7):e010399. doi: [: 10.1371/journal.pone.0180399].
Zhang H., Dong J., Zhao X., Zhang Y., Ren J., Xing L., Jiang C., Wang X., Wang J., Zhao S., and Yu H.. 2019a. Research progress in membrane lipid metabolism and molecular mechanism in peanut cold tolerance. Front. Plant Sci. 10:838.
Zhang H., Wang M.L., Schaefer R., Dang P., Jiang T., and Chen C.. 2019b. GWAS and coexpression network reveal ionomic variation in cultivated peanut. J. Agric. Food Chem. 67:12023-12036. doi: [: 10.1021/acs.jafc.9b04939].
Zhang Q, Chen C, Feng Y, Batchelor W, Dang P, Lamb M, Sanz-Saez A. 2022. Tolerance to mid-season drought in peanut can be achieved by high water use efficiency or high efficient use of water. Crop Sci. 62: 1948-1966. doi: [: 10.1002/csc2.20806].
Zhao C.X., Jia L.H., Wang Y.F., Wang M.L., and McGiffen Jr. M.E. 2015. Effects of different soil texture on peanut growth and development. Comm. Soil Sci. Plant Analysis. 46(18):2249-2257.
Zheng Y.P., Liang X.Y., Wang C.B., Zheng J.Q., Wan S.B., Zheng Y.M., Wang T.L., and Liu Q.M.. 2012. Growth and physiology characteristics of peanut on different soils. Chinese J. Oil Crop Sci. 34:496-501.
Zhou J., Reynolds D., Cornu T.L., Websdale D., Orford S., Lister C., Gonzalez-Navarro O., Laycock S., Finlayson G., Stitt T., Clark M.D., Bevan M.W., and Griffiths S.. 2017. CropQuant: An automated and scalable field phenotyping platform for crop monitoring and trait measurements to facilitate breeding and digital agriculture. BioRxiv. [: 161547]:1-41. doi: [: 10.1101/161547].
Zurweller B. A., Rowland D. L., Tillman B. L., Payton P., Erickson J., Racette K., and Carter E.. 2022. Soil water depletion of peanut subspecies as influenced by water-use traits and soil water availability. J. Agron. and Crop Sci. 208:928–940. doi: [: 10.1111/jac.12554].
Zurweller B.A., Rowland D.L., Tillman B.L., Payton P., Migliaccio K., and Wright D.. 2018a. Assessing above- and below-ground traits of disparate peanut genotypes for determining adaptability to soil hydrolic conditions. Field Crops Res. 219:98-105.
Zurweller B.A., Xavier A., Tillman B.L., Mahan J.R., Payton P.R., Puppala N., and Rowland D. L.. 2018b. Pod yield performance and stability of peanut genotypes under differing soil water and regional conditions. J. Crop Improvement. 32(4):532–551. doi: [: 10.1080/15427528.2018.1458674].
Notes
- Professor, Tidewater Agricultural Research and Extension Center, Virginia Polytechnic Institute and State University, Suffolk, VA 23437 [^]
- Adjunct Professor, Agricultural and Biological Engineering Department, University of Florida, Gainesville, FL, 32611; Professor Emeritus Agronomy [^]
- Research Food Technologist, Market Quality and Handling Unit, USDA, ARS, SEA, Raleigh NC 27695 [^]
- Associate Professor, Department of Crop, Soil, and Environmental Sciences, Auburn University, Auburn, AL, 36849 [^]
- Associate Professor, Department of Crop and Soil Sciences, University of Georgia, Tifton, GA, 31793 [^]
- Product Development Scientist, Bayer Crop Science, Rosemount, MN 55068 [^]
- Assistant Professor, Plant and Soil Sciences Department, Mississippi State University, Mississippi State, MS, 39762 [^]
- Vice President for Commercial Research and Development, Goanna Ag, Lubbock, TX, 79407 [^]