

Introduction
The United States is the world's third largest producer of edible peanuts (Arachis hypogaea L.), behind China and India. In 2023, the U.S. harvested 636,315 hectares with an average yield of 4,192 kg/ha for a total in-shell production of 2.67 million metric tons (National Agricultural Statistics Service, 2024). U.S. peanuts are produced in three major regions consisting of the Southeast (Alabama, Florida, Georgia, Mississippi, South Carolina), Southwest (New Mexico, Oklahoma, Texas, Missouri, Louisiana), and Virginia-Carolina (North Carolina, Virginia). There are four different commercial peanut market types (runner, Spanish, Valencia, and Virginia), each with distinguishing characteristics related to final product use. Runner peanuts comprise approximately 80% of U.S. production, are grown primarily in the Southeast region, and primarily used for producing peanut butter. The Spanish type, which accounts for about 4% of total U.S. production, is primarily used in the production of peanut snacks, with the majority produced in Texas and Oklahoma. Valencia peanuts represent about 1% of U.S. production and are produced in New Mexico and Texas, and mostly used as roasted or boiled in-shell. Virginia peanuts comprise 15% of U.S. production and are produced in Virginia, North Carolina, South Carolina, and Texas. The primary use of Virginia peanuts is roasted in-shell (Agricultural Marketing Resource Center, 2024).
The U.S. peanut supply chain is unique compared to most commodities in that peanuts are delivered from the field in-shell (farmer stock) and must undergo further processing to remove the shell and then size peanut kernels (shelled stock) specific to final use. At harvest, farmer stock peanuts are delivered to peanut buying points. Peanut buying points are strategically located in the peanut producing regions for efficiency related to farmer stock peanut transport and represent the first point of consolidation within these smaller geographic regions. Buying point functions include cleaning, drying, grading, and storing peanuts. All farmer stock peanuts must be inspected following strict guidelines mandated by the USDA Agricultural Marketing Service and conducted by trained Federal State Inspection Service (FSIS) inspectors located at each buying point (Archer, 2016) to determine quality factors of farmer stock peanuts. Farmer stock peanuts are then stored in specially designed warehouses until they are delivered to shelling facilities for further processing. The basic function of peanut shelling is to remove peanut hulls from kernels and size peanuts into specified commercial market grades.
While inspection at the buying points focuses on the physical characteristics of the peanuts (Cowart et al. 2016), our focus in this analysis is to provide an evaluation of other factors, specifically the presence, if any, of pesticide residues in the U.S. peanut crop.
U.S. peanut growers use a variety of pesticides at various stages of production. These include herbicides such as glyphosate and 2,4-D used during preplant burndown, 2,4-DB used post planting, Fusilade (fluazifop-P-butyl) and Select (clethodim) as postemergence annual grass control; fungicides including Propulse (fluopyram and prothioconazole)) and Lucento (fluatrifol and bixafen); nematicides such as Velum (fluopyram) and Propulse; and a wide variety of insecticides including Brigade (bifenthrin) and Asana (esfenvalerate) (University of Georgia Extension, 2024).
The mere presence of pesticide residues does not necessarily imply that the food is unsafe. The toxicity of a particular pesticide residue depends on a risk assessment which accounts for the amount of the residue present, the degree of exposure, consumption patterns, and the pesticide’s toxicology (US Environmental Protection Agency, 2000). Most developed economies have their own determination of what level of residues are deemed unsafe.
In the United States, the EPA sets a maximum legal residue limit (MRL) or tolerance for each residue for each treated food. The pesticide residue tolerances apply to food grown in the U.S. and imported food. In setting the MRL for pesticide use, the EPA uses a "reasonable certainty of no harm" safety threshold which considers the toxicity of the pesticide directly, the toxicity of its breakdown products, how much of the pesticide is applied and how often, and how much of the pesticide residue remains in or on food by the time it is marketed (EPA.gov, 2024).
Internationally, since 2008, the European Union (EU) has established MRL standards that facilitate trade within the EU and imports into the EU (European Communities, 2008). In addition to MRLs, the European Chemicals Agency (ECHA) has derived a set of safety standards that take into account the consumption pattern of foods that may have pesticide residues. The acceptable daily intake (ADI) provides an estimate of the amount of a substance in food or drinking water that can be consumed per day “over a lifetime without presenting an appreciable risk to health.” (WHO, 1987 as cited by ECHA, 2016). The acute reference dose (ARfD) provides an estimate of the amount of a substance in food or drinking water that can be ingested over a short period of time, e.g., one meal or one day, without appreciable health risk to the consumer (JMPR, 2002 as cited by ECHA, 2016). Both standards are expressed in terms of body weight, e.g., milligrams per kilogram of body weight per day.
Empirical studies that examine the presence of pesticide residues on foodstuffs and provide an associated risk assessment are wide-ranging, encompassing many different types of crops, various chemical residues, and several different geographic regions. Most of these studies share a common methodology in the testing for residues as well as their risk assessments. These risk assessments typically involve using the ARfD to measure acute exposure health risk and the ADI to measure chronic exposure health risk.
The research presented here has two main objectives. First, it would be instructive to provide descriptive statistics for the level of pesticide residues detected in the test results. However, due to the high degree of censoring, estimates of the descriptive statistics can be misleading. Instead, we present 95% confidence intervals for the probability that the residue would be detected in another random sample of peanuts. Second, based on internationally accepted safety standards and accepted methodologies, we estimate short-term and long-term health exposure risk assessments for consumers of peanuts.
Materials and Methods
The study was conducted during the 2020-2022 crop years at farmer stock delivery to peanut buying points. The laboratory samples were chosen during the farmer stock grading process at each buying point when peanuts are split for internal damage detection. At the end of the day, the FSIS samples used in the grading process were comingled and a randomly drawn 2-kg sample was removed for laboratory testing. These samples were sent to the Eurofins laboratory located in New Orleans for pesticide screening. To get a representative sample of U.S. peanut production, samples were selected from the three major growing regions, the Southeast (SE), Southwest (SW), and the Virginia, North Carolina, South Carolina (VC) region. Samples included all three major market types: runner (all regions), Virginia (SW and VC), and Spanish (SW only), drawn from buying point locations in nine states. The proportion of samples drawn from each region was chosen to represent, as closely as possible, that region’s percentage of total peanut acres and market types. Table 1 describes the sample selection in more detail. The following analysis assumes that the samples tested represent random samples of peanut production for each region and overall U.S. peanut production.
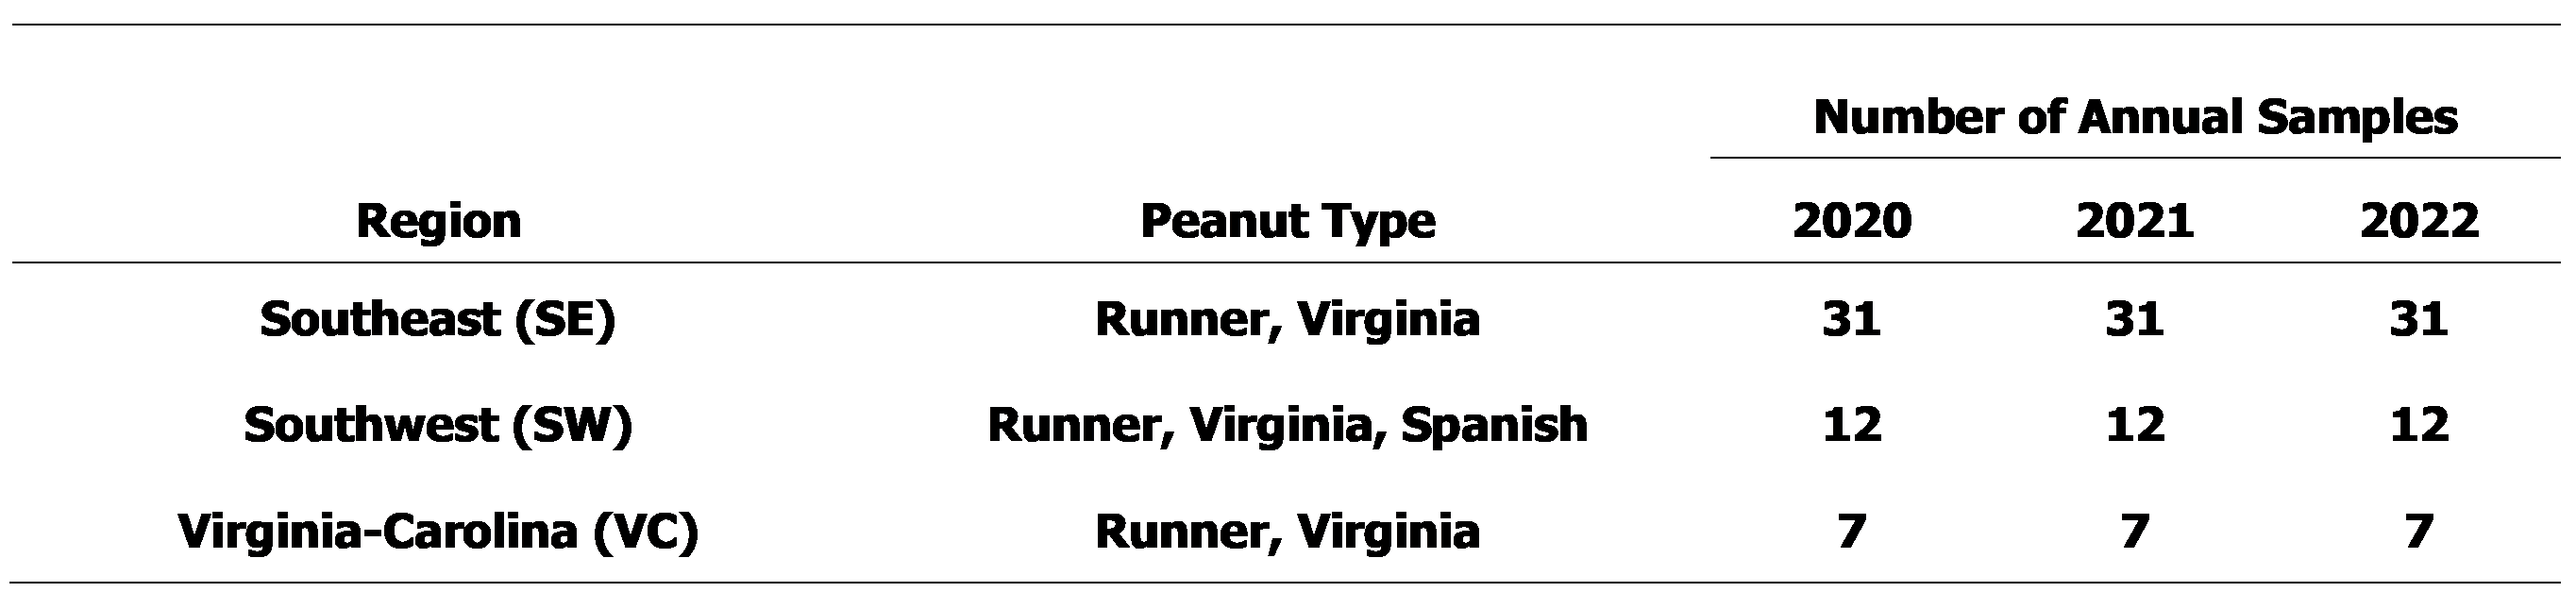
Peanut sampling plan for pesticide residue tests
Once at the Eurofins laboratory, each 2-kg sample was composited and homogenized. A representative sample was then taken for testing. Although testing packages varied from year to year, a common set of 537 pesticide residues was tested in each of the three years. Table 2 describes the Eurofins testing codes used and the associated analysis type.

Eurofins testing codes and analysis types
Even though extensive testing for pesticide residue was conducted, only the 14 residues described in Table 3 were detected. Each of these residue concentrations was below the European Union’s maximum residue limit for food safety. All other residues were undetectable given the detection limits of the testing equipment.
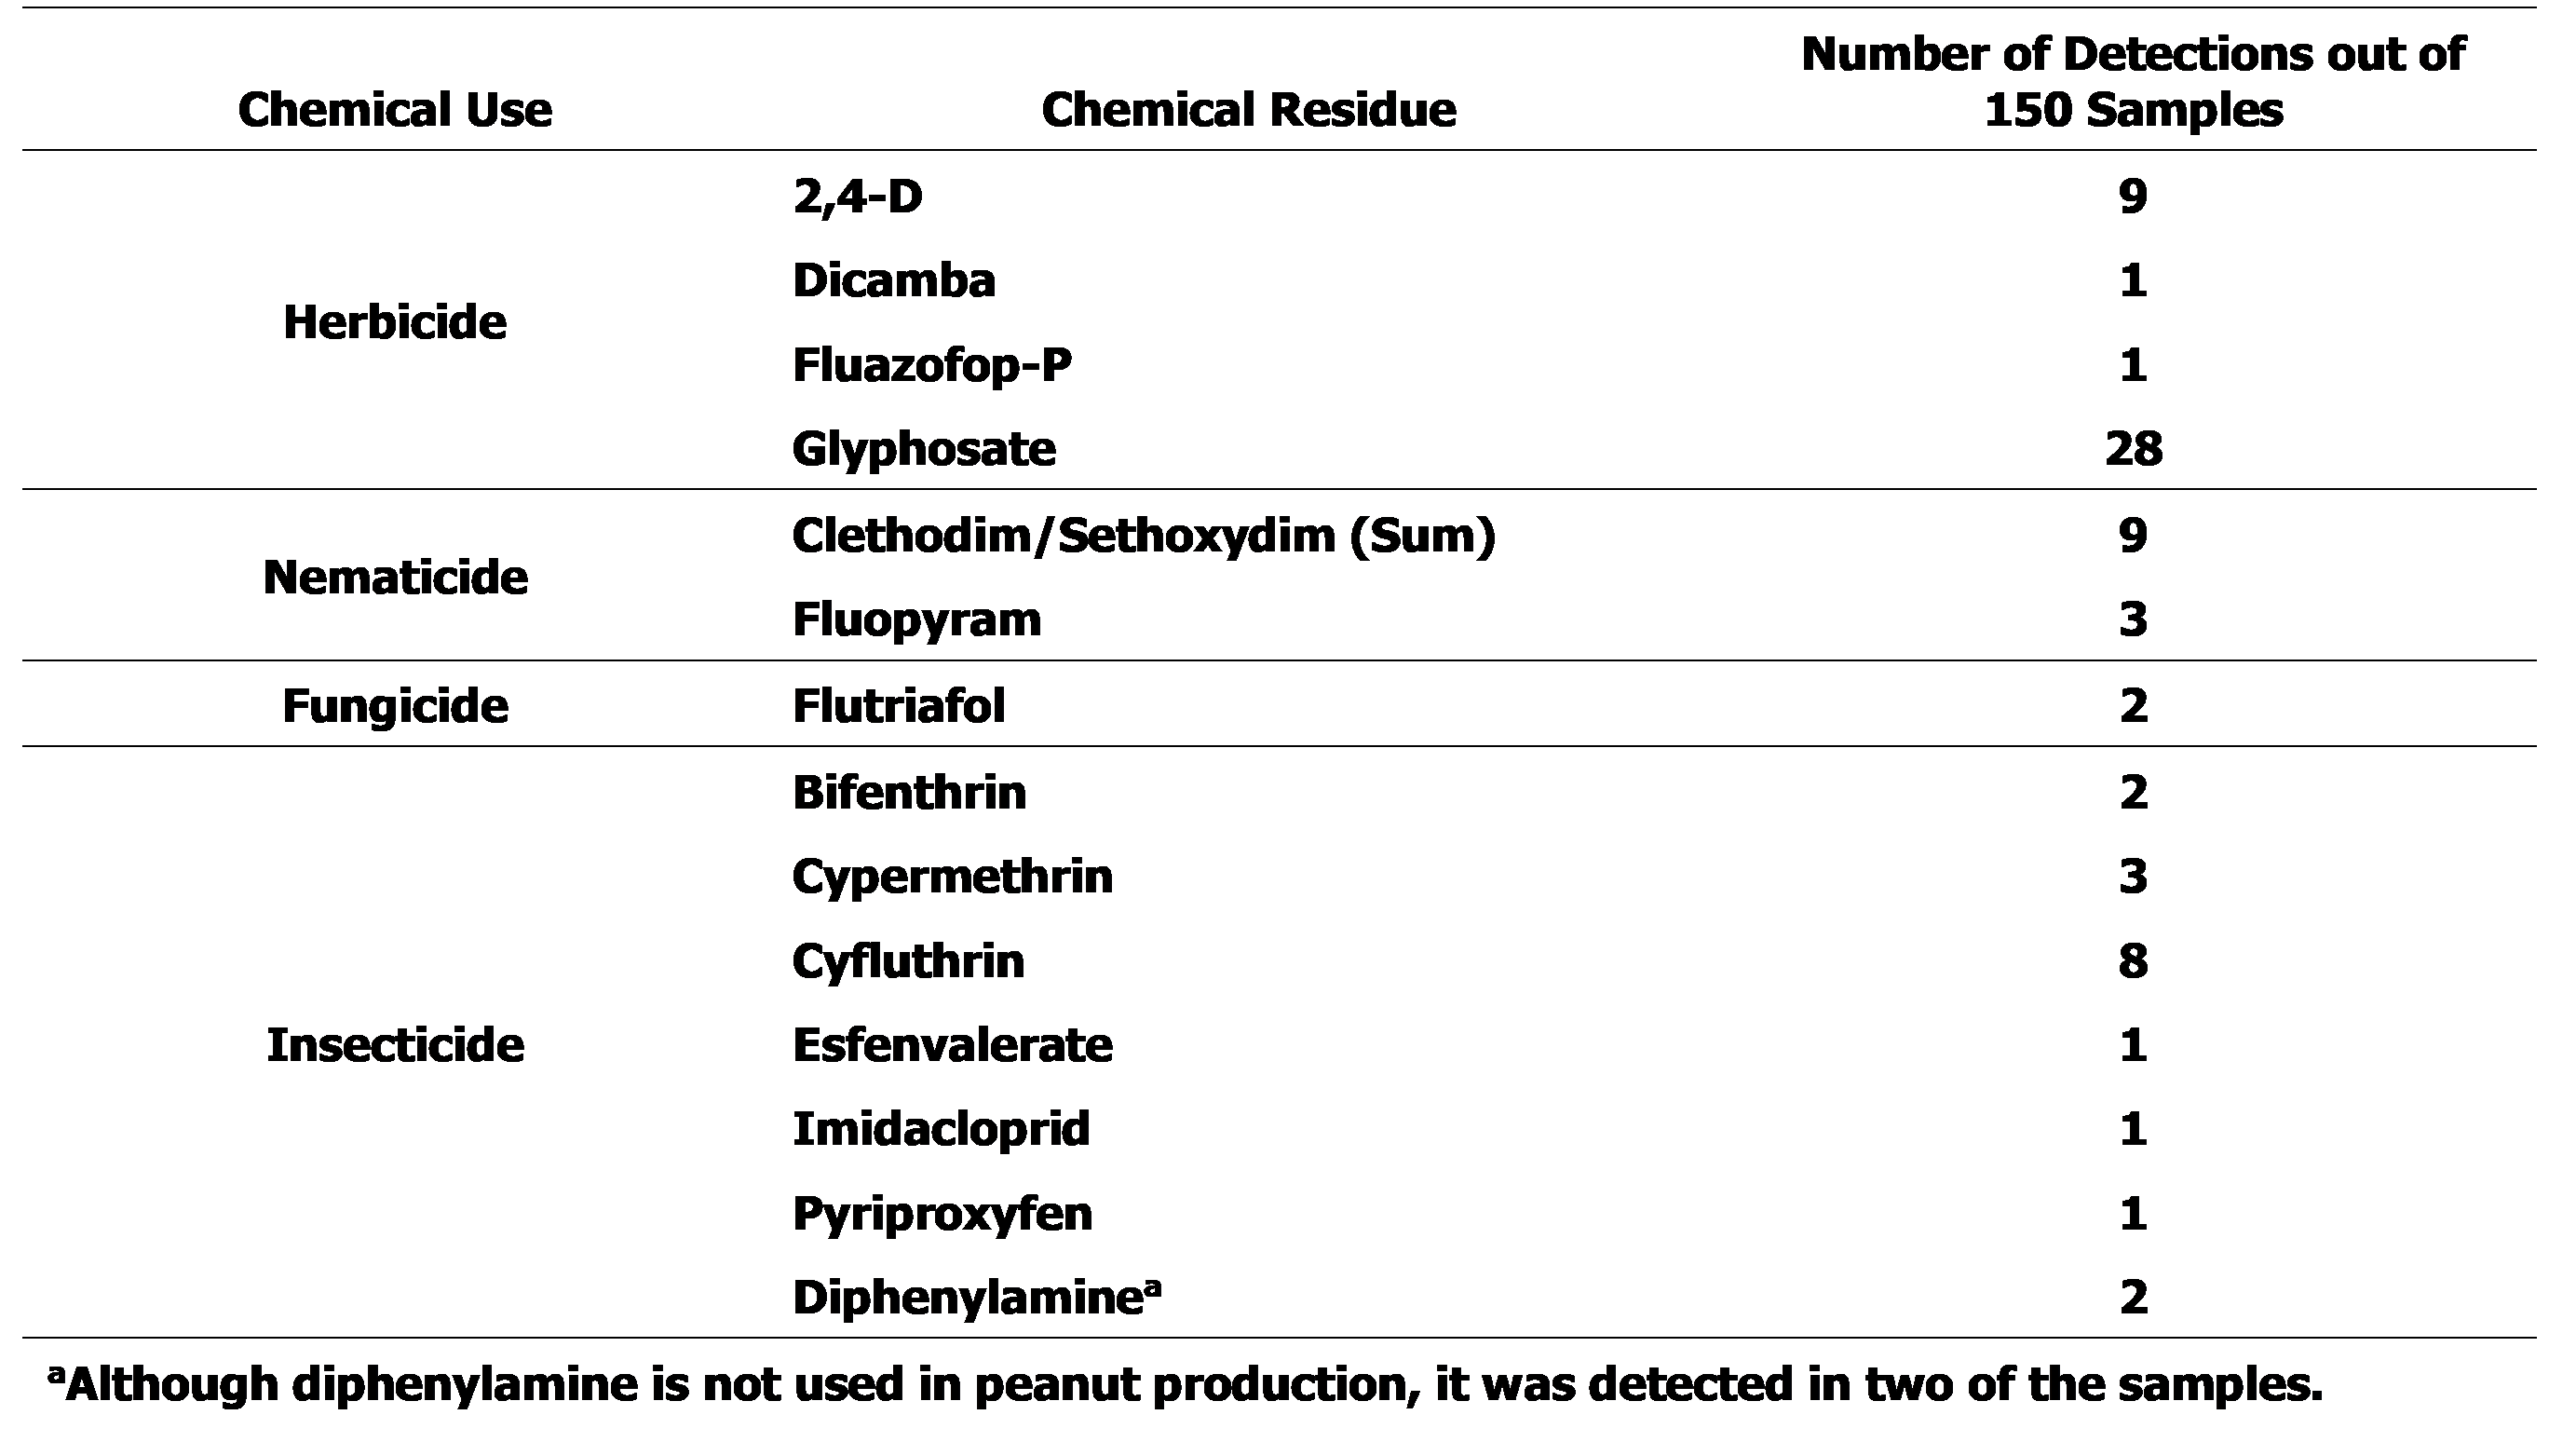
Pesticide residues detected in US peanut samples 2020-2022
Due to the high degree of censoring, estimates of descriptive statistics for the detected residues can be misleading. As a result, for each of the 14 residues that were detected, we instead focus on estimation of 95% confidence intervals for the probability that the residue would be detected in another random sample of peanuts. To do so we follow the methodology described in Helsel (2012), by first calculating the sample estimate for the proportion of the data below the detection limit for each residue, p=c/n, where c is the number of censored observations and n is the total number of observations. If not all test results censored, c<n, a 95% confidence interval around p is constructed as LL, UL where LL and UL are the lower limit and upper limit of the confidence interval given by

and

When all test results are censored, c=n, where LL and UL become

and UL=1. In each of these cases, the confidence interval for the proportion of test results above the detection limit can be constructed as [L, U] where L=1-UL and U=1-LL.
In addition to the probability confidence intervals, we also provide an assessment of the risks faced by consumers of peanuts due to the possibility of pesticide residues. To do so, we follow a methodology that has been used to assess pesticide residues on a wide variety of other agricultural products. Recent examples include the assessment of pesticide residues in samples of chestnuts, walnuts, and pine nuts produced in China (Liu et al., 2016), in dried nuts and fruits collected from bazaars and markets in Turkey (Aydin and Ulvi, 2019), and on vegetables commonly consumed in Mexico (Calderon, et al., 2022). The risk assessment consists of an acute or short-term health risk index, aHI, and a chronic or long term measure, also called the hazard quotient, HQ. Each of these measures are calculated for each pesticide residue detected. The measure of acute health risk is calculated as

where ESTI is an estimated short-term intake and is calculated for each residue as

and ARfD is the acute reference dose. The greater the value of aHI, the greater the short-term health risk, and an aHI>100 indicates an unacceptable short-term health risk.
The measure of chronic health risk commonly used in the literature is based on the average level of the residue in question. However, since we lack enough data to accurately measure the average, we instead calculate an upper limit of the mean, ULM, by replacing the censored values with the limit of detection. This results in an overestimation of the health risk posed. The measure of chronic risk presented here is calculated as

where EDI is an estimated daily intake and is calculated for each residue as

and where ADI is the acceptable daily intake. Basing our measure on the upper limit mean rather than the average level of the residue results in an upper limit of the estimated health risk posed. The greater the value of HQ, the greater the long-term health risk, and an HQ>100 indicates an unacceptable long-term health risk.
The ARfD and ADI values used in the above calculations are established jointly by the World Health Organization (WHO) and the Food and Agriculture Organization of the United Nations (FAO) by their Joint FAO/WHO Meeting on Pesticide Residues (JMPR) and compiled in the JMPR database (WHO, 2021).
Intuitively, each of the health risk indices measures the daily intake of a pesticide residue measured in milligrams per kilogram of bodyweight relative to safety consumption standards also measured in milligrams per kilogram bodyweight, either the amount that can safely be consumed in one day, the ARfD, or the amount that can be safely consumed over a lifetime, the ADI. If the amount consumed exceeds the safety standard, continued health may be at risk.
Results and Discussion
For each of the pesticide residues that were detected (see Table 3), we describe the sample data and the detection results for each of the three years included in the study and provide a confidence interval for the probability of selecting a sample in which the residue is undetectable. We then discuss the health risk assessment for each residue.
2,4-D
As shown in Figure 1, 2,4-D was only detected in 2020 in 9 of the 50 samples. In each of these cases, the detected concentration was below the EU MRL of 0.05 mg/kg. While 2,4-D is sometimes used as pre-plant burndown, another source of 2,4-D in these cases may be from off-target drift from applications in 2,4-D resistant cotton fields adjacent to peanut fields (University of Georgia Extension, 2024).
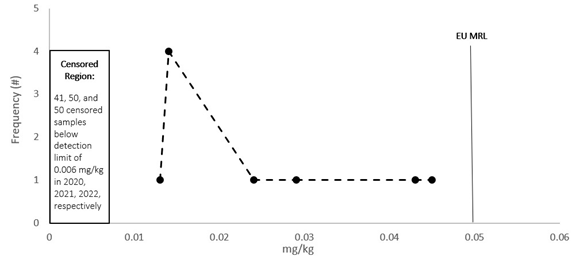
Figure 1. Frequency distribution of detected 2,4-D concentrations in 2020.
A 95% confidence interval for the probability of another sample testing positive for 2,4-D in 2020 is (0.086, 0.314). At a 95% confidence level, if another sample were taken in 2020, the likelihood of the sample testing positive for 2,4-D would be at most, 31.4%. In 2021 and 2022, the probability of residue detection is at most 5.8%. There is no evidence that 2,4-D residue would be detected at a level above the EU MRL in a sample chosen at random in any of the three years.
Glyphosate
As shown in Figure 2 below, Glyphosate was detected in some samples each year. In each of these cases, the detected concentration was at most one-half of the EU MRL of 0.1 mg/kg.
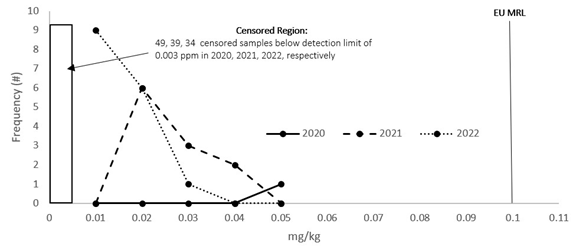
Figure 2. Frequency distribution of detected glyphosate concentrations, 2020 - 2022.
Glyphosate was detected once in 2020, eleven times in 2021, and 16 times in 2022. 95% confidence intervals for the probability of another sample testing positive for glyphosate are (0.001, 0.106), (0.115, 0.360), and (0.195, 0.467) in each of the years, respectively. At a 95% confidence level, if another sample were taken in each year, the likelihood of the sample testing positive for glyphosate would be at most, an 11% in 2020, 36% in 2022, and 47% in 2022. There is no evidence that glyphosate residue would be detected at a level above the EU MRL in a sample chosen at random in any of the three years.
Bifenthrin
As shown in Figure 3, bifenthrin was only detected in 2020 in 2 of the 50 samples. In each of these cases, the detected concentration was below the EU MRL of 0.02 mg/kg.
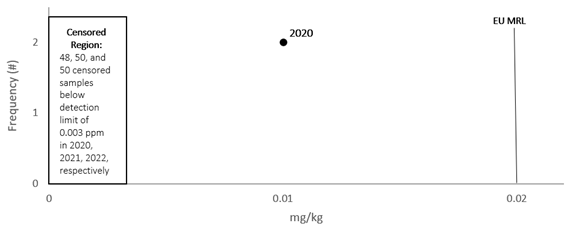
Figure 3. Frequency distribution of detected bifenthrin concentrations in 2020.
A 95% confidence interval for the probability of another sample testing positive for bifenthrin in 2020 is (0.005, 0.137). At a 95% confidence level, if another sample were taken in 2020, the likelihood of the sample testing positive for bifenthrin would be at most, 13.7%. In 2021 and 2022, the probability of residue detection is at most 5.8%. There is no evidence that bifenthrin residue would be detected at a level above the EU MRL in a sample chosen at random in any of the three years.
Dicamba
Dicamba was only detected in 2020 in 1 of the 50 samples. As illustrated in Figure 4, the detected concentration was below the EU MRL of 0.05 mg/kg. The 95% confidence interval for the probability of another sample testing positive for dicamba in 2020 is (0.001, 0.106). There is no evidence that dicamba residue would be detected at a level above the EU MRL in a sample chosen at random in any of the three years.
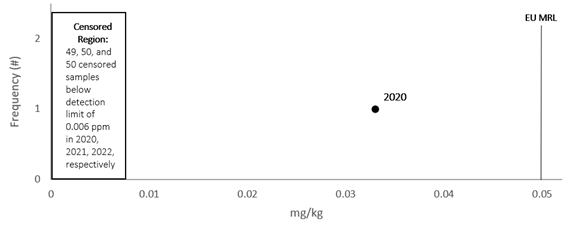
Figure 4. Frequency distribution of detected dicamba concentrations in 2020.
Imidacloprid
As illustrated in Figure 5, imidacloprid was only detected in 2021 in 1 of the 50 samples. The detected concentration was 1/50th of the EU MRL of 0.5 mg/kg. The 95% confidence interval for the probability of another sample testing positive for imidacloprid in 2021 is (0.001, 0.106). Imidacloprid was undetected in 2020 and 2022. There is no evidence that imidacloprid residue would be detected at a level above the EU MRL in a sample chosen at random in any of the three years.
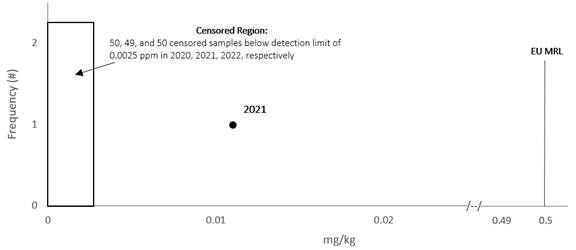
Figure 5. Frequency distribution of detected imidacloprid concentrations in 2021.
Diphenylamine
As shown Figure 6, diphenylamine was detected only in 2021 in 2 of the 50 samples, both of the samples were from runner peanuts in the West Texas region. In each of these cases, the detected concentration was below the EU MRL of 0.05 mg/kg. Since there is no known use of diphenylamine in peanut production, our only explanation for the presence of the residues is contamination of the samples from some outside source or false positive test results.
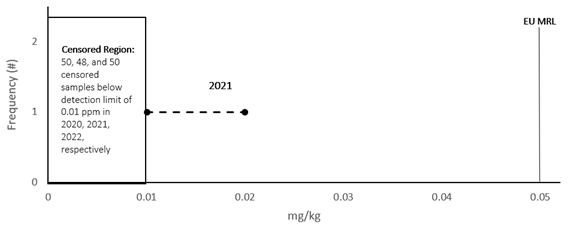
Figure 6. Frequency distribution of detected diphenylamine concentrations in 2021.
Flutriafol
Flutriafol was detected in one sample in 2021 and two samples in 2022, as illustrated in Figure 7. In each of these cases, the detected concentrations were less than one-fifth the EU MRL of 0.15 mg/kg. The 95% confidence intervals for the probability of another sample testing positive for flutriafol in 2021 and 2022 are (0.001, 0.106) and (0.005, 0.137). There is no evidence that flutriafol residue would be detected at a level above the EU MRL in a sample chosen at random in any of the three years.
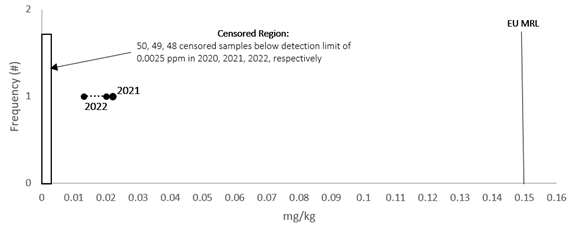
Figure 7. Frequency distribution of detected flutriafol concentrations, 2020 - 2022.
Cypermethrin
As shown in Figure 8, cypermethrin was detected in three samples in 2021 and 5 samples in 2022. In each of these cases, the detected concentration was below the EU MRL of 0.10 mg/kg. The 95% confidence intervals for the probability of another sample testing positive for flutriafol in these two years are (0.013, 0.165) and (0.033, 0.218). Cypermethrin was not detected in any of the peanut samples in 2020. There is no evidence that cypermethrin residue would be detected at a level above the EU MRL in a sample chosen at random in any of the three years.
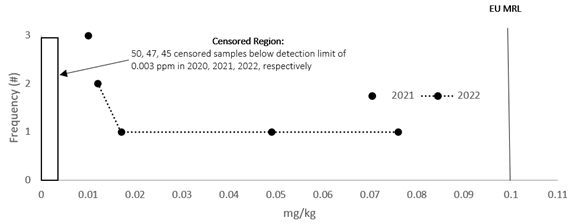
Figure 8. Frequency distribution of detected cypermethrin concentrations, 2020 - 2022.
Cyfluthrin, Esfenvalerate, and Pyriproxyfen
Cyfluthrin, Esfenvalerate, and Pyriproxyfen were only detected in 2021 in 1 of the 50 samples as illustrated in Figures 9, 10, and 11, respectively. The level of cyfluthrin detected was one-half the EU MRL of 0.02 mg/kg. The levels of esfenvalerate and pyriproxyfen were well below their respective EU MRL of 0.05 mg/kg each. There is no evidence that any of these residues would be detected at a level above the EU MRL in a sample chosen at random in any of the three years.
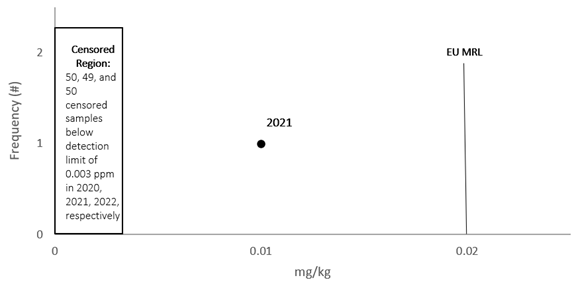
Figure 9. Frequency distribution of detected cyfluthrin concentrations in 2021.
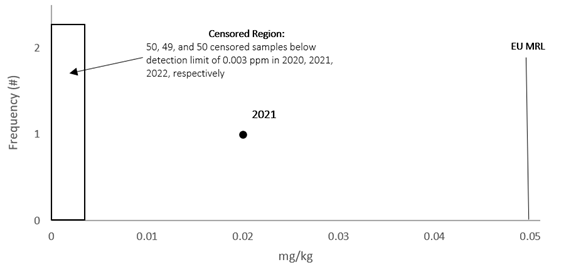
Figure 10. Frequency distribution of detected esfenvalerate concentrations in 2021.
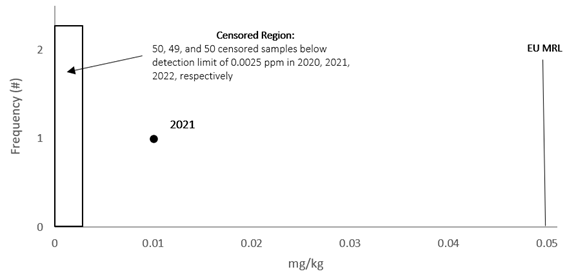
Figure 11. Frequency distribution of detected pyriproxyfen concentrations in 2021.
Fluopyram
As illustrated in Figure 12, fluopyram was only detected in 2022 in 3 of the 50 samples. The detected concentrations were all below the EU MRL of 0.02 mg/kg. The 95% confidence interval for the probability of another sample testing positive for fluopyram 2022 is (0.013, 0.165). Fluopyram was undetected in 2020 and 2022. There is no evidence that fluopyram residue would be detected at a level above the EU MRL in a sample chosen at random in any of the three years.
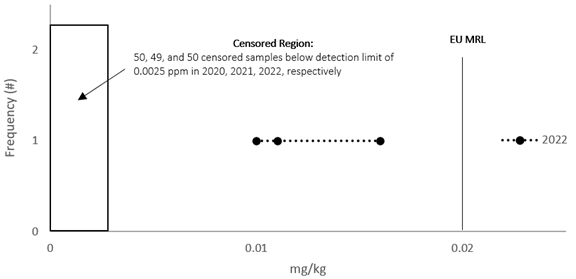
Figure 12. Frequency distribution of detected fluopyram concentrations in 2022.
Clethodim/Sethoxydim (Sum)
Clethodim/sethoxydim (sum) was only detected in 2022 in 9 of the 50 samples. The detected concentrations were all below 1/100th the EU MRL of 5 mg/kg as shown in Figure 13. The 95% confidence interval for the probability of another sample testing positive for the residue in 2022 is (0.086, 0.314). The residue was undetected in 2020 and 2021. There is no evidence that the residue would be detected at a level above the EU MRL in a sample chosen at random in any of the three years.
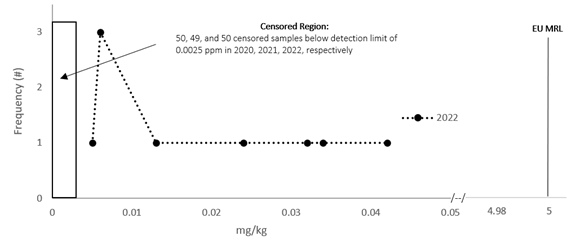
Figure 13. Frequency distribution of detected clethodim/sethoxydim (sum) concentrations in 2022.
Fluazifop-P
As shown in Figure 14, fluazifop-P was only detected in 2022 in 1 of the 50 samples. The detected concentration was just below the EU MRL of 0.01 mg/kg. Fluazifop-P was undetected in 2020 and 2021. There is no evidence that fluazifop-p residue would be detected at a level above the EU MRL in a sample chosen at random in any of the three years.

Figure 14. Frequency distribution of detected fluazifop-p concentrations in 2022.
Pesticide Residue Health Risk Assessment
Each year that a residue was detected, we estimate the acute health risk, AHI, and the chronic health risk, HQ. These estimates, presented in Table 4, are based on the body weight of the average U.S. female over 20 years of age, 77.5 kg (Fryar et al 2021), and we assume that peanut consumption is 30 grams of peanuts per day. We also provide estimates of the quantity of peanuts that would have to be consumed per kilogram bodyweight in order to raise each pesticide’s respective health risk index to the danger threshold level of 100.

Pesticide residue health risk assessments for an adult female weighing 77.5kg
The most notable aspect is the small magnitude of the health risk indices. The threshold value signifying potential harm is 100. The indices are many magnitudes less than 100 for each of the residues detected. The highest short-term health risk is from cypermethrin used in the production of the 2022 peanut crop, aHI=0.074. However, to be of concern, this individual would have to consume 41kg of peanuts in a 24-hour period. The highest long-term health risk is from 2,4-D used in the production of the 2020 peanut crop, HQ=0.035. However, to be of concern, this individual would have to consume 85kg of the 2020 crop-year peanuts over their lifetime; at 30 grams per day, this would take almost 8 years.
In order to generalize the results to other body weights, Table 5 provides estimates of the quantity of peanuts that would have to be consumed per kilogram bodyweight in order to raise each pesticide’s respective health risk index to the danger threshold level of 100. For example, a child weighing 30kg would need to eat 120kg (30*4.00) of 2021 peanuts in a 24-hour period to raise health concerns regarding cyfluthrin. An adult with a stable weight of 90kg would need to consume 272.7kg (90*3.03) of 2020 crop-year peanuts over the course of a lifetime to raise chronic health concerns regarding bifenthrin.
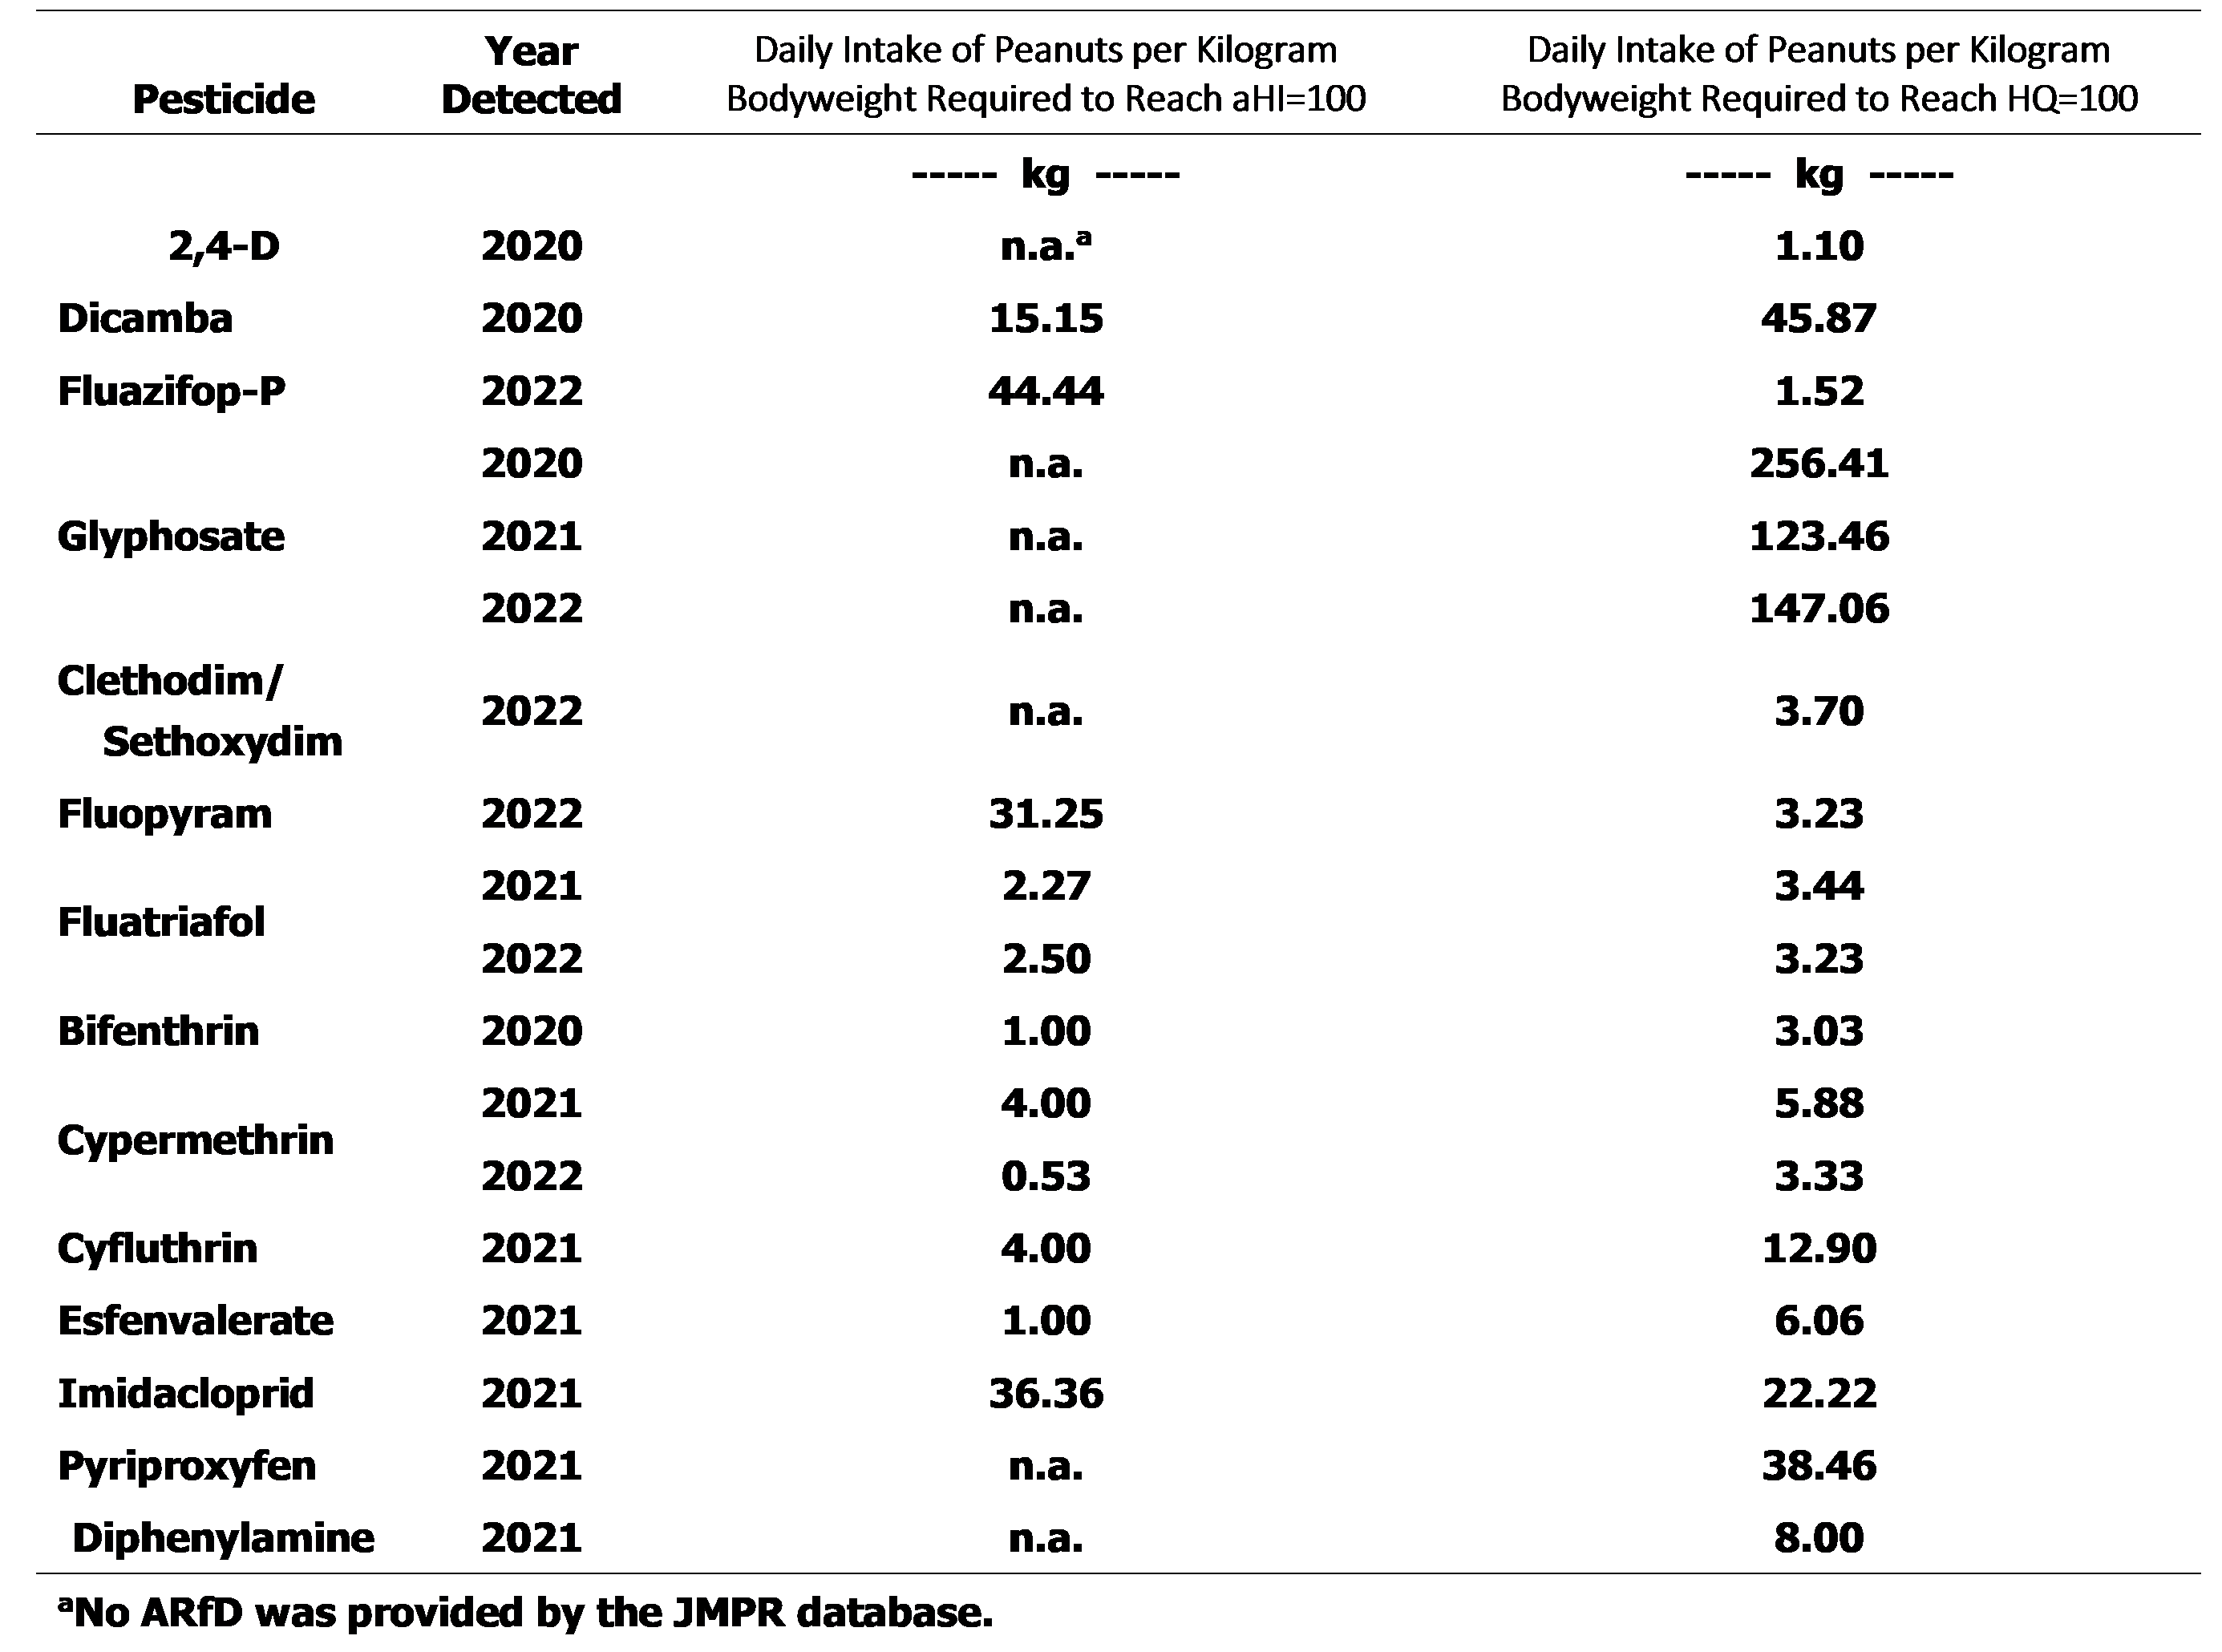
Consumption of peanuts per kg bodyweight necessary to raise health concerns
This analysis has provided evidence regarding the concentrations of pesticide residues in the U.S. peanut crop. For each crop year, 2020-2022, 50 geographically representative samples were tested for a vast array of pesticide residues. Only 14 residues were detected in a small number of samples. Six of the residues were only detected in one out of the 150 samples (dicamba, fluazifop-p, esfenvalerate, imidacloprid, pyriproxyfen, and diphenylamine). Glyphosate was the residue with the highest degree of detection in 28 out of 150 samples. The aim of this research was to examine the presence of pesticide residues in overall peanut production. Even though our samples were drawn to represent each region’s proportion of peanut production, our sample sizes for each individual region were too small to analyze regional differences regarding residues.
Due to the high degree of censoring, the analysis focuses on a health risk assessment for consumers of peanuts. Even though the analysis overestimates the risk, both the short-term and long-term health risks from pesticide residues found in the U.S. peanut crop are minimal. These results, taken in tandem with the results regarding the lack of pesticide residues detected, signal the safety of U.S. peanuts as a food choice for consumers worldwide.
Acknowledgements
The authors would like to thank Miriam Crosby (American Peanut Shellers Association), Dr. Darlene Cowart (Birdsong Peanuts), Maggie A. Cropp (Watson Spence, LLP), Evans Plowden, Jr. (Watson Spence, LLP), Rhonda Starling (Golden Peanut & Tree Nuts Company), and John Takash (McCleskey Mills, Inc.) for obtaining samples and data management for successful completion of this project.
Literature Cited
Agricultural Marketing Resource Center. 2024. Peanuts. 2024Sep6; https://www.agmrc.org/commodities-products/nuts/peanut-profile.
Archer P. 2016. Overview of the peanut industry supply chain. pp. 253-266 In: Stalker, H.T., and Wilson, R.F. (Eds.), Peanut-Genetics, Processing, and Utilization. Amer. Peanut Res. and Educ. Soc., Inc. Tifton, GA.
Aydin S. and Ulvi M.. 2019. Residue levels of pesticides in nuts and risk assessment for consumers. Quality Assurance and Safety of Crops & Foods. 11 (6):539-548.
Calderon R., Garcia-Hernandez J., Palma P., Leyva-Morales J.B., Zambrano-Soria M., Bastidas-Bastidas P.J., and Godoy M.. 2022. Assessment of pesticide residues in vegetables commonly consumed in Chile and Mexico: Potential impacts for public health. Journal of Food Composition and Analysis 108:104420.
Cowart D., Powell S., Locke M., Starling R., and Takash J.. 2016. Raw Peanut Processing. pp. 381–403 In: Stalker, H.T., and Wilson, R.F. (Eds.), Peanut-Genetics, Processing, and Utilization. Amer. Peanut Res. and Educ. Soc. Inc. Tifton, GA.
ECHA. 2016. ADI/ARfD derivation for biocidal active substances; 2024 Jan16; https://echa.europa.eu/documents/10162/4221979/adi_arfd_derivation_en.pdf/9cf8371e-2ce7-b62a-1089-04b7a63c2aa1.
EPA.gov. 2024. Food and Pesticides. 2024Jan16; https://www.epa.gov/safepestcontrol/food-and-pesticides.
European Communities 2008. New rules on pesticide residues in food. 2024Jan16; https://food.ec.europa.eu/system/files/2016-10/pesticides_mrl_legis_factsheet_en.pdf.
Fryar C.D., Carroll M.D., Gu Q., Afful J., Ogden C.L. 2021. Anthropometric reference data for children and adults: United States, 2015-2018. National Center for Health Statistics. Vital Health Stat 3(46).
Helsel D.R. 2012. Statistics for censored environmental data using Minitab and R. 2nd ed.pp. 144–145 John Wiley and Sons, Hoboken, NJ.
JMPR . 2002. Pesticide residues in food – Report of the Joint Meeting of the FAO Panel of Experts on Pesticide Residues in Food and the Environment and the WHO Core Assessment Group on Pesticide Residues. Rome Italy. 16-25 Sep 2002. https://www.fao.org/fileadmin/templates/agphome/documents/Pests_Pesticides/JMPR/Reports_1991-2006/Report_2002.pdf.
Liu Y., Shen D., Li S., Ni Z., Ding M., Ye C., and Tang F.. 2016. Residue levels and risk assessment of pesticides in nuts of China. Chemosphere 144:645-651.
National Agricultural Statistics Service. 2024: 2024Mar24; https://www.nass.usda.gov/Statistics_by_Subject/result.php?E9CF3C21-235B-3212-864B-47198D4146FA§or=CROPS&group=FIELD%20CROPS&comm=PEANUTS.
University of Georgia Extension. 2024: UGA peanut production. The 2024 pest management quick reference guide; 2024Dec16; https://peanuts.caes.uga.edu/content/dam/caes-subsite/peanuts/docs/2024/UGA-Pest-Management-2024.pdf.
US Environmental Protection Agency. 2000. Available Information on Assessing Exposure from Pesticides in Food, A User’s Guide. Document ID: EPA-HQ-OPP-2007-0780-0001.
WHO. 1987. International Programme on Chemical Safety. Principles for the safety assessment of food additives and contaminants in food. Environmental Health Criteria 70. World Health Organization, Rome Italy.
WHO . 2021. Inventory of evaluations performed by the Joint Meeting on Pesticide Residues (JMPR). [accessed 2025Apr0 07] https://apps.who.int/pesticide-residues-jmpr-database/Home/Search.
Notes
- Professor of Economics, Turner College of Business and Technology, Columbus State University, 4225 University Ave., Columbus, GA 31907 [^] Corresponding author’s email: blair_benjamin@columbusstate.edu