

Introduction
Peanut butter is a ground paste made from roasted peanuts that is enjoyed for its characteristic and desirable aroma and flavors. In 2021, 120 million pounds of peanut butter were produced in the month of June alone in the United States (USDA, 2021). In 2020, approximately 299 million Americans consumed peanut butter (Statista, 2021). The nut-based and sweet spread category was worth a total $3.9 billion in 2018, of which peanut butter is by far the most dominant product at 72% (Mintel, 2018). Peanuts contain approximately 44-56% oil (Cobb and Johnson, 1973), of which 80% is composed of oleic and linoleic fatty acids (Worthington and Holley, 1967). The shelf life of peanut butter is largely dependent on the extent of rancidity present in the paste. This rancidity is the primary reason for the deterioration of the desirable aromas and flavors of peanut butter due to hydrolytic and oxidative mechanisms (Reed et al., 2002). The polyunsaturated fatty acids, principally linoleic acid, are more susceptible to lipid oxidation due to their weakened bond dissociation energy caused by methylene interruption (McClements and Decker, 2017).
The process of lipid oxidation is marked by the presence of a delayed lag phase and a rapidly increasing exponential phase. The lag phase can be extended through factors such as a decrease in temperature, a decrease in oxygen concentration, and with the addition of compounds known as antioxidants that inhibit lipid oxidation (McClements and Decker, 2017). Antioxidants are often naturally found in many organisms and serve the purpose of protecting against the buildup of free radicals from the oxidation processes that lead to oxidative stress. Endogenous antioxidants found in biological tissues are often destroyed or reduced when foods are subjected to processes such as thermal treatment in industrial settings, and therefore antioxidants are often added back into foods in the form of synthetic antioxidants to maintain their shelf life (McClements and Decker, 2017). However, consumers currently desire healthy food options with natural alternatives to the synthetic antioxidants traditionally used by the food industry (Fernandes et al., 2017; Lorenzo et al., 2018).
Peanut skins are the paper-like outer layer that surround the inner peanut kernels inside the peanut shell. Peanut skins contain natural antioxidants in the form of phenolic compounds that have been shown to exhibit positive health effects (Constanza et al., 2012; Yu et al., 2006). Phenolic compounds are often found in various foods such as grapes, onions, and apples, and have been found to protect against certain cancers and pulmonary diseases (Xiao and Ho, 2017). Peanut skin extracts (PSE) have been previously shown to exhibit antioxidant activity (Nepote et al., 2000). Pominski et al. (1951) identified A-type proanthocyanidin compounds in aqueous PSE that have previously been found to inhibit the hyaluronidase enzyme that is found at increased levels in the presence of certain cancers. Peanut skins are a byproduct of peanut processing and current practical uses include their addition into livestock feeds (Sobolev and Cole, 2003). With a world peanut production of 47 million tons (APC, 2020) and an average skin content of 2.6% (Sobolev and Cole, 2003), it is estimated that a total of 1.2 million tons of skins were produced in 2020.
To address this waste stream and to utilize an inexpensive source of antioxidants, research has focused on investigating the efficacy of experimental uses of peanut skins and their extracts in different applications. Francisco and Resurreccion (2012) produced tea-like beverages with aqueous extractions of PSE that were found to have a higher antioxidant activity than that of green or black teas using chemical assay methods. The addition of powdered PSE into salami products was found to lower the peroxide value when compared to control salamis and therefore added support to the use of PSE as a source of natural antioxidants in foods (Larrauri et al., 2013). Intact peanut skins have been added to peanut butter and shown to increase the total phenolic content and dietary fiber content of the material, while retaining the chemical antioxidant power of the peanut skins (Ma et al., 2014). However, the addition of peanut skins to foods at higher concentrations has been shown to increase undesirable flavors such as bitterness and astringency (Hathorn and Sanders, 2012). The encapsulation of peanut skin extracts with maltodextrin has been proven to effectively reduce the intensity of these undesirable attributes by delaying their solubilization in the mouth by saliva (Dean et al., 2016). The chemical antioxidant activity of the extracts was not found to be affected by the processing, indicating that peanut skin extracts could serve as an antioxidant when added as food ingredient (Constanza et al., 2012). One advantage to using peanut skin extracts is these ingredients could be considered as natural sources of antioxidants.
This study investigated the efficacy of peanut skins and their extracts as natural antioxidant additives in peanut butter. Peanut skins are a significant waste product of peanut processing. The utilization of this natural source of antioxidants could both address the processing waste issue while providing an inexpensive alternative to synthetic antioxidants. Previous studies have identified potential off-flavors associated with the addition of peanut skins and their extracts into foods, and so the change in the sensory characteristics of treatments due to such additions was additionally considered.
Materials and Methods
Materials
Jumbo size normal oleic peanuts (Arachis hypogaea L.) of the runner market type were obtained from a single lot harvest in 2020. Peanuts were harvested, handled, and maintained according to accepted industry practices. The peanuts were sourced from Olam International (Edenton, NC), shelled and roasted with skins intact, and delivered to the USDA-ARS Food Science and Market Quality and Handling Research Unit (FS&MQHRU, Raleigh, NC) within 24 hours of processing. All chemicals and reagents were purchased from Thermo Fisher Scientific (Fairlawn, NJ) unless otherwise stated.
For the peanut skin extract (PSE), peanut skins were sourced from a blanching operation of Olam International (Blakely, GA) and extracted by Alchem Laboratories (Alachua, FL) using 70% (v/v) ethanol in deionized water in accordance with earlier protocols for the extraction of peanut skin phenolics performed by this laboratory (Constanza et al., 2012). The ethanol was then evaporated, and the aqueous fraction was spray dried to produce a powder. The nonencapsulated powder was stored in a plastic bag contained within a plastic drum and frozen until needed.
The encapsulated (E) PSE used in this study was produced by mixing nonencapsulated PSE with Maltrin® M150 maltodextrin (Grain Processing Corp., Muscatine, IA) at a ratio of 10.5 g/100 g and allowing 24 hours for hydration. The mixture was then pumped at a rate of 47 mL/min using a Masterflex® L/S® Series Peristaltic Pump (Cole-Parmer®, Vernon Hills, IL, U.S.A.) and subsequently spray dried (Model Lab 1, AnHydro Inc., Soeberg, Denmark) with an inlet temperature of 170 C, outlet temperature of 90 C, and feed solids of 10-14%. The encapsulated PSE was stored in vacuum sealed mylar bags (IMPAK Corp., Central City, SD, U.S.A.) and frozen until needed.
Preparation of Peanut Butter Matrix
A portion of the roasted peanuts with skins intact were set aside and not subjected to removal of skins by blanching to produce an unblanched peanut butter (UBL) that served as the control. The remaining roasted peanuts with skins intact were blanched on site to remove the skins using a counter-rotating mechanical blancher manufactured by the Department of Biological and Agricultural Engineering (BAE) at North Carolina State University. The blanched peanuts (BL) were subjected to further skin removal using hand agitation and ambient air from an open steel walled box with a perforated bottom fitted with an electric fan manufactured by BAE. The lighter skins were separated from the heavier peanut kernels by the ambient air current from the box.
Roasted then blanched peanuts were added to a food processor (7 L Blixer® 6, Robot-Coupe® U.S.A Inc., Ridgeland, MS) in 0.9 kg (2 lb) portions and ground to a smooth and consistent paste to produce the blanched (BL) peanut butter control. Unblanched peanut butter (UBL) was formed using roasted peanuts with skins intact following the same grinding process. The grinding followed the grind-cool procedure previously developed to minimize heat oxidation (Sanders et al., 1989).
Addition of the nonencapsulated and encapsulated PSE to the blanched peanuts was done using the food processor in 0.9 kg (2 lb) portions. The corresponding addition was added at either 1% or 2% w/w to the processor. The blanched peanut and addition mixture was then ground to a smooth and consistent paste.
All pastes above were prepared in batches according to each treatment, combined by treatment, portioned into 8 oz glass canning jars (Ball® Corp., Daleville, IN), and sealed for storage. All samples were packed into the jars as full as possible to eliminate any headspace. Samples were created in triplicate for each treatment at every time point.
Shelf Life Study Storage
The peanut butter samples in sealed glass canning jars were placed into incubators (Model HCN-33-4, So-Low Environmental Equipment Co., Cincinnati, OH) and held at a constant temperature of 29.9 ± 0.1 C and relative humidity of 26.45 ± 1.65% for a period of 24 weeks. The samples were analyzed initially (0) and at time intervals of 2, 4, 6, 8, 10, 12, 16, 20, and 24 weeks.
Analysis
Moisture Content
The moisture content of the peanut butter samples was determined based on an earlier study of standardized oven drying methods for the determination of peanut moisture content (Young et al., 1982). Samples were placed into aluminum sample pans in triplicate. The pans were then weighed and placed into an oven (LXD Series, Despatch Industries Inc., Minneapolis, MN) at 130 C for 6 H. The pans were then allowed to cool to ambient temperature in a desiccator and weighed. The moisture content was determined gravimetrically by difference and recorded.
Color Analysis
Color analysis was performed using a HunterLab D25® optical sensor and DP-9000™ processor (Hunter Associates Lab. Inc., Reston, VA). The samples were added to glass petri dishes and spread evenly. The color was determined in triplicate, with a 180-degree rotation of the dish after the first measurement with stirring of the sample occurring after the second measurement. The HunterLab L, a, and b values were recorded. With this system, L is the measure of lightness where 0 is black or total absorbance of light and 100 is white is no absorbance. The a values define the color space from red (+a) to green (-a) and the b values define the color space from yellow (+b) to blue (-b) (HunterLab, 2015).
Free Fatty Acid (FFA) Content
The oil was expressed from the peanut butter samples in duplicate by mechanical pressing using a hydraulic laboratory press (Model 3912, Carver® Lab. Equipment, Wabash, IN). The free fatty acid (FFA) content was determined according to Official Method Ab 5-49 of the American Oil Chemists’ Society (AOCS, 2003). A portion of 7.05 g of expressed oil was mixed with 50 mL of neutralized ethanol and 1 mL of phenolphthalein indicator was added. The solution was titrated with 0.25 N sodium hydroxide under continuous agitation until a faint pink color was observed and maintained for 1 min. The percent FFA was then determined using the following equation:
Percent FFA= mL of NaOH required ×0.25 ×282 ×100sample weight (g) ×1000
Peroxide Value
The peroxide value (PV) of the oil expressed from the peanut butter samples was determined following AOCS Method Cd 8-53 (AOCS, 2003). In brief, approximately 5 g of oil was added to 30 mL of an acetic acid-chloroform solution at a ratio of 3:2. Once the sample was dissolved, 0.5 mL of a saturated potassium iodide solution was added. The sample was allowed to stand for 1 min with occasional shaking, and then 30 mL of deionized water was immediately added. The solution was titrated with 0.1 N sodium thiosulfate gradually and under constant agitation until the iodine color was nearly dissipated. Starch indicator solution was then added at 2 mL to the flask and titration with sodium thiosulfate was continued gradually under constant agitation until the blue color fully dissipated. The peroxide value was then determined according to the following equation where N is the normality of the sodium thiosulfate solution:
PV mEq peroxide/kg sample= mL of sample-mL of blank×N×1000sample weight (g)
Fatty Acid Composition
The fatty acid composition of peanut butter samples was determined as described by Bannon et al. (1982). In brief, 1 mL of 0.5 M methanolic potassium hydroxide was added to 1 drop of expressed oil in a screw capped glass tube. The capped tube was then heated at 85 C for 5 min and subsequently cooled slightly, after which 1 mL of 14% boron trifluoride in methanol (Sigma-Aldrich®, St. Louis, MO) was added. The capped tube was then heated at 85 C for 10 min and cooled slightly, after which 1 mL of deionized water and 1 mL of hexane was added. The capped tube was vortexed at full speed for 30 sec, the contents of the tube were allowed to settle, and the top (hexane) layer was removed and transferred to another tube containing a small amount of sodium sulfate crystals. The tube was swirled to remove any water and the hexane was transferred to crimp-top chromatography vials for analysis.
Gas-liquid chromatography was conducted using a PerkinElmer AutoSystem® XL gas chromatograph (PerkinElmer Corp., Norwalk, CT) and a BPX70 column (SGE Analytical Science, Melbourne, Australia) of 30 m length, 0.25 mm inside diameter, and 0.25 μm film thickness. The samples were injected using a split injector held at 220 C. The column was held at 60 C for 2 min and increased to 180 C at a rate of 10 C/min. The column was then increased to 235 C at a rate of 4 C/min. The volatile compounds were transferred through the column with a split flow ratio of 40:1 using helium gas at 20 psi to a flame ionization detector (FID) held at 250 C for detection. A commercial standard of fatty acid methyl esters (FIM-FAME-6, Matreya LLC, State College, PA) was used to compare retention times of compounds for identification. Quantitative analysis of the fatty acids identified by normalization using AOCS Method Ce 1-62 (AOCS, 2003).
Headspace Analysis
Headspace analysis was conducted with the use of a PerkinElmer AutoSystem® XL gas chromatograph and a TurboMatrix 40 headspace sampler (PerkinElmer Corp., Norwalk, CT). A 2.0 g portion of each peanut butter sample was weighed into 22 mL glass headspace sampler vials in duplicate. A 2.0 mL aliquot of an internal standard of 3-heptanone (0.1 mg/mL, Sigma-Aldrich, St. Louis, MO) in hexadecane was then added to the vials. The glass vials were sealed with a PTFE-coated silicone rubber septa and an aluminum crimp-top cap and heated in the injector at 150 C for 30 min for volatilization. The volatile compounds were then injected onto a ZB-5® capillary column (Phenomenex Corp., Torrance, CA) of 30 m length, 0.25 mm inside diameter, and 1.0 μm film thickness. The column temperature was held for 1 min at 40 C and then increased at a rate of 15 C/min to 300 C. The volatile compounds were transferred through the column with a split flow ratio of 50:1 using helium gas at 10 psi to a flame ionization detector (FID) held at 305 C for detection. Standard solutions of hexanal and pentanal were prepared by adding weighed amounts of each into the internal standard solution to create standard curves.
Descriptive Sensory Analysis
Descriptive sensory analysis was conducted using the Spectrum™ method (Meilgaard et al., 1987). The trained panelists with over 1000 hours of experience in peanut sensory analysis utilized the previously published lexicon for peanut flavor (Johnsen et al., 1988; Sanders et al., 1989). An intensity scale of 0 to 15 was used to score the attributes listed in the lexicon. Samples were assessed at ambient temperature in a randomized order for the presence and intensity of attributes, with plain saltine crackers and drinking water used to cleanse the palate between assessments to avoid potential carryover effects. Fresh peanut butter with a roast peanutty (RP) value of 5.0 made from jumbo runner peanuts roasted to a Hunter L value of 49±1.0 without additions was utilized as a reference sample during analysis.
Statistical Analysis
Results are expressed as the mean ± standard deviation. One-way repeated measures Multivariate Analysis of Variance (MANOVA) was performed to determine the difference in means over time both within and between treatments. Analysis of Variance (ANOVA) was performed to identify statistically significant (alpha = 0.05) differences between the overall means of treatments, and means were separated based on similarities following Tukey’s honestly significant difference (HSD) post hoc test. Principal component analysis (PCA) was conducted for the statistical analysis of sensory data. All statistical analyses were performed using JMP® Pro 15 (SAS® Inst., Cary, NC, U.S.A.).
Results and Discussion
Using Peanut Skin Extracts as an Antioxidant Ingredient
Peanut skins are reported to contain significant quantities of small molecular phenolic compounds that have various bioactivities when measured using chemical assays and in cell cultures. When extracted using a mixture of ethanol and water (70/30 v/v) by a commercial processor (Alchem Laboratories, Alachua, FL), the yield of solid material was 16%. The analysis of this material using HPLC for a previous study reported that the majority of the compounds identified were catechins, catechin gallates, procyanidins and related glycosides (Dean, 2020). Using a chemical assay, the Oxygen Radical Absorbance Capacity (ORAC), the PSE was found to have approximately 2500 μmoles of Trolox Equivalents per grams with the encapsulated material having only 10% of that activity. Our previous work as an ingredient indicated physiological effects such as reduced glycemic response (Christman et al., 2018) and reduction of inflammation in a cell system (Lewis et al., 2013). This indicated that these extracts would be capable of reducing or slowing the onset of lipid oxidation in a food system. The industry currently uses several techniques to prevent or slow lipid oxidation in peanut butter, such as using high oleic (HO) peanuts, nitrogen gas flushing the packaging to remove oxygen and create a nitrogen atmosphere and cool storage. This study deliberately avoiding using them in order to be able to attribute any antioxidant effects to the PSE added.
Moisture Content
The moisture content (MC) of treatments was determined for the three samples corresponding to each treatment at various time points (Table 1). The nonencapsulated (NE) treatment at 2% w/w had the highest overall moisture content at 2.24±0.14% w/w, while the unblanched (UBL) treatment had the lowest at 1.96±0.09%. An increase in the MC of all treatments was seen over time, with a statistically significant difference in moisture contents both within treatments and between treatments over time. The NE at 2% w/w had the greatest overall moisture content increase. The increase in moisture content of peanut butters over time has previously been reported (Rozalli et al., 2016). The apparent increase was attributed to the chemical and physical changes within the peanut butter matrix over time, such as interactions between molecules or protein conformation changes, that result in a diffusion of moisture throughout a food matrix and allow for moisture to become more easily accessible (Damodaran, 2017). The addition of nonencapsulated peanut skin extracts introduced polyphenolic compounds into this food matrix that likely altered the thermodynamic state of the peanut butter, resulting in an increased molecular mobility of water throughout the matrix and a greater moisture content overall compared to the blanched and unblanched controls.
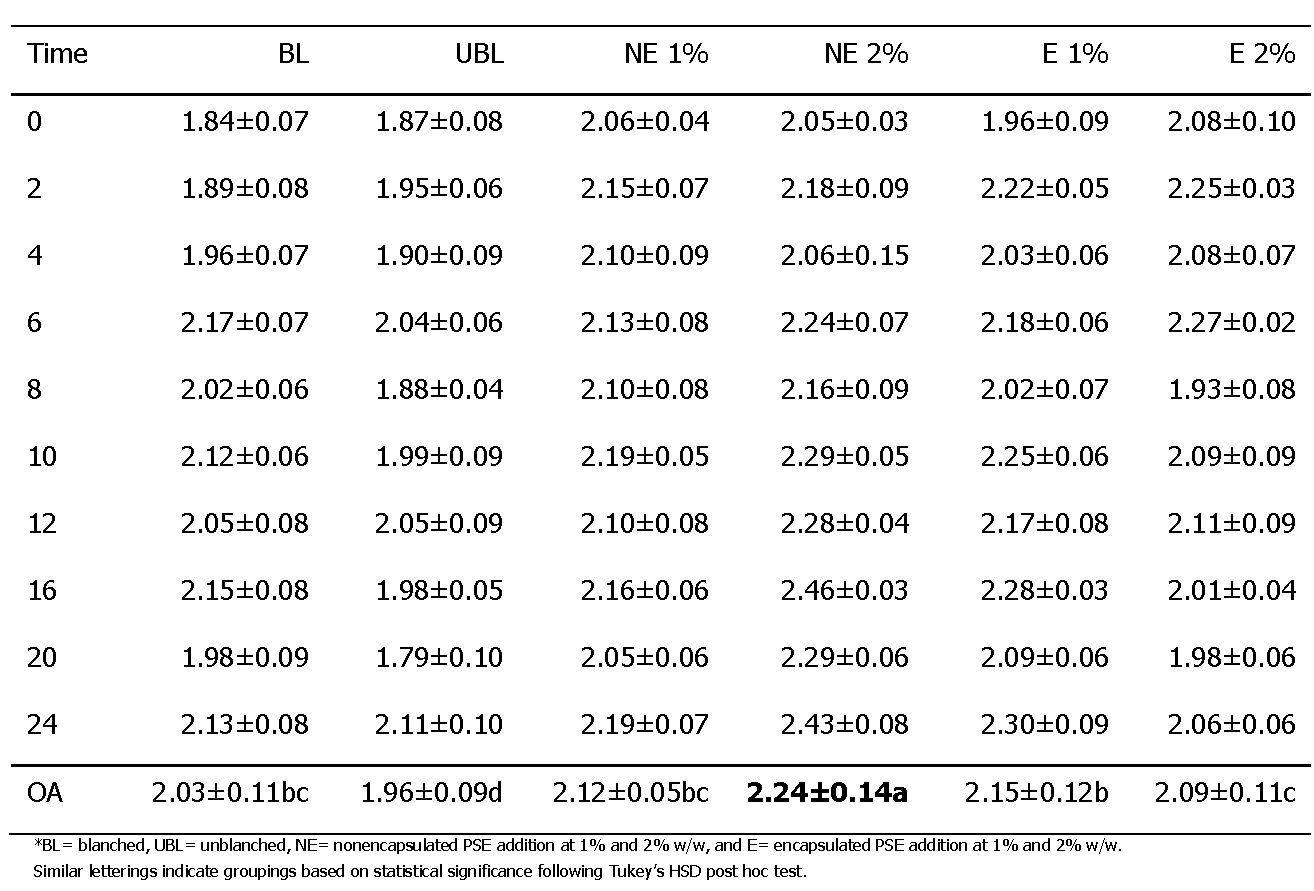
The average moisture content (percent wet weight) and standard deviation of six peanut butter treatments* at various time points and overall (OA).
Maltodextrin is commonly used in food processing as an encapsulating and bulking agent due to its low cost and bland flavor (Huber and BeMiller, 2017). The bulking properties of maltodextrin provide an explanation for the decrease in overall moisture content of the encapsulated (E) treatment with an increase in concentration from 1% to 2% w/w (Table 1). The elevated moisture content of the NE PSE addition at 2% w/w and the E PSE addition at 1% w/w compared to the blanched control both initially and overall indicated the potential introduction and retention of moisture with the addition of such peanut skin extracts. The PSE ingredients were also a source of added moisture. Both the NE (7.14 ± 0.03%) and the E (7.11 ± 0.06 %) PSE ingredients were determined to contain 7% moisture, although their physical appearance was of free flowing dry powders. Polyphenolic compounds are more susceptible to degradation at higher water activities (Rocha-Parra et al., 2016), and so further investigations should consider the water activity of peanut butters on the efficacy of antioxidant capacities in peanut butters. Rocha-Parra et al. (2016) found a 65% decrease in catechin content at a water activity of 0.33 over 145 days of storage compared to a lower water activity of 0.11.
Color Analysis
The color value was determined at various time points using the Hunter L, a, b color space in triplicate for three samples corresponding to each treatment. The differences in the average color values for L, a, and b were found to be statistically significant both within and between treatments over time with statistically significant differences between the overall average color values of each treatment (Table 2).
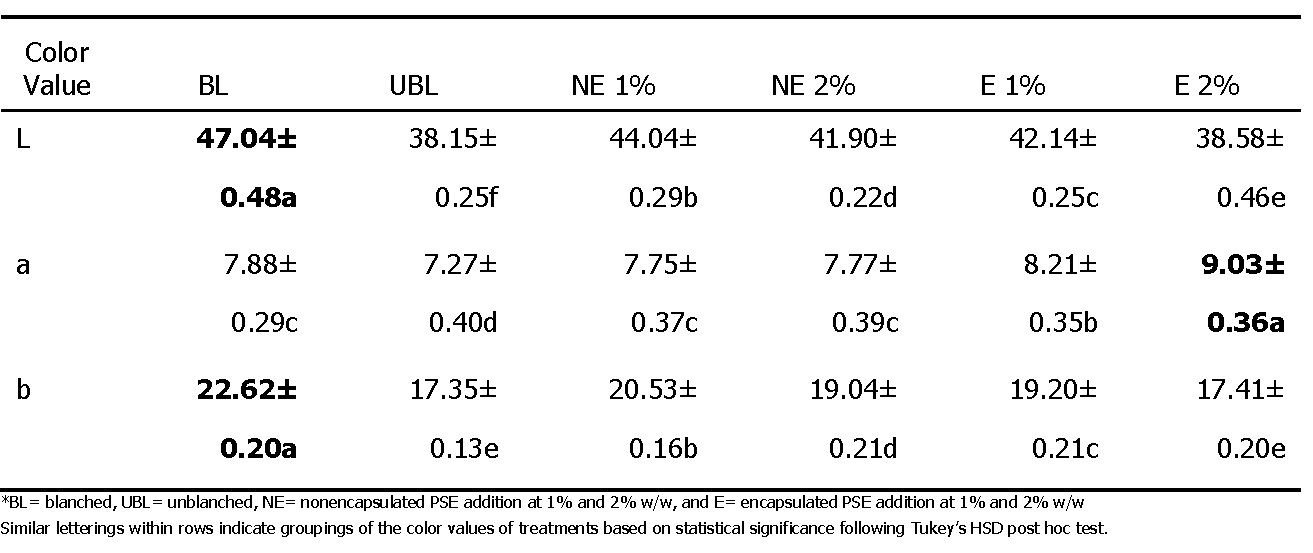
The overall average and standard deviation of HunterLab L, a, and b values for six peanut butter treatments*.
The change in the average color values over time for all treatments was reported by following the HunterLab L, a, and b color space. It was found that the unblanched (UBL) treatment was the darkest (L=38.15±0.25), the encapsulated (E) PSE treatment at 2% w/w was the reddest (a=9.03±0.36), and the blanched (BL) treatment was the most yellow (b=22.62±0.20). Overall, increasing concentrations of extract additions led to a significant darkening of peanut butters. Catechol-type tannin pigments and trace flavonoid-type pigments present in peanut skins before and after the extraction process provide an explanation for the change in coloration of peanuts butters associated with the skin extract additions (Stansbury et al., 1950). Addition of encapsulated (E) extracts produced a significantly redder product than both the nonencapsulated (NE) extracts and the controls. A potential explanation for this phenomenon is the prevention of pigment degradation due to the protective properties of encapsulation. The presence of the skin material in both the unblanched samples and those containing the extract additive resulted in visible differences from the blanched control peanut butter which could potentially influence consumer acceptance.
Free Fatty Acid Content
The percent free fatty acid content (FFA) was determined for three samples corresponding to each treatment at various time points. A significant difference both within and between treatments over time was found. Figure 1 shows a steady increase over time for all treatments, with encapsulated (E) PSE at a concentration of 2% w/w having the highest percent FFA. The average percent FFA and standard deviation for treatments at each time point was found to differ significantly.
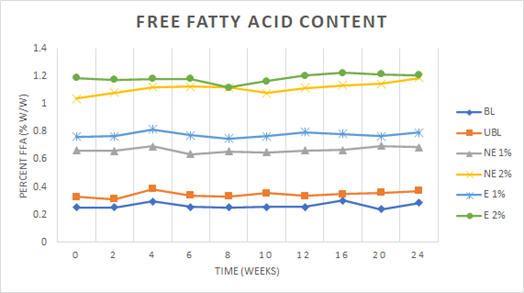
The average percent FFA (w/w) of treatments over time (weeks) for six peanut butter treatments, where BL= blanched, UBL= unblanched, NE= nonencapsulated PSE addition at 1% and 2% w/w, and E= encapsulated PSE addition at 1% and 2% w/w.
An increase in the FFA content of peanut butters was apparent at time zero with increasing concentrations of extract additions. Peanut skins serve a protective purpose by enveloping peanut kernels to protect them from environmental degradation, therefore removing them would be expected to cause the kernels to be more susceptible to hydrolytic rancidity due to their exposure to the environment (Moss and Rao, 1995). The encapsulated (E) extracts exhibited greater FFA values than their nonencapsulated (NE) counterparts at equal concentrations, which was thought to be due an increase in degradation that can occur due to the heat treatment typically utilized in the encapsulation process. Addition of the peanut skin extract ingredient was seen to add FFA to the samples as opposed to preventing their formation with oxygen exposure over time.
Peroxide Value (PV)
The initial PV values for the samples was elevated above 10 meq/kg which was attributed to the heat effects of roasting on the peanut butter lipid fraction. The average PV for each treatment decreased over time to a minimum at six weeks, followed by an increase and stabilization over the remaining weeks until the final time point at 24 weeks (Figure 2). PV is known to decrease from the initial point with time due to conversion of the peroxides formed to other oxidation products. There was a significant difference both within and between treatments over time. The greatest average PV of 19.31 (± 1.98) was seen in the blanched control (BL) when compared to the other treatments. All additions of skin extracts prevented an expected increase in PV with time when compared to the controls. Hathorn and Sanders (2012) reported that the addition of intact peanut skins to peanut butter resulted in an increase in the rate of oxidation as measured by PV. They attributed this to the insolubility of the antioxidant compounds into the peanut butter matrix, and therefore no protection for the lipid fractions. The lower PV values of the treated samples at time zero due to the addition of extracts confirms some effectiveness of the antioxidant phenolic compounds present in skins to inhibit the formation of lipid peroxides that serve as substrates for lipid oxidation. In Figure 2, the PV values did not significantly increase over the course of the study when the extracts were added when compared to the samples made from the unblanched peanuts. The concentration of the phenolic materials in the extracts would seem to offer some protection from further formation of the lipid peroxides in the peanut butter samples.
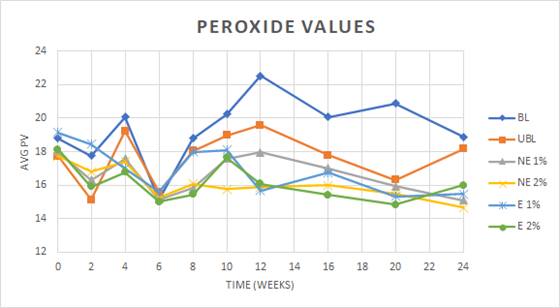
The average peroxide value (mEq O2/kg) of treatments over time (weeks) for six peanut butter treatments, where BL= blanched, UBL= unblanched, NE= nonencapsulated PSE addition at 1% and 2% w/w, and E= encapsulated PSE addition at 1% and 2% w/w.
Fatty Acid Composition
The fatty acid contents of treatments were determined as percentages of the major fatty acids present in the lipid portion of the peanut samples. The palmitic acid (16:0), oleic acid (18:1), and linoleic acid (18:2), along with the ratio of oleic to linoleic acid (O/L) values at the start of the study are reported in Table 3. The initial differences would appear to be within the natural limits of the material, as the peanut skin extracts did not contain any fatty acids. With time, significant changes were seen in the unsaturated fatty acids and correspondingly the O/L ratios as would be expected with their oxidation and the formation of new compounds. The difference both within and between treatments over time for all measures were found to be statistically significant. The encapsulated (E) PSE treatment at 2% w/w was found to have the highest palmitic acid (16:0) content overall (9.74±0.16), with a decrease 16:0 content seen at 20-24 weeks to a level lower than that of any other treatment. The same pattern was determined for the linoleic acid (18:2) content of the E 2% treatment. While the oleic acid (18:1) content of E 2% was the lowest overall (56.38±0.71), the oleic acid content saw an increase at 16-24 weeks to a level higher than that of any other treatment. The E 2% treatment additionally exhibited the greatest change in O/L ratio over time, with a gradual decrease over time to approximately 18 weeks and an increase to a maximum O/L ratio at 24 weeks greater than that of any other treatment. Although the O/L ratio of the E 2% treatment was lower than that of the blanched control, it had a lower PV value than the control overall (Figure 2), thus indicating the addition had a protective effect on the fatty acid composition of peanut butters. It would be expected that if oxidation of the fatty acids occurred, there would a reduction in the content of the unsaturated ones, especially linoleic acid. As the content of the fatty acids monitored was the absolute percentage of each individual fatty acids compared to all the fatty acids present, a decrease in one would also result in an increase in others. Those of the highest percentage, in this case, oleic acid would increase accordingly. Figure 3 displays the changes in linoleic acid over the course of the study for each of the samples. The E 2% treatment provided the best resistance to oxidation of linoleic acid until the end of the study when the greatest decrease occurred.
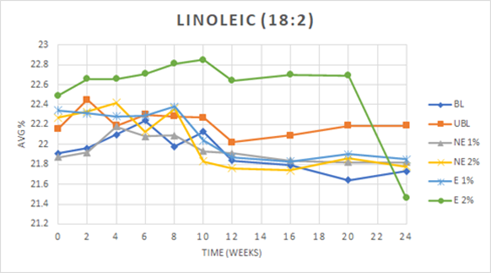
The change in the average content (reported as a percentage of all fatty acids) of the linoleic acid over time (weeks) for the six peanut butter treatments, where BL= blanched, UBL= unblanched, NE= nonencapsulated PSE addition at 1% and 2% w/w, and E= encapsulated PSE addition at 1% and 2% w/w.
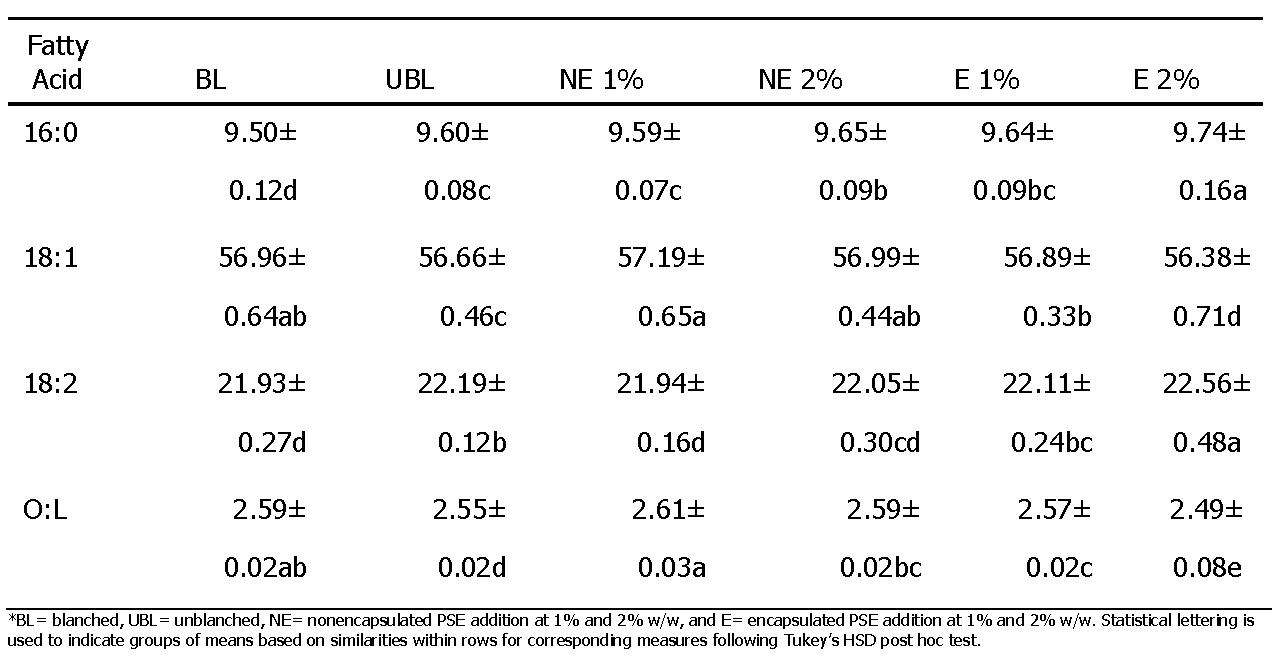
The overall average content (percent total) and standard deviation of selected fatty acids measured over time for six peanut butter treatments*.
Headspace Analysis
Hexanal and pentanal were chosen for headspace analysis due to their strong correlation with flavor scores (Warner et al., 1978). Aldehydes, such as hexanal and pentanal, are formed during the process of lipid oxidation as fatty acid radicals are degraded into smaller volatile end products (Frankel, 2005). Volatile compounds such as hexanal and pentanal have been correlated with the presence of off-flavors such as “cardboardy” and “painty” (Litman and Numrych, 1978; Forss, 1972). Headspace analysis using gas chromatography was performed at each time point in duplicate for three samples corresponding to each treatment. The concentration of hexanal and pentanal were determined using response factors of an internal standard of 3-heptanone to pentanal and hexanal. No significant difference between treatment means for both pentanal and hexanal content was found but there was a significant difference within all treatments over time for both hexanal and pentanal. The change in hexanal content over time was found to differ significantly for all treatments with time (Figure 4), while the change in pentanal did not differ between treatments over time (data not shown). At the last sampling point, the hexanal levels greatly increased which corresponded to the loss of linoleic acid seen in Figure 3.
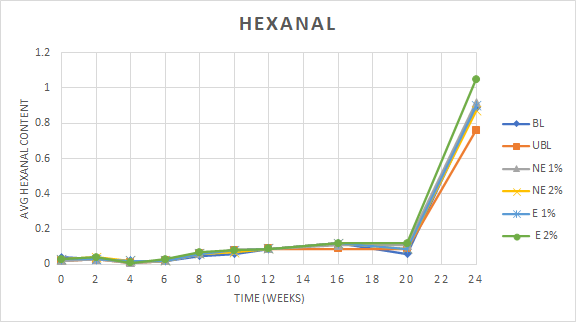
The change in hexanal content over time (weeks) for six peanut butter treatments, where BL= blanched, UBL= unblanched, NE= nonencapsulated PSE addition at 1% and 2% w/w, and E= encapsulated PSE addition at 1% and 2% w/w.
Phenolic compounds such as those present in the extracts from peanut skins are reported to able to inhibit the formation of lipid hydroperoxides by scavenging peroxyl radicals (McClements and Decker, 2017). The degradation reactions of the oxidized fatty acids resulting in the formation of decomposition products such as aldehydes in this study were evidently able to persist and increased over time. In summation, while a decrease in the formation of intermediary lipid hydroperoxides could be seen from the addition of peanut skin phenolics, the content of aldehyde end products such as hexanal and pentanal remained unchanged between treatments.
Descriptive Sensory Analysis
An important facet of an ingredient to a food is the flavor impact. The trained descriptive panel evaluated the flavor of each sample using the standard lexicon for peanuts. Initially, the results of the assessments were averaged and reported in Table 4. Principal Component Analysis (PCA) of the data was used to create Figure 5. From this, correlations between several variables were determined. Component 1 of the PCA biplot explains 37.4% of the variation in the overall data and loads the dark roast (DR) and raw beany (RB) attributes opposite each other vertically along this component, indicating a strong negative correlation that is to be expected as the beany flavor of peanuts is lost with the progression of the roasting process. Component 2 explains 15.8% of the variation in the overall data and places desirable attributes such as roast peanutty (RP), sweet aromatic (SA), and sweet (Sw) horizontally and opposite from undesirable attributes such as astringency (Astr), cardboardy/stale (CS), bitter (bit), and painty/old oil (P).
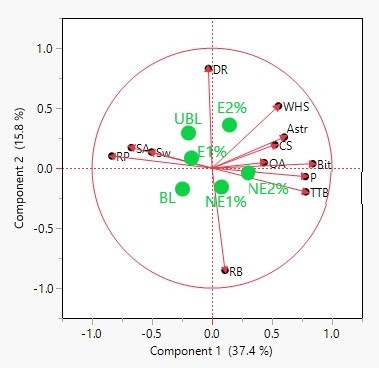
Biplot generated through principal component analysis (PCA) for the grouping of sensory attributes based on statistical correlations, where RP= roast peanutty, SA= sweet aromatic, Sw= sweet, DR= dark roast, RB= raw beany, WHS= woody/hulls/skins, Astr= astringency, CS= cardboardy/stale, OA= other aromatics, Bit= bitter, P= painty/old oil, and TTB= tongue and throat burn. The proximity of the treatments to attributes on the biplot indicates correlation, where BL= blanched, UBL= unblanched, NE= nonencapsulated PSE addition at 1% and 2%, and E= encapsulated PSE addition at 1% and 2% w/w.
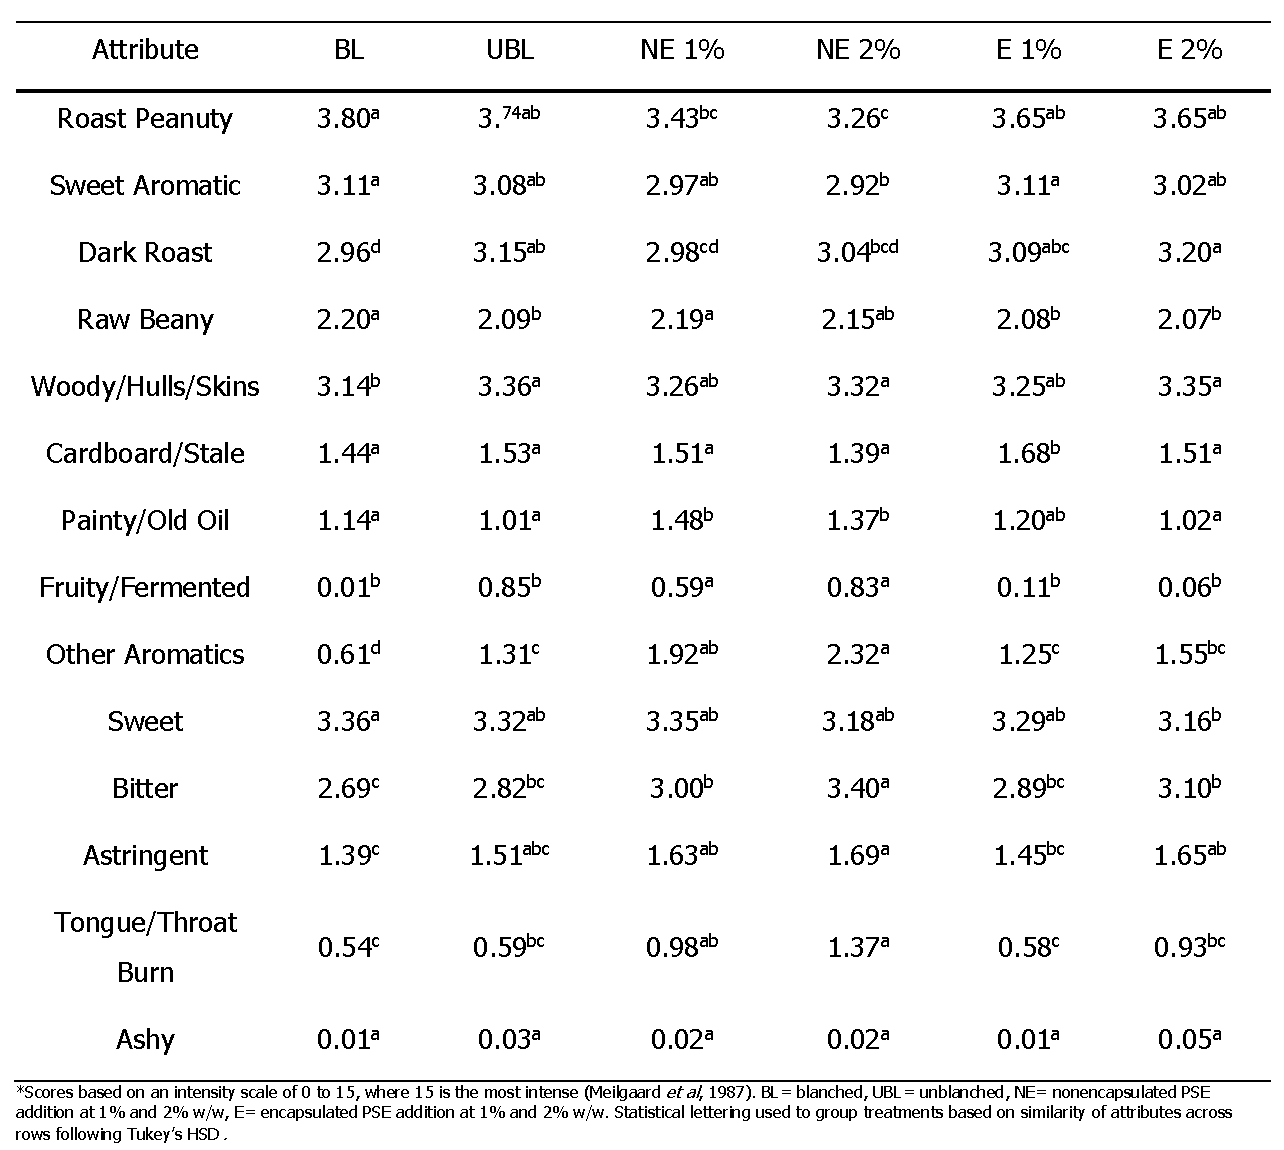
The overall average (n=7) intensity scores* of the descriptive sensory attributes for the six peanut butter treatments.
The placement of treatments on the PCA biplot (Figure 5) relates the treatments with the prevalence of attributes. Overall, treatments BL, UBL, and E 1% were more closely associated with desirable attributes such as RP, SA, and Sw. Conversely, additions of NE were more closely associated with negative attributes such as P and the ‘other aromatic’ (OA) flavor. Peanut butter treatments with additions presented with a notable flavor at higher concentrations that was detected by panelists and reported as an OA flavor. This flavor was described differently by several of the panelist and possibly the result of several compounds that were either associated with the additives or the result of oxidation of the either the peanut butter matrix or the additives. Some described it as ‘fruity’, although this flavor was not the same as the fruity/fermented flavor defined in the peanut lexicon but rather with an increased stone fruit flavor which had tree nut like overtones. Others described it as a taste like that of paper or nut skins.
One-way repeated measures MANOVA was performed to determine if statistically significant differences were apparent both within and treatments over time for three attributes typically affected by extended storage conditions: roast peanutty (RP), painty/old oil (P), and cardboardy/stale (CS). All three attributes were found to differ significantly over time both within and between treatments and have been depicted in Figure 6. The decrease in the desirable RP was paralleled by the corresponding increases in the undesirable P and CS. The intensity of the off flavors increased to levels above that of RP regardless of the treatment. This proved that regardless of the additive used, encapsulated or not or leaving the peanuts unblanched (UBL) did not prevent or even slow the oxidation of the peanut butter matrix responsible for the development of off flavors and the loss or masking of the desired roast peanut flavor. The addition of the OA flavors was also a detriment as the panelists did not consider them as desirable flavors. Although the hexanal content greatly increased over the final month of the study (Figure 4), the actual flavor of this compound was most probably included by the panelists as part of the P flavor attribute which continued to increase with the storage time.
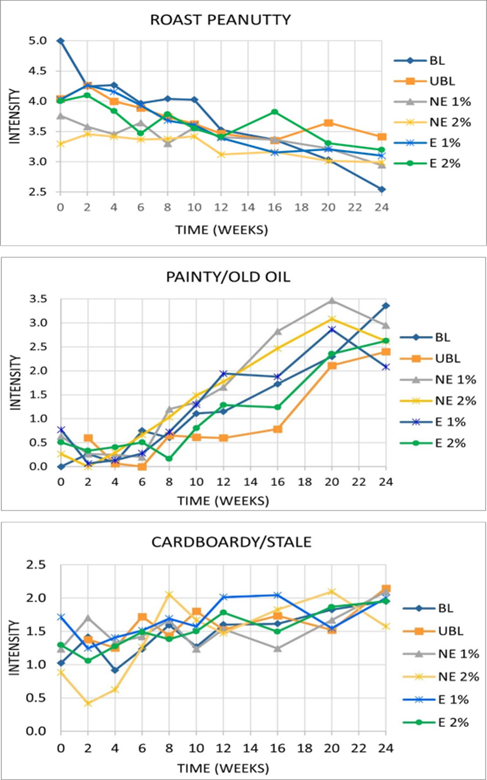
The change over time (weeks) in the average intensity score (on a scale of 1-15, where 15= most intense) for the roast peanutty, painty/old oil, and cardboardy/stale attributes of the six peanut butter treatments, where BL= blanched, UBL= unblanched, NE= nonencapsulated PSE addition at 1% and 2% w/w, and E= encapsulated PSE addition at 1% and 2% w/w.
Peanut skin extracts showed some ability to inhibit the development of lipid peroxides that act as substrates for the process of lipid oxidation responsible for the development of rancidity in peanut butters. However, the practicality of utilizing peanut skin extract additions in foods to address the issue of lipid oxidation depends largely on the impact of additions on the characteristic physical and sensory properties of the food that consumers expect. There is a distinctive appearance and flavor associated with peanut butter that can be altered by such additions. Additions of encapsulated and nonencapsulated peanut skin extract were found to significantly alter the overall moisture content and color and could therefore affect consumer acceptance and the subsequent viability of products containing such additions in the market.
Peanut skin extract additions decreased the peroxide value in peanut butters that are correlated with rancidity at both 1% and 2% w/w additions, with no added benefit at greater concentrations. Higher concentrations of extract additions led to an increase in uncharacteristic and undesirable sensory attributes, such as the ‘other aromatic’ flavor. While the peroxide value of peanut butters treated with peanut skin extracts were lower, there was no significant difference in the overall intensity rating of attributes such as P and CS that are undesirable and typically associated with extended storage conditions and rancidity in peanut butters. Additionally, the development of compounds associated with such off-flavors, such as hexanal and pentanal were not significantly affected by extract additions. Encapsulation of peanut skin extracts was shown to inhibit the development of undesirable off-flavors when used with other food matrices but not with the peanut butter in this study (Christman et al., 2019; Dean et al., 2016). Skin extract additions were found to increase the free fatty acid content of peanut butters initially and overall, and therefore such additions could potentially be subjected to degradation due to extraction and storage conditions prior to usage. While the hypothesis of this work was that PSE would have antioxidant effects on the peanut butter matrix, the interactions were not simplistic but rather seem to confirm that there are cases where the phenolic compounds can be prooxidants as has been discussed in the literature (Babich et al., 2011; Gao et al., 2022). In addition, the PSE were prepared by extractions using polar solvent systems. The reincorporation of these ingredients into a matrix with a high lipid content may interfere with their bioactivity. It maybe that a lipid carrier would be needed to achieve a contact that can offer protection to the fatty acids to present their oxidation and degradation. The preparations used here are predicted to not have high consumer acceptance due to the color changes and the introduction of flavors from the additives. It may be possible that compounds extracted from peanut skins may be optimized through further investigations of the most effective concentration, extraction method, and encapsulation of extracts.
Acknowledgements
This project was funded by USDA ARS CRIS project number 6070-43440-012-00D. The authors gratefully acknowledge Olam International, specifically, Mr. Jim Fenn for the peanut skins for the extraction and Mr. Robert Moore for the providing the roasted peanuts used in this study. The authors gratefully acknowledge the service of the USDA, ARS Food Science and Market Quality and Handling Unit descriptive sensory panelists. The authors declare no conflicts of interest.
Disclaimer
Mention of trade names or commercial products in this publication is solely for the purpose of providing specific information and does not imply recommendation or endorsement by the U.S. Department of Agriculture.
Literature Cited
AOCS. 2003. Official Methods and Recommended Practices of the AOCS. 5th ed. American Oil Chemists’ Society. Champaign, IL.
APC . 2020. The Peanut Industry. American Peanut Council. https://www.peanutsusa.com/ about-apc/the-peanut-industry.html.
Babich H., Schuck A.G., Weisburg J.H. and Zuckerbraun H.L. 2011. Research strategies in the study of the pro oxidant nature of polyphenol nutraceuticals. J. Toxicol 2011:467305. https://doi.org/10.1155%2F2011%2F467305.
Bannon C.D., Craske J.D., Hai N.T., Harper N.L. and O’Rourke K.L. 1982. Analysis of fatty acid methyl esters with high accuracy and reliability II: methylation of fats and oils with boron trifluoride-methanol. J. Chrom. 247:63-69.
Christman L.M., Dean L.L., Allen J.C., Godinez S.F., and Toomer O.T. 2019. Peanut skin phenolic extract attenuates hyperglycemic responses in vivo and in vitro. PLOS ONE 14(3):e0214591. https://doi.org/10.1371/journal.pone.0214591.
Cobb W.Y. and Johnson B.R. 1973. Physiochemical properties of peanuts. In Wilson C.T. (ed.). Peanuts: Culture and Uses. pp. 209-263. American Peanut Research and Education Society. Stillwater, OK.
Constanza K.E., White B.L., Davis J.P., Sanders T.H. and Dean L.L. 2012. Value-added processing of peanut skins: antioxidant capacity, total phenolics, and procyanidin content of spray-dried extracts. J. Agric. Food Chem. 60:10776-10783.
Damodaran S. 2017. Water and ice relations in foods. In Damodaran S. and Parkin K.L. (eds.), Fennema’s Food Chemistry. pp. 19-90. CRC Press. Boca Raton, FL.
Dean L.L. 2020. Extracts of peanut skins as a source of bioactive compounds: Methodology and applications. Appl. Sci. 10(23):8546. https://doi.org/10.3390/app10238546.
Dean L.L., Klevorn C.M. and Hess B.J. 2016. Minimizing the negative flavor attributes and evaluating consumer acceptance of chocolate fortified with peanut skin extracts. J. Food Sci. 81:S2824-2830.
Fernandes R.P.P., Trinidade M.A., Tonin F.G., Pugine S.M.P., Lima C.G. and Lorenzo J.M. 2017. Evaluation of oxidative stability of lamb burger with Origanum vulgare extract. Food Chem. 233:101-109.
Forss D.A. 1972. Odor and flavor compounds from lipids. Prog. Chem. Fats Other Lipids 13:177-258.
Francisco M.L. and Resurreccion A.V.A. 2012. Antioxidant capacity and sensory profiles of peanut skin infusions. Food Sci. Tech. 47:189-198.
Frankel E. 2005. Lipid Oxidation (2nd ed.). The Oily Press. Bridgewater, U.K.
Gao Q., Li Y., Li Y., Zhang Z. and Liang Y. 2022. Antioxidant and prooxidant activities of phenolic acids commonly existed in vegetables and their relationship with structures. Food Sci. Tech. 42:e07622. DOI:https://doi.org/10.1590/fst.07622.
Hathorn C.S. and Sanders T. H. 2012. Flavor and antioxidant capacity of peanut paste and peanut butter supplemented with peanut skins. J. Food Sci. 77:S407-S411.
Huber K.C. and BeMiller J.N. 2017. Carbohydrates. In Damodaran S. and Parkin K.L. (eds.), Fennema’s Food Chemistry. pp. 91-169. CRC Press, Boca Raton, FL.
HunterLab 2015. The basics of color perception measurement. https://support.hunterlab.com/hc/en-us/categories/201319586-Color-Theory. Accessed October 24, 2022.
Johnsen P.B., Civille C.V., Vercellotti J.R., Sanders T.H. and Dus C.A. 1988. Development of a lexicon for the description of peanut flavor. J. Sens. Stud. 3:9-17.
Larrauri M., Barrionuevo M.G., Riveros C., Mestrallet M.G., Zunino M.P., Zygadlo A., Grosso N.R. and Nepote V. 2013. Effect of peanut skin extract on chemical stability and sensory properties of salami during storage. J. Sci. Food Agric. 93:1751-1757. https://doi.org/10.1002/jsfa.5965.
Lewis W.E., Harris G.K., Sanders T.H., White B.L. and Dean L.L. 2013. Antioxidant and anti-inflammatory effects of peanut skin extracts. Food Nutri. Sci. 4(8A):Article 35240. http://www.scirp.org/journal/PaperInformation.aspx?PaperID=35240.
Litman I. and Numrych S. 1978. The role lipids play in the positive and negative flavors of food. In Supran M.K. (ed.). Lipids as a Source of Flavor. pp. 1-17. American. Chemical. Society. Chicago, IL.
Lorenzo J.M., Pateiro M., Dominguez R., Barba F.J., Putnik P. and Kovacevic D.B. 2018. Berries extracts as natural antioxidants in meat products: a review. Food Res. Int. 106:1095-1104.
Ma Y., Kerr W.L., Swanson R.B., Hargrove J.L. and Pegg R.B. 2014. Peanut skins-fortified peanut butters: Effect of processing on the phenolic content, fibre content and antioxidant activity. Food Chem. 145:883-891.
McClements D.J. and Decker E.A. 2017. Lipids. In Damodaran S. and Parkin K.L. (eds.), Fennema’s Food Chemistry. pp. 171-233. CRC Press, Boca Raton, FL.
Meilgaard M., Civille G.V. and Carr B.R. 1987. The Spectrum™ Descriptive Analysis Method: Chapter 11. In Sensory Evaluation Techniques (3rd ed.). pp. 173-229. CRC Press. Boca Raton, FL.
Mintel 2018. Nut-Based Spreads and Sweet Spreads – US – September 2018. Retrieved from https://reports.mintel.com/display/860655/.
Moss J.P. and Rao V.R. 1995. The peanut-reproductive development to plant maturity. In Pattee H.E. and Stalker H.T. (eds.). Advances in Peanut Science. pp. 1-13. American Peanut Research and Education Society, Stillwater, OK.
Nepote V., Grosso N.R. and Guzman C.A. 2005. Optimization of extraction of phenolic antioxidants from peanut skins. J. Sci. Food Agric. 85:33-38.
Pominski J., McCourtney E.J., Stansbury M.F., D’Aquin E.L. and Vix H.L.E. 1951. Lye-dipping for the removal of objectionable skin color from various grades of shelled Spanish peanuts. J. Amer. Oil Chem. Soc. 28:513-516.
Reed K.A., Sims C.A., Gorbet D.W. and O’Keefe S. 2002. Storage water activity affects flavor fade in high and normal oleic peanuts. Food Res. Int. 35:769-774.
Rocha-Parra D.F., Lanari M.C. Zamora M.C. and Chirife J. 2016. Influence of storage conditions on phenolic compounds stability, antioxidant capacity and colour of freeze-dried encapsulated red wine. LWT Food Sci. Tech. 70:162-170.
Rozalli N.H.M., Chin N.L., Yusof Y.A. and Mahyudin N. 2016. Quality changes of stabilizer-free natural peanut butter during storage. J. Food Sci. Tech. 53:694-702.
Sanders T.H., Vercellotti J.R., Crippen K.L. and Civille G.V. 1989. Effect on maturity on roast color and descriptive flavor of peanuts. J. Food Sci. 54:475-477.
Sobolev V.S. and Cole R.J. 2003. Note on utilisation of peanut seed testa. J. Sci. Food Agric. 84:105-111.
Stansbury M.F., Field E.T. and Guthrie J.D. 1950. The tannin and related pigments in the red skins (testa) of peanut kernels. J. Amer. Oil Chem. Soc. 27:317-321.
Statista . 2021. Consumption of peanut butter in the U.S 2020. https://www.statista.com/statistics/281221/us-households-consumption-of-peanut-butter/.
USDA. 2021. Peanut stocks and processing. Released July 28, 2021, by the NASS, Agric. Stats. Board, USDA. https://usda.library.cornell.edu/concern/publications/02870v87z.
Warner K., Evans C.D., List G.R., Dupuy H.P., Wadsworth J.I. and Goheen G.E. 1978. Flavor score correlation with pentanal and hexanal contents of vegetable oils. J. Amer. Oil Chem. Soc. 55:252-256.
Worthington R.E. and Holley K.T. 1967. The linolenic acid content of peanut oil. J. Amer. Oil Chem. Soc. 44:515-516.
Xiao H. and Ho C.T. 2017. Bioactive food components. In Damodaran S. and Parkin K.L. (eds.), Fennema’s Food Chemistry. pp. 865-903, CRC Press, Boca Raton, FL.
Young J.H., Whitaker T.B., Blankenship P.D., Brusewitz G.H., Troeger J.H., Steele J.L. and Person N.K. 1982. Effect of oven drying time on peanut moisture determination. Trans. Amer. Soc. Agric. Bio. Eng. 25:491-496.
Yu J., Ahmedna M., Goktepe I. and Dai J. 2006. Peanut skin procyanidins: composition and antioxidant activities as affected by processing. J. Food Comp. Anal. 19:364-371.