


Introduction
Thecaphora frezzii Carranza & J.C. Lindq., the fungus causing peanut smut, is perhaps the most concerning emerging pathogen for the global peanut industry (Australian Biosecurity Import Conditions, 2017; Rago et al., 2017; El-Lissy, 2017). First described in 1962, T. frezzii is named after Mariano Frezzi, a plant pathologist based in Manfredi, Argentina, who received diseased samples of a wild peanut, Arachis kuhlmannii GKP 9824, that had been collected in Mato Grosso do Sul, Brazil, by Krapovickas and Gregory (Carranza and Lindquist, 1962; Krapovickas and Gregory, 2007). Unable to identify the fungus, Frezzi forwarded the samples to Carranza and Lindquist at the National University of La Plata, Argentina, for identification. Peanut smut did not appear in commercial production fields until decades later, when it was discovered in three fields in north-central Córdoba Province in 1995 (Marinelli et al., 2008). Thecaphora frezzii (variant spelling, T. frezii; Article 60.8 in Turland et al., 2018) has since spread to all peanut-producing provinces in Argentina (Cazón et al., 2018). The soilborne teliospores of T. frezzii are thought to germinate in response to peg exudates, thus infecting plants only after pegs have entered the soil (Marraro Acuña et al., 2013; Rago et al., 2017). Preharvest disease assessments are difficult because signs of the fungus and disease symptoms are only visible on pods in infected plants (Rago et al., 2017). Sori are produced on kernels, sometimes displacing entire kernels with teliospores (Astiz Gassó et al., 2008), and spores are dispersed through infested equipment, infected seed, and by wind during harvest (Rago et al., 2017). Commercial cultivars currently grown in Argentina are highly susceptible to peanut smut (Rago et al., 2017), and severely infested fields may have more than 50% disease incidence (Oddino et al., 2010; Bonessi et al., 2011; Marraro Acuña et al., 2013). As a result, at least two major peanut-producing countries, Australia and the U.S., have enacted phytosanitary restrictions on peanut originating from Argentina (Australian Biosecurity Import Conditions, 2017; El-Lissy, 2017).
Multiple efforts are currently in progress to identify resistance in wild and cultivated germplasm and to breed for high-yielding resistant cultivars (Chamberlin et al., 2018; Baldessari et al., 2019; de Blas et al., 2019; Bressano et al., 2019; Wann et al., 2020). However, a significant roadblock to screening for peanut smut resistance is the time and labor required to phenotype germplasm. Symptoms and signs of T. frezzii are visible only on pods and kernels and can vary from visibly normal pods with a single small sorus on a kernel, to hypertrophied pods with kernels completely replaced by reddish-brown teliospores (Marraro Acuña et al., 2014; Rago et al., 2017; Cazón et al., 2018). The current screening method consists of opening each pod by hand and inspecting it visually for incidence (i.e., the presence or absence of T. frezzii in pods), and, sometimes, disease severity (amount of disease within pods) (Chamberlin et al., 2018; de Blas et al., 2019; Bressano et al., 2019; Wann et al., 2020). Because healthy peanut seed differs chemically and physically from fungal spores, it should be possible to develop more efficient methods for phenotyping smut resistance.
Few alternative approaches for phenotyping peanut smut have been investigated. Due to differences in density between healthy and teliospore-filled kernels, Argentine researchers found that X-ray imaging could distinguish the two groups (Valente et al., 2014, 2017). In the food and agriculture industry, X-ray imaging has been used to detect flawed produce and grain (Han et al., 1992; Kim and Schatzki, 2000; Mathanker et al., 2013), defects in many packaged foods, and bone fragments in meat (Haff and Toyofuku, 2008). Recently, Sorensen et al. (2020) used X-ray imaging to non-destructively assess maturity in peanut pods. Unfortunately, X-ray equipment may be too costly for most peanut breeding programs and requires handling radioactive material and monitoring radiation exposure (Haff and Toyofuku, 2008; Mathanker et al., 2013). There are, however, many other non-destructive technologies for discriminating differences in physical properties (Chen and Sun, 1991). For example, gravity separators, widely used in grain processing plants (Wu et al., 1999) and the mining industry (Burt, 1999), use a combination of gravity, air, vibration, and slope to separate products. Gravity separators can separate healthy kernels from lighter, mycotoxin-contaminated wheat kernels (Tkachuk et al., 1991). In peanut, Rucker and colleagues (1994) used a gravity separator to classify pods of Florunner, which had been grown under drought stress, into maturity groups. The gravity separator successfully separated peanuts into lots varying in maturity (and quality), and the least dense pods had markedly higher levels of aflatoxin than the denser mature pods. Another approach, free-fall impact acoustics, is inexpensive and can distinguish differences in density based upon differences in sound waves generated by falling objects. Impact acoustics identified closed- from open-shell pistachios (Cetin et al., 2004), empty and full hazelnuts (Onaran et al., 2005), and healthy and damaged wheat kernels (Pearson et al., 2007). It is unclear, though, how well these separation methods can differentiate between smutted pods and healthy immature pods and “pops” (empty pods), which are also less dense than mature healthy pods.
Another issue affecting the utility of more efficient phenotyping methods is the relationship between disease incidence and severity. If the correlation between incidence and severity is low, both disease measurements may be necessary to screen germplasm for resistance. The ideal smut-resistant peanut has both low incidence and severity; genotypes with many infected pods, even with low disease severity, and those with few but severely infected pods, are both likely to be unacceptable to manufacturers and breeders. However, if the correlation between incidence and severity is high, incidence data alone can be sufficient for screening germplasm (Seem, 1984). Rating incidence for many diseases, including peanut smut, is easier than assigning disease severity ratings, which can be somewhat subjective (Bock et al., 2010). The relationship between disease incidence and severity varies depending on the pathosystem (Seem, 1984; Bock et al., 2010), but there are conflicting reports for T. frezzii. Marraro Acuña and colleagues (2014) screened pods from 10 genotypes varying in resistance to peanut smut and found a high correlation (r = 0.98) between incidence and severity. As a result, they concluded that incidence data alone was sufficient for resistance screening. In contrast, a recent study of the U.S. mini-core found a low, albeit significant, correlation (r = -0.214) between T. frezzii incidence and severity using different methods (Wann et al., 2020). In addition to confirming the relationship between disease incidence and severity, the objectives of this project were to determine differences in density between mature and immature healthy and smut-infected pods.
Materials and Methods
Data for pod density and disease incidence and severity were collected from a subset of germplasm entries evaluated for peanut smut resistance during the 2018-2019 field season in the town of General Deheza, Córdoba Province, Argentina. Only one location was planted because of the large number of entries included in the disease trial, the time required to phenotype all germplasm entries, and limited availability of locations with high inoculum levels. The field used was known from previous experiments to have high soilborne levels of T. frezzii teliospores. The field was planted on 7 Nov. 2018 using an augmented grid design with three replications, using single plants as experimental units. Plants were dug 148 days after planting (3 Apr. 2019), and all pods from each plant were harvested by hand and placed in mesh bags to air dry for 76-87 days. Twelve genotypes had been screened the previous year and were selected to represent a range of susceptible and resistant genotypes. The susceptibilities of three genotypes, I-246, I-257, and I-262, were not known. If available, approximately 40 pods were examined from each plant (Table 1).
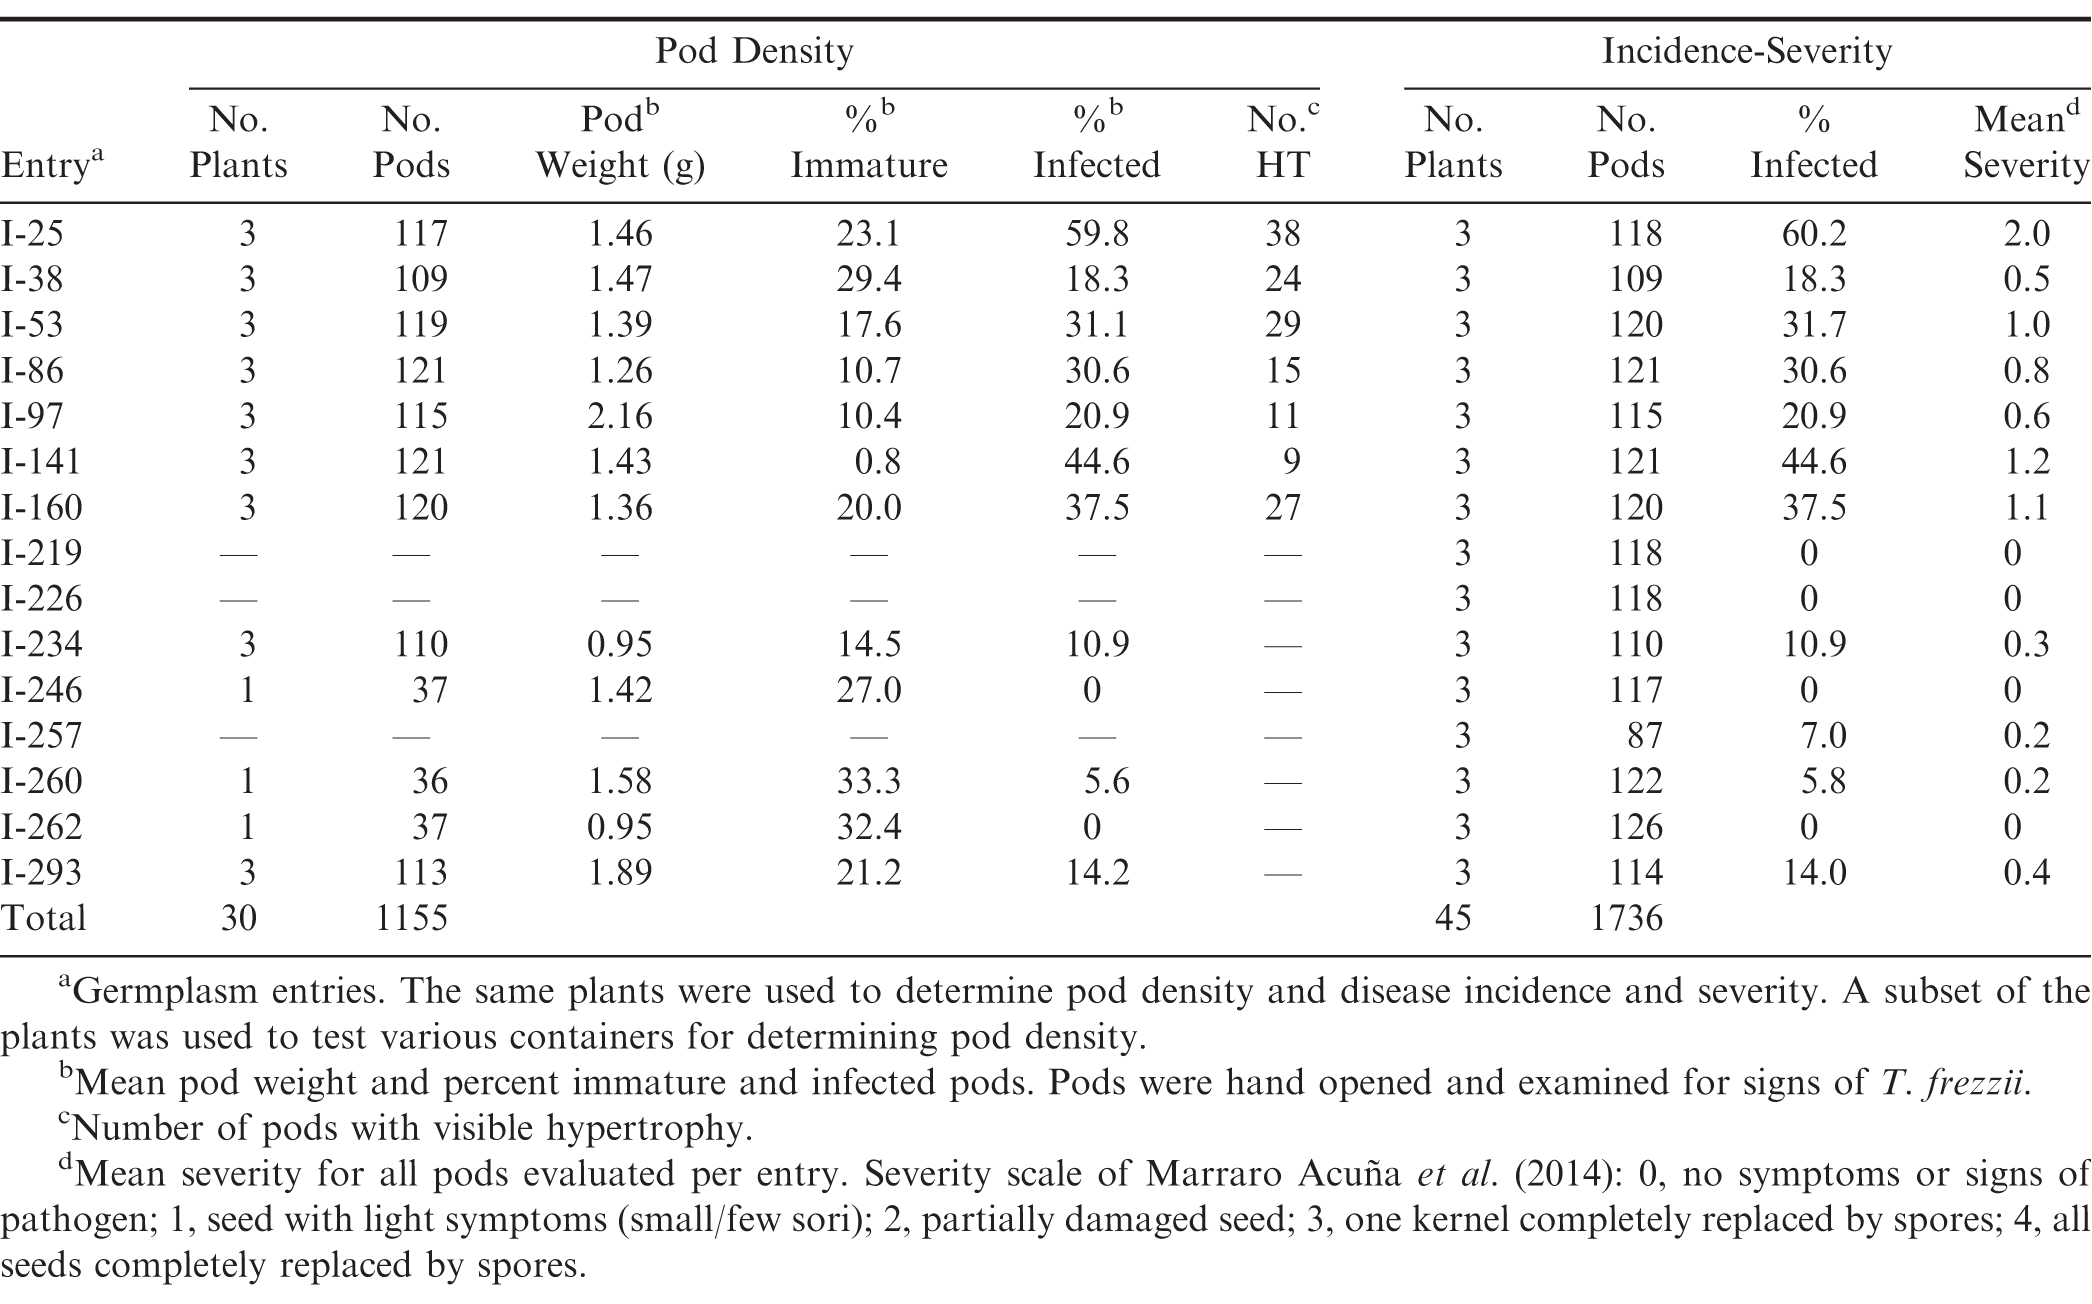
Material used for determining pod density and relationship between incidence and severity in pods grown in a Thecaphora frezzii-infested field.
Pod density was estimated using a modification of the pycnometer method. Because peanut pods are less dense than water (Agrawal et al., 1973; Rucker et al., 1994; Aydin, 2007), 40-50 mesh sand was used in place of a liquid to facilitate rapid measurements. A cylindrical plastic sample vial (37 mm internal diam., 88.4 mm tall), with a capacity of 62 ml and weight of 8.2 g, was used as a rudimentary pycnometer. The density of the sand (ρs) was determined by the equation,

To determine pod density, the vial was tilted slightly (ca. 60 degrees) and partially filled by pouring in sand from a small beaker. A pod was placed on top of the sand, ensuring that the pod was below the rim and not in contact with sides of the vial. The vial was then filled to overflowing with additional sand, and excess sand was removed from the top of the vial with the spatula. The pod weight (wp), and the weight of the vial containing the pod and sand (wt), were recorded. The volume of the sand (Vs) inside the vial surrounding the pod was calculated:


After pod density measurements were taken, each pod was opened by hand and rated for disease incidence, i.e., presence or absence of T. frezzii sori on the kernels. Pods were further rated for disease severity using the scale of Astiz Gassó et al. (2008): 0, pathogen not present; 1, seed with small/few sori; 2, partially damaged seed; 3, one kernel completely replaced by spores; and 4, all seeds completely replaced by spores. In addition, immature pods, including those with “pops” or empty pods, were noted. Immature pods were determined visually by comparing seed size and testa color to mature pods from the same plant. Lastly, the presence or absence of pod hypertrophy was also noted for a subset of the pods examined (Table 1). One person took all pod measurements and ratings.
Analyses were conducted in SAS Version 9.4. PROC MIXED was used to compare pod densities between mature and immature healthy and infected pods, with genotype as a blocking variable. Mean severity and incidence of pods from individual plants were used to examine the Spearman correlation between disease incidence and severity with PROC CORR. The relationship between hypertrophy and incidence (presence of the fungus inside the pod) was examined using PROC FREQ. The proportion of pods with hypertrophy and internal sori were compared using a 2x2 contingency table and chi square tests.
Results and Discussion
Several laboratory containers, such as a conical centrifuge tube and small beakers, were also tested as potential crude pycnometers on a subset of the plants. Of these, the cylindrical sample vial worked best because it accommodated all pod sizes, and the flat top and bottom facilitated weight measurements and removal of excess sand. Akcali and colleagues (2006) used a similar method, albeit with sawdust. Most researchers have used liquid displacement to measure peanut pod and kernel density and volume, but those setups are generally more complicated and less suitable for rapidly measuring large number of pods: sinkers were used to submerge pods (Agrawal et al., 1973); toluene instead of water (Aydin, 2007) or coatings (Gnanasekharan et al., 1992) were used to reduce water absorption; and a second measurement of the displaced liquid was required (Agrawal et al., 1973; Gnanasekharan et al., 1992; Rucker et al., 1994; Aydin, 2007; Wu et al., 2015). While the sand we used was not completely uniform in particle size (40-50 mesh; mean density = 1490 g/L), this method for estimating density was reasonably repeatable, with mean standard deviations of 0.21 g for wt (weight of vial, pod, and sand; = 96.55 g) and 16.95 g/L for the densities of the five pods tested. The 15 germplasm entries varied in pod weights (Table 1) and included typical Spanish, runner, Virginia, and Valencia market-type pod sizes and shapes. The number of locules within pods had also been noted for a subset (n = 253) of infected and immature pods from 13 genotypes, and pods had between 1 to 4 locules (data not shown). Our density estimates for mature healthy pods were similar to those reported by Aydin (2007) and Akcali et al. (2006), i.e. 425-545 g/L and 370-580 g/L, respectively. Interestingly, these estimates are considerably less than the 620-690 g/L reported by Rucker et al. (1994) or the 640-1050 g/L reported by Wu et al. (2015). The different approaches used to measure density and the different peanut genotypes measured may help explain this discrepancy.
As expected, mature pods were significantly more dense than immature pods, and this relationship was true for both healthy and T. frezzii-infected pods (Table 2). There was nearly a two-fold difference between the mean densities of mature and immature healthy pods, and comparisons using both groups combined were mostly non-significant. The mean density of all healthy pods did not differ significantly from that of all infected and mature infected pods and was barely greater than immature infected pods. The small sample size of the available immature infected pods (n = 30, 2.6% of all measured pods) may have affected the latter analysis. In contrast, the densities of mature and immature healthy pods, when analyzed separately, were significantly greater or smaller, respectively, than all infected, mature infected, and immature infected pods. These results indicate that bulked, density-based separation methods, such as gravity separators, may be useful for rapidly phenotyping peanut smut if high levels of accuracy are not needed. The accuracy would be less than that obtained from hand phenotyping due to variation in density within the pod classes (SD, Table 2). Alternatively, density-based separators could be used to reduce the number of pods to be manually screened since mature and immature healthy pods appear to occupy the extremes of pod density.
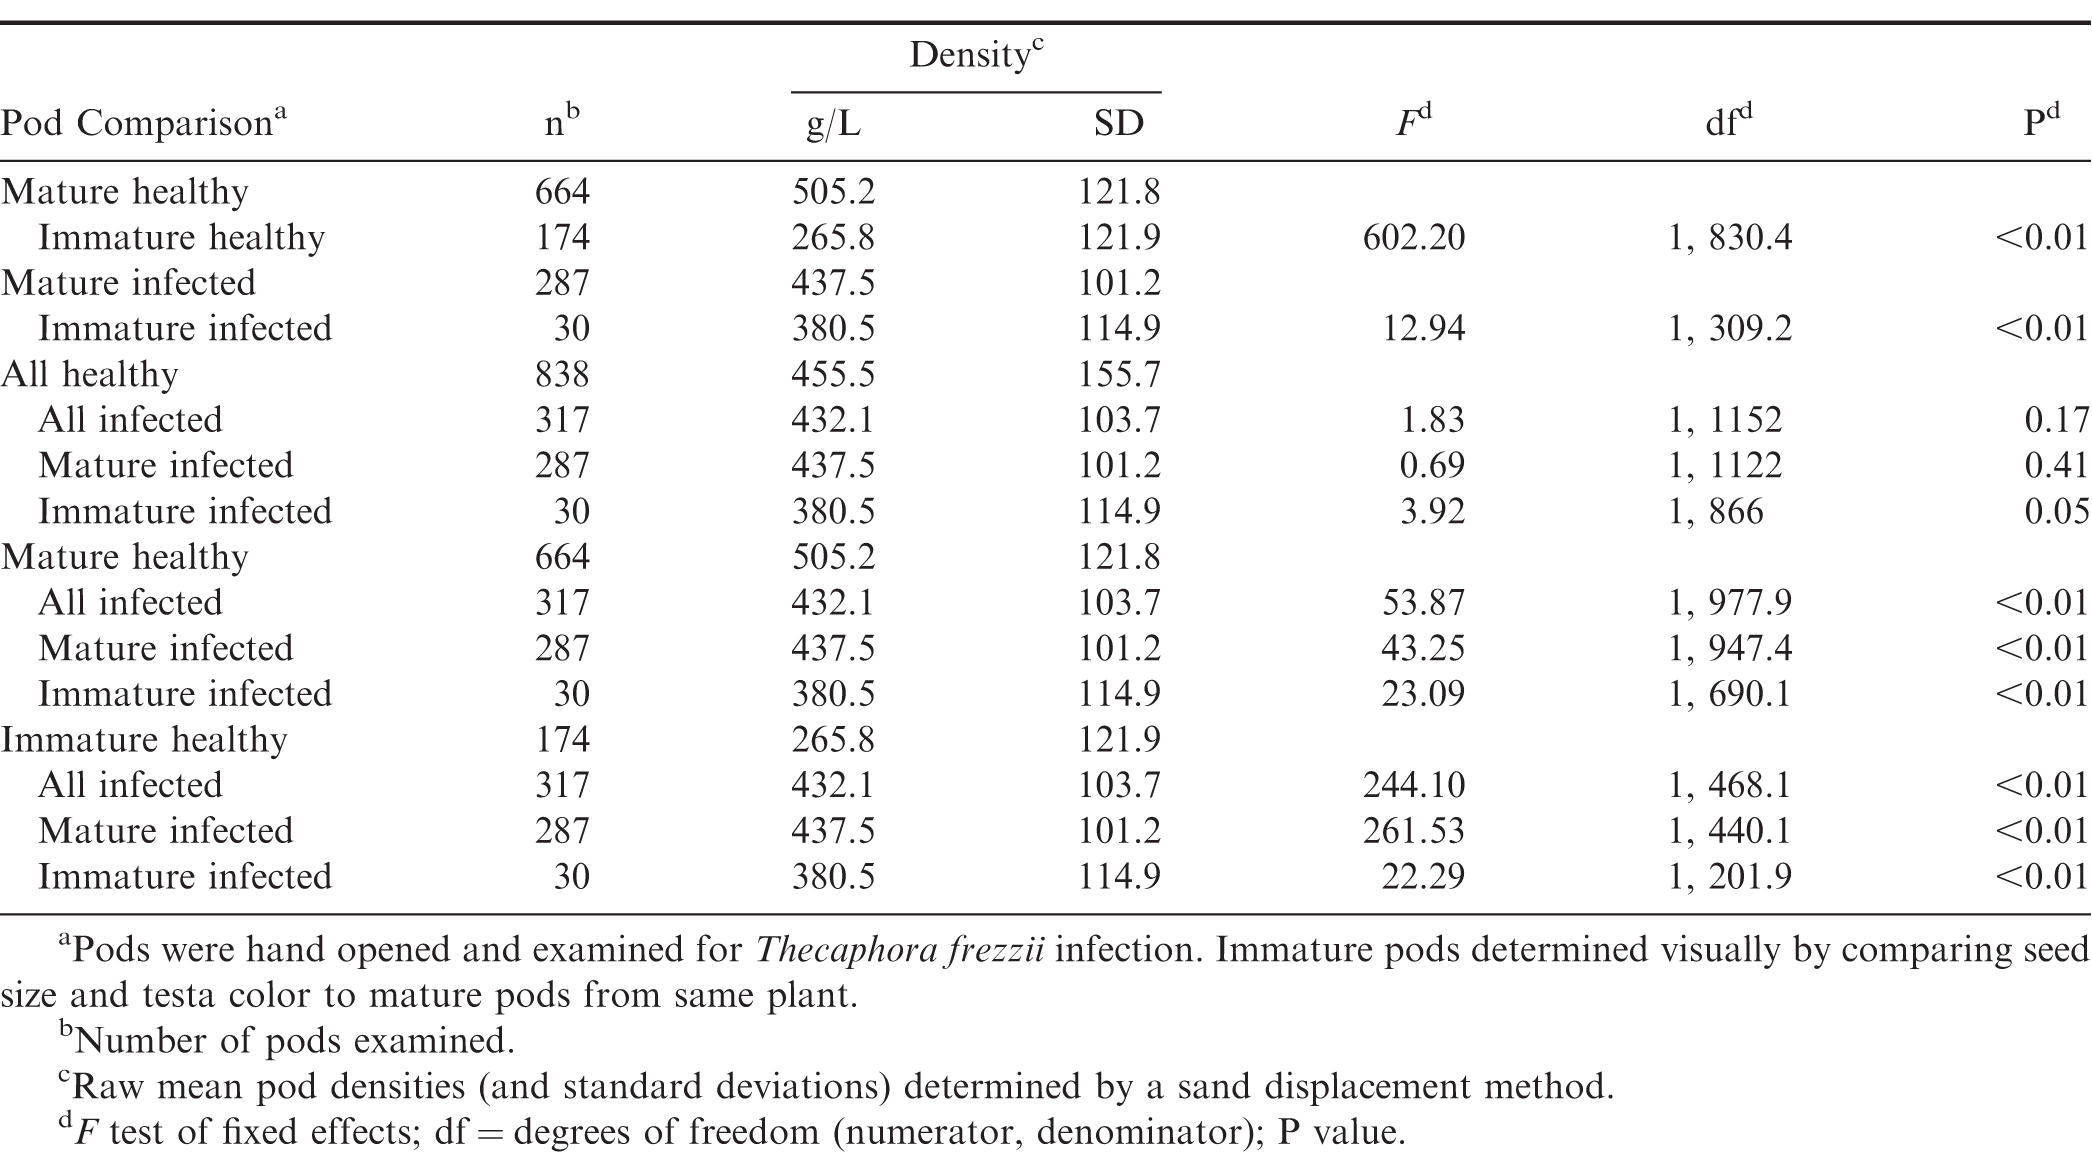
Differences in pod density between healthy and Thecaphora frezzii-infected pods varying in maturity.
Disease incidence among the 45 rated plants ranged from zero to 72% infected pods, and the mean pod severity varied from zero to 2.39 in one I-25 plant (Figure 1). Spearman correlation between disease severity and incidence was high (r = 0.996, P < 0.01; Fig. 1), consistent with the results of Marraro Acuña and colleagues (2014). It is unclear why Wann et al. (2020) obtained disparate results (r = -0.214), but one possible explanation may be the different method they used to calculate mean severity. Secondly, the potential presence of mixed genotypes in the purified U.S. mini-core collection may have contributed variability. Genetic variation may still be present within some accessions of the purified mini-core collection since they were selected using phenotypic characteristics (Chen et al., 2014). In contrast, all entries used by Marraro Acuña et al. and in this study were genetically uniform. Lastly, there were considerable differences in the number of entries examined. Wann et al. evaluated 104 of the 112 U.S. mini-core accessions, and their results may better reflect the actual variability of domesticated peanut in response to peanut smut. While a broad range of susceptibility to T. frezzii were represented, fewer than 20 genotypes were screened here and by Marraro Acuña and colleagues. These differences may account for the discrepancies among the studies, and more work may be needed to confirm the true relationship between peanut smut incidence and severity. Nonetheless, our results suggest that alternative phenotyping approaches to hand-rating will need to be quite accurate to identify highly resistant germplasm even if there is a high correlation between incidence and severity. Errors in measuring incidence are most likely to occur when severity is low—i.e., small solitary sori are more likely to be missed—but a mean severity of 1.0 corresponded to approximately 35% disease incidence (Fig. 1). Disease incidences of 0.43-3.58% (Bressano et al., 2019), 12% (de Blas et al., 2019), and 10% (Chamberlin et al., 2018) are considered highly resistant or resistant by peanut breeders.
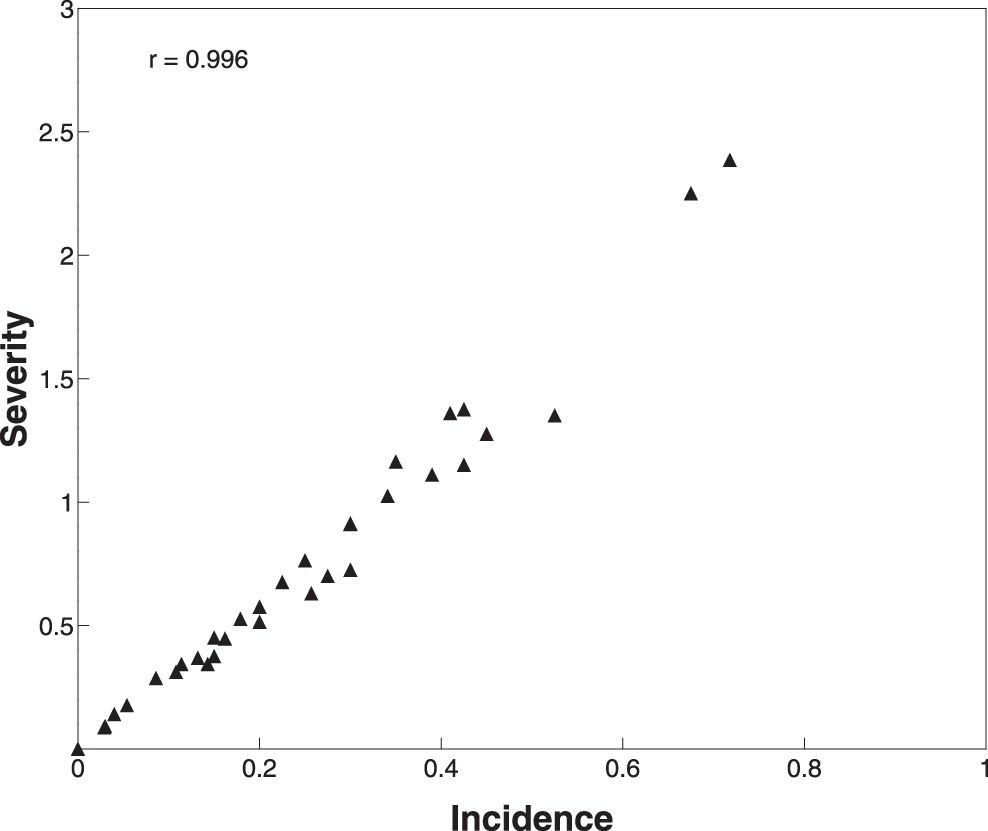
Spearman correlation between mean severity and incidence in all Thecaphora frezzii-infected pods collected from each plant (n = 45, 15 genotypes). Pods were hand opened and examined for signs of T. frezzii and rated using the severity scale of Astiz Gassó et al. et al. (2008): 0, no symptoms or signs of pathogen; 1, seed with small/few sori; 2, partially damaged seed; 3, one kernel completely replaced by spores; 4, all seeds completely replaced by spores.
While there was a significant relationship between pod hypertrophy and disease incidence (P < 0.01), hypertrophic pods were a less reliable indicator of T. frezzii infection, at least within susceptible genotypes. For the entries evaluated, the probability of pod hypertrophy was only 11% if a pod was infected, and 7% if a pod was not infected (Table 3). Errors in scoring hypertrophy may partially explain the 59 pods exhibiting hypertrophy without internal fungal presence, but hypertrophic pods without signs of T. frezzii have been observed (Rodriguez and Baldessari, unpublished data). Host genotype also appears to influence hypertrophy. For example, nearly 45% of pods from entry I-141 were infected, but only nine (7%) hypertrophic pods were observed. In contrast, entry I-38 had 18% infection and 29 (24%) pods with hypertrophy. These results suggest that the presence or absence of hypertrophy may be less useful as an indicator of infection within susceptible genotypes. In addition, determining the presence of hypertrophy was also somewhat subjective. While some pods were grossly malformed compared to visibly normal pods from the same plant, there was a continuum of malformation, and hypertrophy in other pods was less obvious. Hypertrophy is included in one severity scale used to rate peanut smut (Rago et al., 2017; de Blas et al., 2019; Bressano et al., 2019).
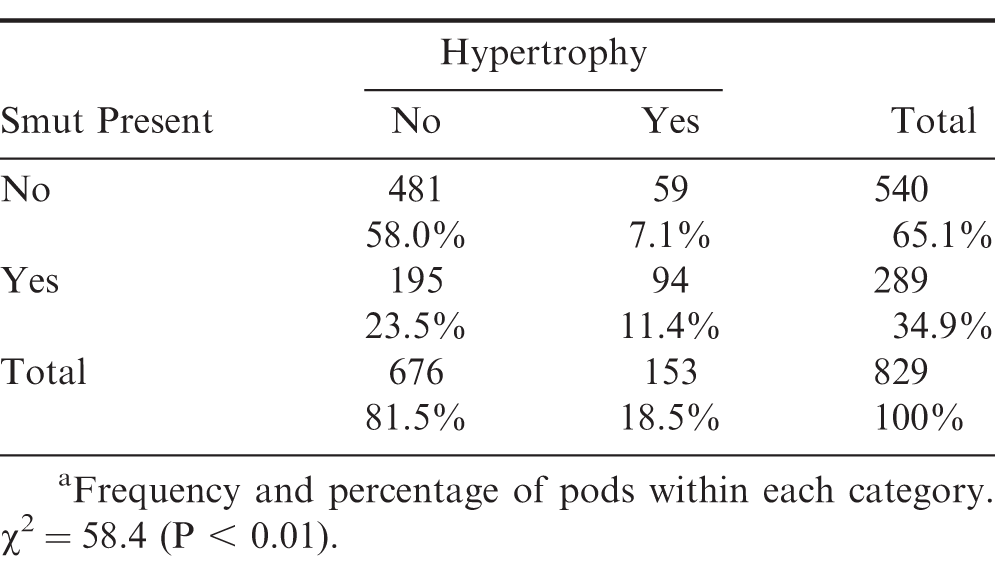
Relationship between pods with and without hypertrophy and Thecaphora frezzii infection.a
In conclusion, these results suggest that pods may be loosely separated by density into mature healthy, infected, and immature healthy classes with equipment such as gravity separators. The sand displacement approach used here is not as accurate at measuring density as a pycnometer, but that said, highly significant differences in density among healthy and infected pods were found. However, additional verification for this approach is needed, such as first separating pods by density into maturity groups with a gravity separator, and then checking each group for disease incidence. Finally, because of the close positive correlation between disease incidence and severity, alternative phenotyping approaches to hand-screening pods may be able to focus solely on disease incidence.
Acknowledgements
The authors thank: María Virginia Barbuy, Luis Gimenez, Sergio Morichetti, and Angie Harting for technical assistance; Juliet Chu and Peggy Ozias-Akins for providing seed; Josh Clevenger for project support; and anonymous reviewers for helpful feedback. This research was supported by CRIS Project No. 3072-21220-008-00D, USDA-ARS National Plant Disaster Recovery System, and Mars Wrigley Confectionary. Mention of trade names or commercial products in this publication is solely for the purpose of providing specific information and does not imply recommendation or endorsement by the U.S. Department of Agriculture. USDA is an equal opportunity provider and employer.
Literature Cited
Agrawal, K.K., Clary, B.L. and Schroeder. E.W. 1973. Mathematical models of peanut pod geometry. Trans. ASAE 16: 315– 0319.
Akcali, I.D., Ince, A. and Guzel. E. 2006. Selected physical properties of peanuts. Int. J. Food Prop. 9: 25– 37.
Astiz Gassó, M.M., Leis, R. and Marinelli. A. 2008. Evaluación de incidencia y severidad del carbón de maní (Thecaphora frezii) en infecciones artificiales, sobre cultivares comerciales de maní, p. 118. In 1° Congreso Argentino de Fitopatología. Ciudad de Córdoba, Córdoba, Argentina (abstr.).
Australian Biosecurity Import Conditions. 2017. BICON - Case Alert. https://bicon.agriculture.gov.au/BiconWeb4.0/ViewElement/Element/Alert?elementPk=687363&casePk=682337 (accessed 10 September 2020).
Aydin, C. 2007. Some engineering properties of peanut and kernel. J. Food Eng. 79: 810– 816.
Baldessari, J., Marraro-Acuña, F. Rodriguez, A. and Conde. M.B. 2019. Relative importance of variability sources in smut resistance assessment in field tests. Proc. Amer. Peanut Res. Educ. Soc. 51: 108 (abstr.).
de Blas, F.J., Bressano, M. Teich, I. Balzarini, M.G. Arias, R.S. et al. 2019. Identification of smut resistance in wild Arachis species and its introgression into peanut elite lines. Crop Sci. 59: 1657– 1665.
Bock, C.H., Poole, G.H. Parker, P.E. and Gottwald. T.R. 2010. Plant disease severity estimated visually, by digital photography and image analysis, and by hyperspectral imaging. Crit. Rev. Plant Sci. 29: 59– 107.
Bonessi, F., Rago, A. Marinelli, A. March, G. Cazón, I. et al. 2011. Efecto de la fertilización sobre la intensidad del carbón del maní. In XXVI Jornada Nacional de Maní, General Cabrera, Córdoba, Argentina. http://www.ciacabrera.com.ar/docs/JORNADA%2026/Microsoft%20Word%20-%2022-%20Bonessi%20-%20Oddino%20-%20AGD%20y%20UNRC.pdf (accessed 26 November 2020).
Bressano, M., Massa, A.N. Arias, R.S. de Blas, F. Oddino, C. et al. 2019. Introgression of peanut smut resistance from landraces to elite peanut cultivars (Arachis hypogaea L.). PLOS One 14: e0211920.
Burt, R. 1999. The role of gravity concentration in modern processing plants. Miner. Eng. 120: 1291– 1300.
Carranza, J.M., and Lindquist. J.C. 1962. Thecaphora frezii n. sp., parásita de Arachis sp. Bol. Soc. Argent. Bot 10: 11– 18.
Cazón, L.I., Paredes, J.A. and Rago. A.M. 2018. The biology of Thecaphora frezii smut and its effects on Argentine peanut production, p. 31– 46. In Kimatu J.N. (ed.) Advances in Plant Pathology. IntechOpen Ltd., London, U.K.
Cetin, A.E., Pearson, T.C. and Tewfik. A.H. 2004. Classification of closed- and open-shell pistachio nuts using voice-recognition technology. Trans. ASAE 47 (2): 659– 664.
Chamberlin, K.D., Bennett, R.S. Baldessari, J. Holbrook, C.C. Tallury, S.P. et al. 2018. Screening of U.S. germplasm for resistance to peanut smut. In: Advances in Arachis through Genomics and Biotechnology Conference, 12-16 Nov. 2018, Saly, Senegal (abstr.).
Chen, C.Y., Barkley, N.A. Wang, M.L. Holbrook, C.C. and Dang. P.M. 2014. Registration of purified accessions for the U.S. peanut mini-core germplasm collection. J. Plant Regist. 8: 77– 85.
Chen, P., and Sun. Z. 1991. A review of non-destructive methods for quality evaluation and sorting of agricultural products. J. Agric. Eng. Res. 49: 85– 98.
El-Lissy, O. 2017. APHIS Restricts the Importation of Peanut from Argentina and Brazil due to Peanut Smut (Thecaphora frezii). https://nationalplantboard.org/wp-content/uploads/docs/spro/fo_peanut_2017_10_23.pdf (accessed 10 September 2020).
Gnanasekharan, V., Chinnan, M.S. and Dorner. J.W. 1992. Methods for characterization of kernel density and aflatoxin levels of individual peanuts. Peanut Sci. 19: 24– 28.
Haff, R.P., and Toyofuku. N. 2008. X-ray detection of defects and contaminants in the food industry. Sens. & Instrumen. Food Qual. 2: 262– 273.
Han, Y.J., Bowers, S.V. and Dodd. R.B. 1992. Nondestructive detection of split–pit peaches. Trans. ASAE 35: 2063– 2067.
Kim, S., and Schatzki. T.F. 2000. Apple watercore sorting using X-ray imagery: I. Algorithm development. Trans. ASAE 43: 1695– 1702.
Krapovickas, A., and Gregory. W.C. 2007. Taxonomy of the genus Arachis (Leguminosae). Translated by Williams D.E. and Simpson. C.E. Bonplandia 16 (Supl.):1–205. ISSN 0524-0476.
Marinelli, A., March, G.J. and Oddino. C. 2008. Aspectos biológicos y epidemiológicos del carbón del maní (Arachis hypogaea L.) causado por Thecaphora frezii Carranza & Lindquist. AgriScientia 25: 1– 5.
Marraro Acuña, F., Cosa, M.T. and Wiemer. A.P. 2013. Carbón del maní: histopatología, incidencia y severidad. XXVIII Jornada Nacional de Maní. General Cabrera, Córdoba, Argentina. http://www.ciacabrera.com.ar/docs/JORNADA%2028/9-%20MARRARO.pdf (accessed 26 November 2020).
Marraro Acuña, F., Rodriguez, A.V. Edelstein, J.D. and Baldessari. J. 2014. Evaluación de la intensidad del carbón del maní. XXIX Jornada Nacional del Maní. General Cabrera, Córdoba, Argentina. http://www.ciacabrera.com.ar/docs/JORNADA%2029/17.pdf (accessed 26 November 2020).
Mathanker, S.K., Weckler, P.R. and Bowser. T.J. 2013. X-ray applications in food and agriculture: a review. Trans. ASABE 56: 1227– 1239.
Oddino, C., Marinelli, A. March, G.J. Tarditi, L. D’Eramo, L. et al. 2010. Relación entre el potencial inoculo de Thecaphora frezzii, la intensidad de carbón del maní y el rendimiento del cultivo. In XXV Jornada Nacional del Maní. General Cabrera, Córdoba, Argentina. http://www.ciacabrera.com.ar/docs/JORNADA%2025/6-%20Oddino%20-%20Relacion%20entre%20el%20potencial%20inoculo...pdf (accessed 26 November 2020).
Onaran, I., Dulek, B. Pearson, T.C. Yardimci, Y. and Cetin. A.E. 2005. Detection of empty hazelnuts from fully developed nuts by impact acoustics, p. 1– 4. In Signal Processing Conference, 2005 13th European. IEEE.
Pearson, T.C., Cetin, A.E. Tewfik, A.H. and Haff. R.P. 2007. Feasibility of impact-acoustic emissions for detection of damaged wheat kernels. Digital Signal Process. 17: 617– 633.
Rago, A.M., Cazón, L.I. Paredes, J.A. Molina, J.P.E. Conforto, E.C. et al. 2017. Peanut smut: from an emerging disease to an actual threat to Argentine peanut production. Plant Dis. 101: 400– 408.
Rucker, K.S., Kvien, C.K. Calhoun, K. Henning, R.J. Koehler, P.E. et al. 1994. Sorting peanuts by pod density to improve quality and kernel maturity distribution and to reduce aflatoxin. Peanut Sci. 21: 147– 152.
Seem, R.C. 1984. Disease incidence and severity relationships. Annu. Rev. Phytopathol. 22: 133– 150.
Sorensen, R.B., Butts, C.L. and Lamb. M.C. 2020. X-ray technology to determine peanut maturity. Peanut Sci. 47: 38– 45.
Tkachuk, R., Dexter, J.E. Tipples, K.H. and Nowicki. W. 1991. Removal by specific gravity table of tombstone kernels and associated trichothecenes from wheat infected with Fusarium head blight. Cereal Chem 68: 428– 43l.
Turland, N.J., Wiersema, J.H. Barrie, F.R. Greuter, W. Hawksworth, D.L. et al. (eds.) 2018: International Code of Nomenclature for algae, fungi, and plants (Shenzhen Code) adopted by the Nineteenth International Botanical Congress Shenzhen, China, July 2017. Regnum Vegetabile 159. Glashütten: Koeltz Botanical Books.
Valente, M., Malano, F.M. Perez, P. and Baldessari. J. 2014. Rayos X detectan y distinguen carbón, cascara y semillas en vainas intactas de maní. In XXIX Jornada Nacional del Maní. General Cabrera, Córdoba, Argentina. http://www.ciacabrera.com.ar/docs/JORNADA%2029/14.pdf (accessed 26 November 2020).
Valente, M., Malano, F.M. Perez, P. and Baldessari. J. 2017. Automated peanut smut damage assessment on intact pod bulks by using X-ray devices and proprietary software. In: Advances in Arachis through Genomics and Biotechnology Conference, 14-17 March 2017, Córdoba, Argentina (abstr.).
Wann, D., Falco, A. Cavigliasso, M. and Cassano. C. 2020. Phenotypic variation of peanut smut (Thecaphora frezii) incidence and severity in the US peanut mini-core collection. Peanut Sci. 47: 46– 53.
Wu, C., Gill, R. Chu, Y. Holbrook, C.C. and Ozias-Akins. P. 2015. Fine phenotyping of pod and seed traits in Arachis germplasm accessions using digital image analysis. Peanut Sci. 42: 65– 73.
Wu, S., Sokhansanj, S. Fang, R. and Opoku. A. 1999. Influence of physical properties and operating conditions on particle segregation on gravity table. Appl. Eng. Agric. 15: 495– 499.
Notes
- First and fourth authors: Research Plant Pathologist and Research Biologist, Wheat, Peanut and Other Field Crops Research Unit, USDA-ARS, Stillwater, OK 74075; Second and third authors: Plant Pathologist and Peanut Breeder, Instituto Nacional de Tecnología Agropecuaria, Manfredi, Córdoba Province, Argentina; Fifth author: Chair and Professor, Department of Biomedical Sciences, Rocky Vista University, Parker, CO, 80134; Sixth author: Professor, Department of Biosystems and Agricultural Engineering, Oklahoma State University, Stillwater, OK 74078. [^] *Corresponding author Email: rebecca.bennett@usda.gov
Author Affiliations