

Introduction
Peanut growth and final yield are closely associated to peanut's capacity to take advantage of environmental resources (e.g. radiation, water and nutrients). For this reason, the management of plant density is one of the most effective tools to obtain canopy and root systems that are efficient capturing resources. Therefore, plant density selection is an important component of agronomic management to maximize yield (Bell et al., 1991; Rasekh et al., 2010). Peanut yield response to variation in plant density has been extensively studied worldwide. Generally, under well-watered conditions, plant densities ranging from 4 to 10 plant/m2 produce the greatest yield. Densities above this range did not increase pod yield, while densities below 4 plants/m2 reduced pod yield (Bell et al., 1987). Then, at high plant densities peanut yield is relatively insensitive to plant population with a wide range in seeding rates usually producing the same yield (Bell et al., 1987; Bell and Wright, 1998; Tewolde et al., 2002). At the same time, these responses to density may vary according to the environmental conditions (mainly hydric and nutritional), genotype used (growth habit and branching pattern), sowing dates and the combination of all these factors.
The optimum plant density (OPD), which is the minimum density of plants required to obtain maximum yields (Lee et al., 2008), determined in one place might not be applicable in another environment (Rasekh et al., 2010). In the Argentine peanut growing region, Giayetto et al. (1998) noted that planting density and arrangement affect the peanut growth, most compact spacing produces more dry matter per surface and leaf area index. Pedelini (2016) stated that a low densities (<8 plants/m2) peanut never reaches the maximum possible yield. While high densities (>17 plants/m2) did not diminish yield, they increased seed cost. On the other hand, Cerioni (2012) determined that 9 plants/m row spaced 0.7 m could be considered a minimum density to reach acceptable yields.
Previous experiments conducted in Argentina with runner-type cultivars, the most common type in the area, indicated no differences in yield from 5.7 plants/m2 (Pedelini et al., 1986), 7.5 plants/m2 (Casini et al., 1999), 9 plants/m2 (Casini et al., 2008; Cerioni et al., 2012), and that maximum yields were obtained between 13 to 23 plants/m2 (Casini et al., 1999), 16 to 18 plants/m2 (Casini and Sagadín, 1998), 17 to 23 plants/m2 (Pedelini et al., 1986), 24 plants/m2 (Cerioni et al., 2012), and 30 plants/m2 (Giayetto et al., 1998).
There are different statistical models that can be used as tools in the analysis of crop response to changes in planting density (Bell et al., 1991; Bell and Wright, 1998), including quadratic, lineal-plateau, quadratic-plateau and spherical-plateau functions. Among those, the equation proposed by Mitscherlich (1909), can be used to describe mathematically the law of diminishing productivities. This law postulates that each increment of the limiting factor, in this case the number of plants per unit area, corresponds to decreasing yield increases, yield gain until reaching zero gain. After review different statistical models used in the literature (Lee et al., 2008), the Mitscherlich equation was determined to be the most appropriate. Obtaining a response model can be used to develop a tool to help in the choice of peanut sowing density. The objective of this study was (a) to adjust the Mitscherlich equation of diminishing productivities to the yield response of runner-type peanut cultivars to the density of plants established under different growing conditions in the peanut growing region of Córdoba, Argentina; and (b) to validate this adjustment through experimental tests designed for this purpose.
Materials and Methods
Evaluation of peanut yield-planting database
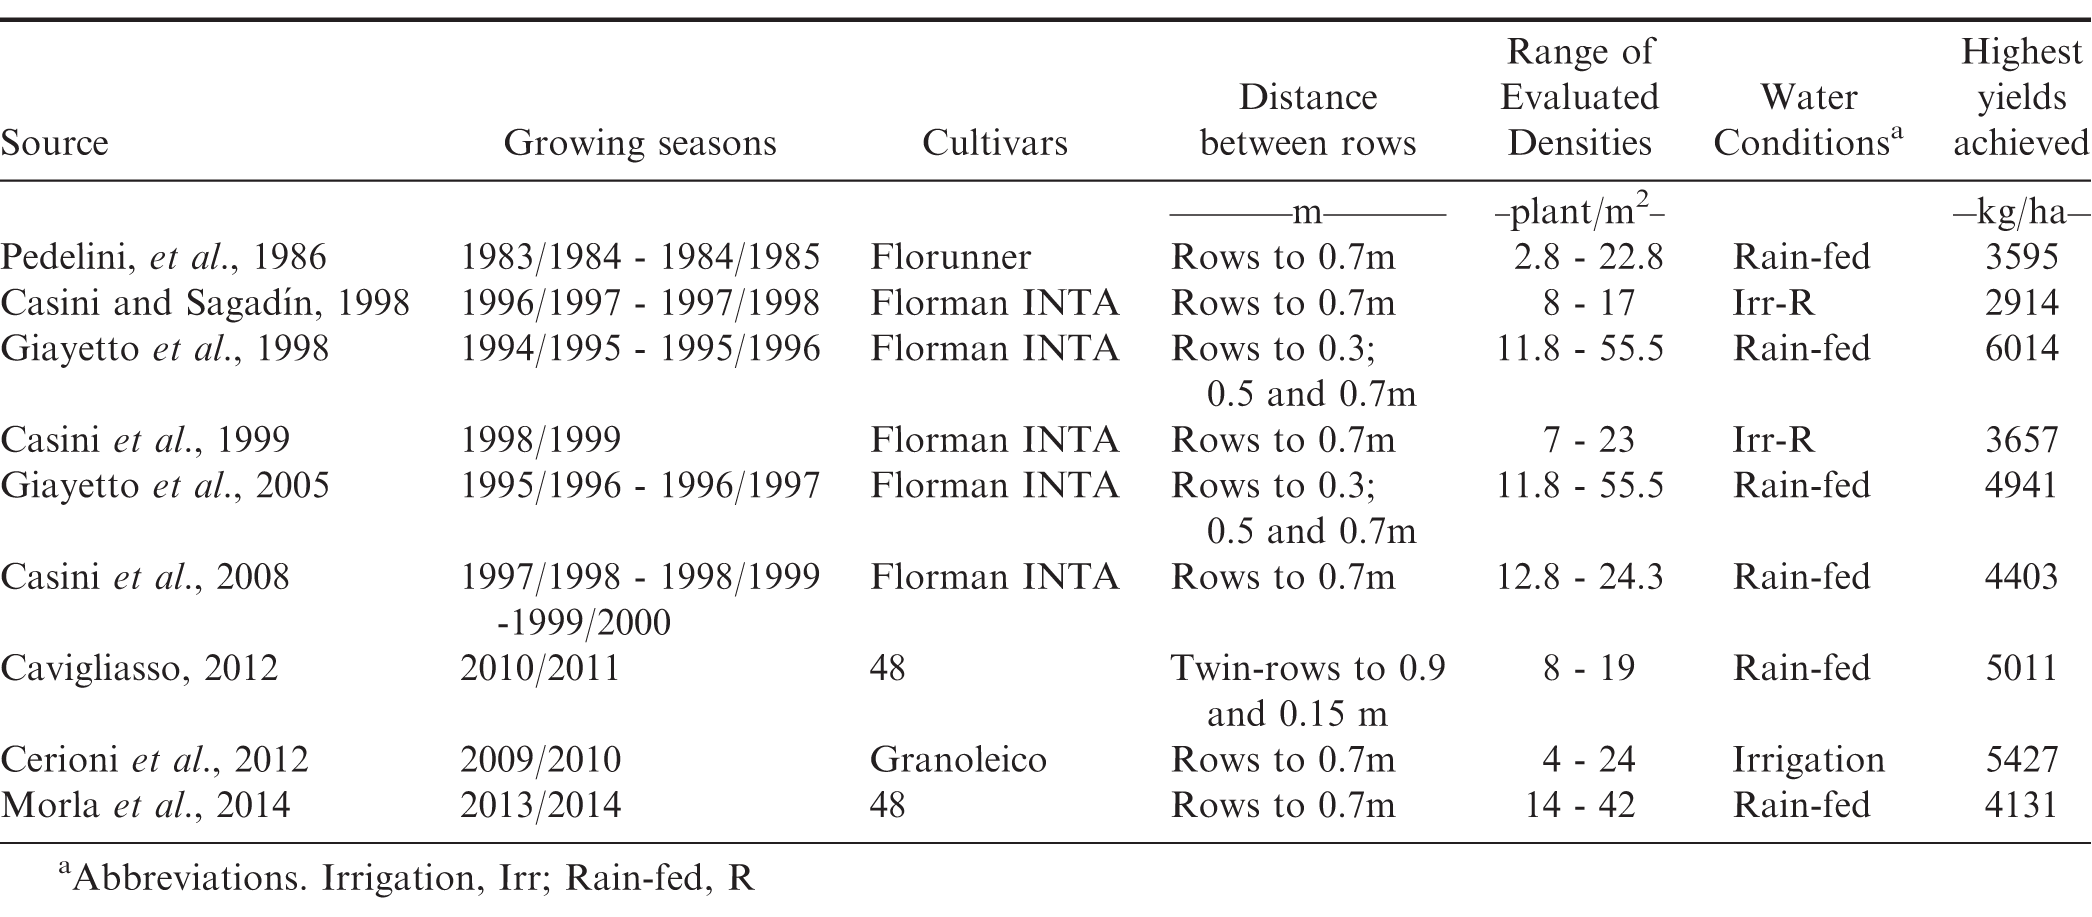
The first part of this research was based on the analysis of data from the scientific literature, in which different planting densities and arrangements were used in the peanut growing region of Córdoba, Argentina, covering a wide range of environmental conditions (Table 1). The analysis included 3 locations of Manfredi (-31.85, -63.7333), General Cabrera (-32.783298, -65.9167.), and Río Cuarto (-33.1167, -64.2333), 11 growing season/locations, 4 runner-type commercial cultivars, 4 row distances, and plant densities ranging from 2.8 to 56 plants/m2, 8 rain-fed conditions, and 3 supplementary irrigations. The experiments were sown on normal sowing dates for the region (from Oct to Nov), and received phytosanitary controls to minimize the adverse effect of weeds, pests and diseases.
Data sources for model development.
Prior to statistical analysis, pod yield data (kg/ha) was transformed to relative yield where 1 equals the maximum yield achieved in each experimental condition. Then, these values were adjusted to the Mitscherlich equation (1909) (Eq. 1).

The yield (y) is a function of plant density (x), a = 1, is the maximum relative yield achieved and b is yield increase rate. The optimum plant density (OPD) was defined as that density at which 95% of the predicted maximum yield was reached (Lee et al., 2008).
To detect whether the yield curves and density for the analyzed growing seasons were statistically different from each other, and if these differed statistically from a single adjustment function, they were compared using a statistical F test (𝜶 =0.10) as described by Andrade et al. (2002) using the Graph Pad Prism program v 5.00 for Windows (Graph Pad Software, San Diego California USA)
Experimental test
The study was conducted during the 2013/14 and 2014/15 growing seasons, in the Experimental Field of the Faculty of Agronomy and Veterinary of the National University of Río Cuarto, (-33.1167, -64.2333) in a Typic Hapludoll soil with a fine sandy loam texture.
Sowing was done manually 6 Nov 2013 and 13 Nov 2014 with inoculated 'Granoleico' (runner-type) seed, in rows spaced 0.7 m. The experimental design was a randomized complete block (three replications) with a split plot arrangement. The main factor was water condition (irrigation and rain-fed), and the secondary factor (subplot) was plant density of 5, 12, 18, 25 or 36 plants/m2, selected in order to cover the range of densities evaluated previously in other studies. Each subplot was 6 rows (0.7 m row spacing) wide by approximately 10 m long.
In the treatment with irrigation, a soil content of 50% volumetric water content was maintained, and drip irrigation was added weekly to supplement rainfall and match crop demand. During the 2014/15 season, due to abundant rainfall, there were no differences between irrigation and rain-fed conditions, so this factor was ignored. Weeds and diseases were adequately controlled in both experimental seasons, so that they did not interfere with the growth and yield of the crop. At harvest, R8 (Boote, 1982), 3 samples of 1 m2 were collected per subplot to determine yield. All the variables were subjected to ANOVA to determine differences and multiple means comparisons were done whit Fisher's LSD test (𝜶 = 0.05) with the statistical program Infostat version 2016.
Results and Discussion
All the data sets obtained from the literature fit the Mitscherlich model with coefficients of determination (r2) that varied between 0.22 and 0.95 (Fig 1A). In each of these studies the optimum plant density (OPD) varied between 10.5 and 24.8 plants/m2, 7.3 to 17.3 plants/m row in 0.7 m rows.
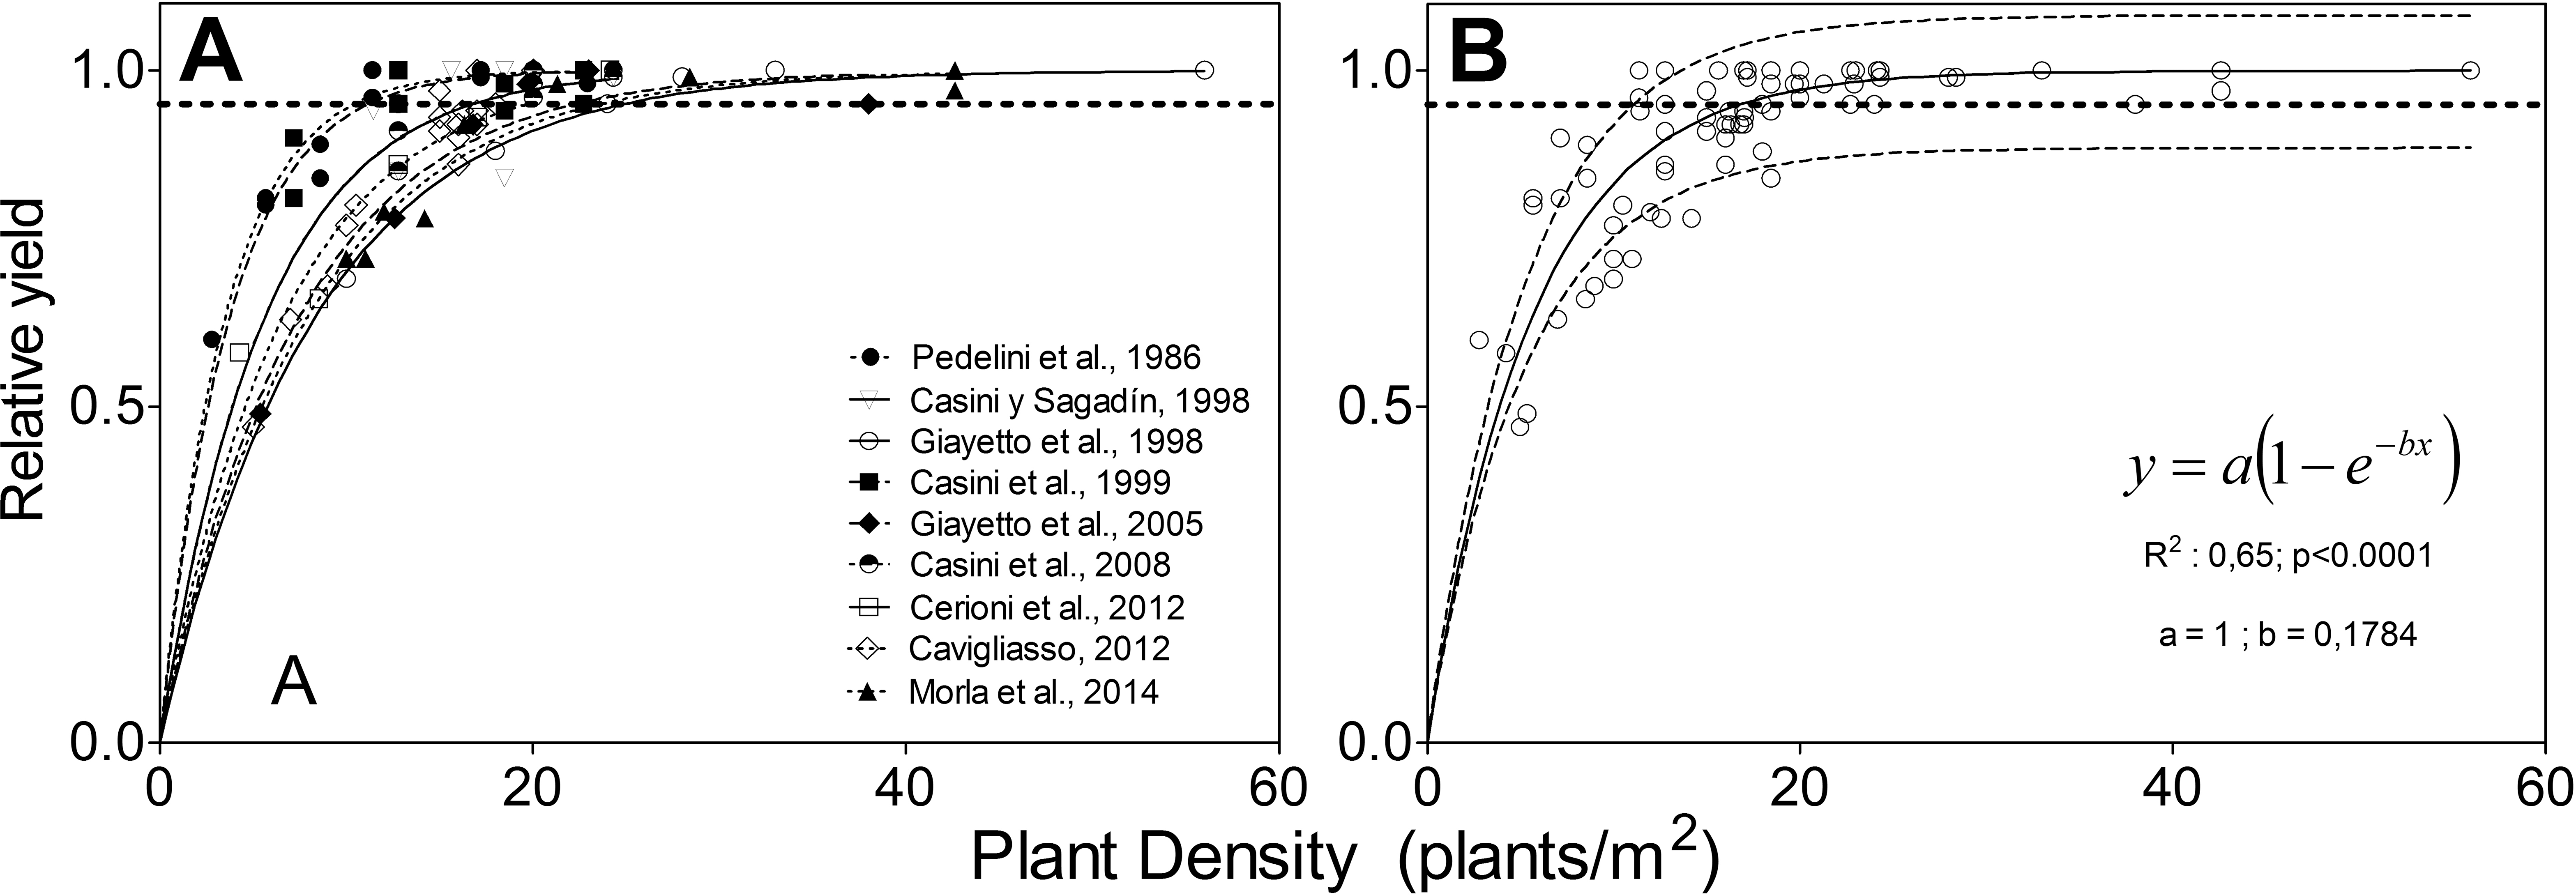
Relative peanut yield in response to plant density for different experiments (A); and (B) overall model, all carried out in the peanut growing region of Córdoba. The dashed horizontal lines correspond to 95% of the maximum relative yield; and in B represent the confidence interval (95%).
In contrast, when analyzing the overall model (Fig 1B), a good fit of a single equation of the Mitscherlich model was obtained (r2 = 0.65; P < 0.0001). In which, in addition, no differences were detected between the obtained individual location model with respect to a single curve (F test, P > 0.05), so the data adjusted to a single yield response model at density
Thus, the optimum density (OPD), for the set of data analyzed in this study, was determined at 16.8 plants/m2, which is equivalent to about 11.7 plants/m row.
The predicted OPD agrees with the technical recommendations for the peanut growing region of Córdoba. Pedelini (2016) proposed target densities of 10 to 12 plants/m row (14.3 to 17.2 plants/m2) and Giayetto et al. (2006) recommend 11 to 13 plants/m row (15.7 to 18.6 plants/m2), both for runner-type peanut cultivars. The high degree of fitness to this asymptotic model of diminishing productivity reveals that there is high intraspecific competition preventing further yield increase (Bell et al., 1987; Tewolde et al., 2002).
In the field experiment, for the 2013/14 growing season, precipitation of 648 mm was recorded between Oct to April (peanut growing season); and in the treatment under irrigation 136 mm were added. However, for the 2014/15 growing season, rainfall was 814 mm for the same period. Temperatures and incident radiation during the crop cycle were similar to the historical average values for the area in both experimental seasons.
For 2013/14, the main differences in yield were due to water availability (P < 0.0001) and density (P = 0.0006), without interaction between these factors (P = 0.9051), thus the irrigation treatments (2013/14 Irr) and rain-fed (2013/14 R) were analyzed separately.
In all the evaluated scenarios, there was a significant decrease in yield with the lowest plant density (5 plants/m2) (P = 0.0477, P = 0.0203 and P = 0.0002 in the 2013/14 Irr, 2013/14 R and 2014 to 2015 seasons, respectively); but no differences were detected among the other evaluated densities (12 to 36 plants/m2) (Fig 2).
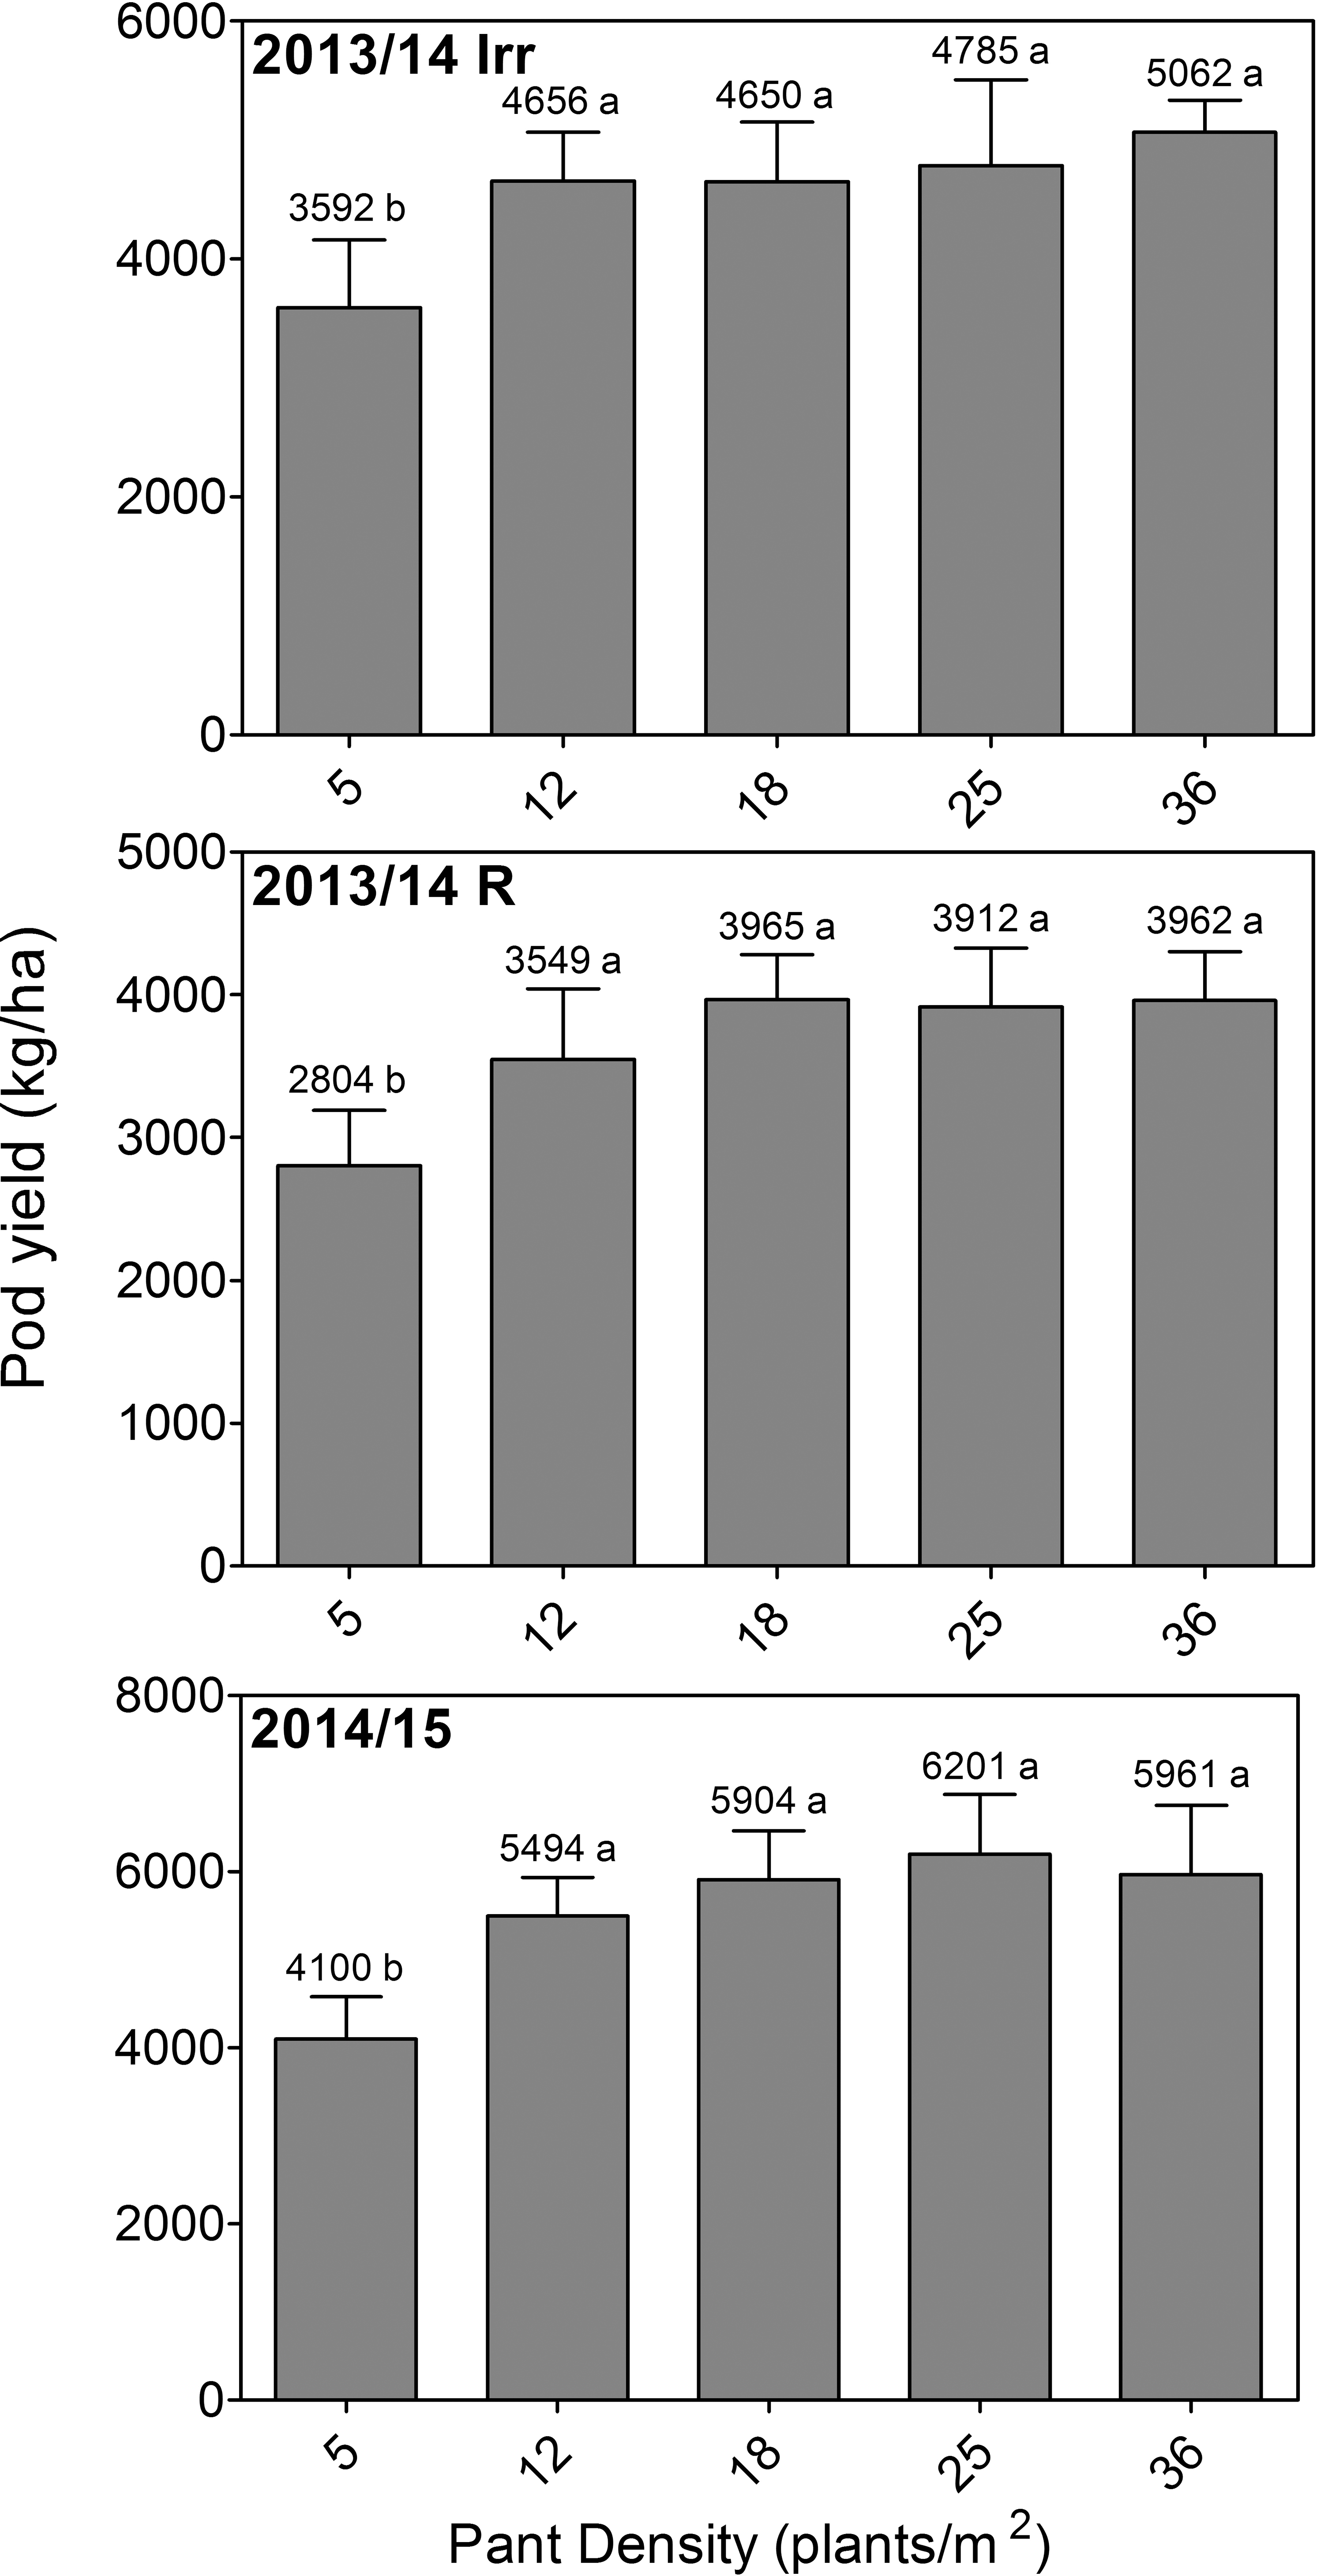
Peanut pod yield (kg/ha) in response to plant density for Granoleico cultivar in 2013/14 Irr (irrigate), 2013/14 R (rain-fed) and 2014/15 growing condition. Vertical bars represent the standard deviation of treatment means. Different letters indicate significant differences according to Fisher's LSD test (P < 0.05).
The highest pod yields occurred with the densities of 36 plants/m2 in 2013/14 irrigate (5062 ± 274 kg/ha); 18 plants/m2 in 2013/14 rain-fed (3965 ± 315 kg/ha), and 25 plants/m2 in 2014/15 (6201 ± 670 kg/ha). The Mitscherlich model fit the data (r2 > 0.83 and P < 0.05) in the three cases evaluated (Fig 3). The OPD (0.95 relative yield) calculated from it was 16.9, 16.9 and 14 plants/m2 (11.8, 11.8 and 10 plants/m to 0.7m between rows) for 2013/14 Irr, 2013/14 R and 2014/15, respectively.
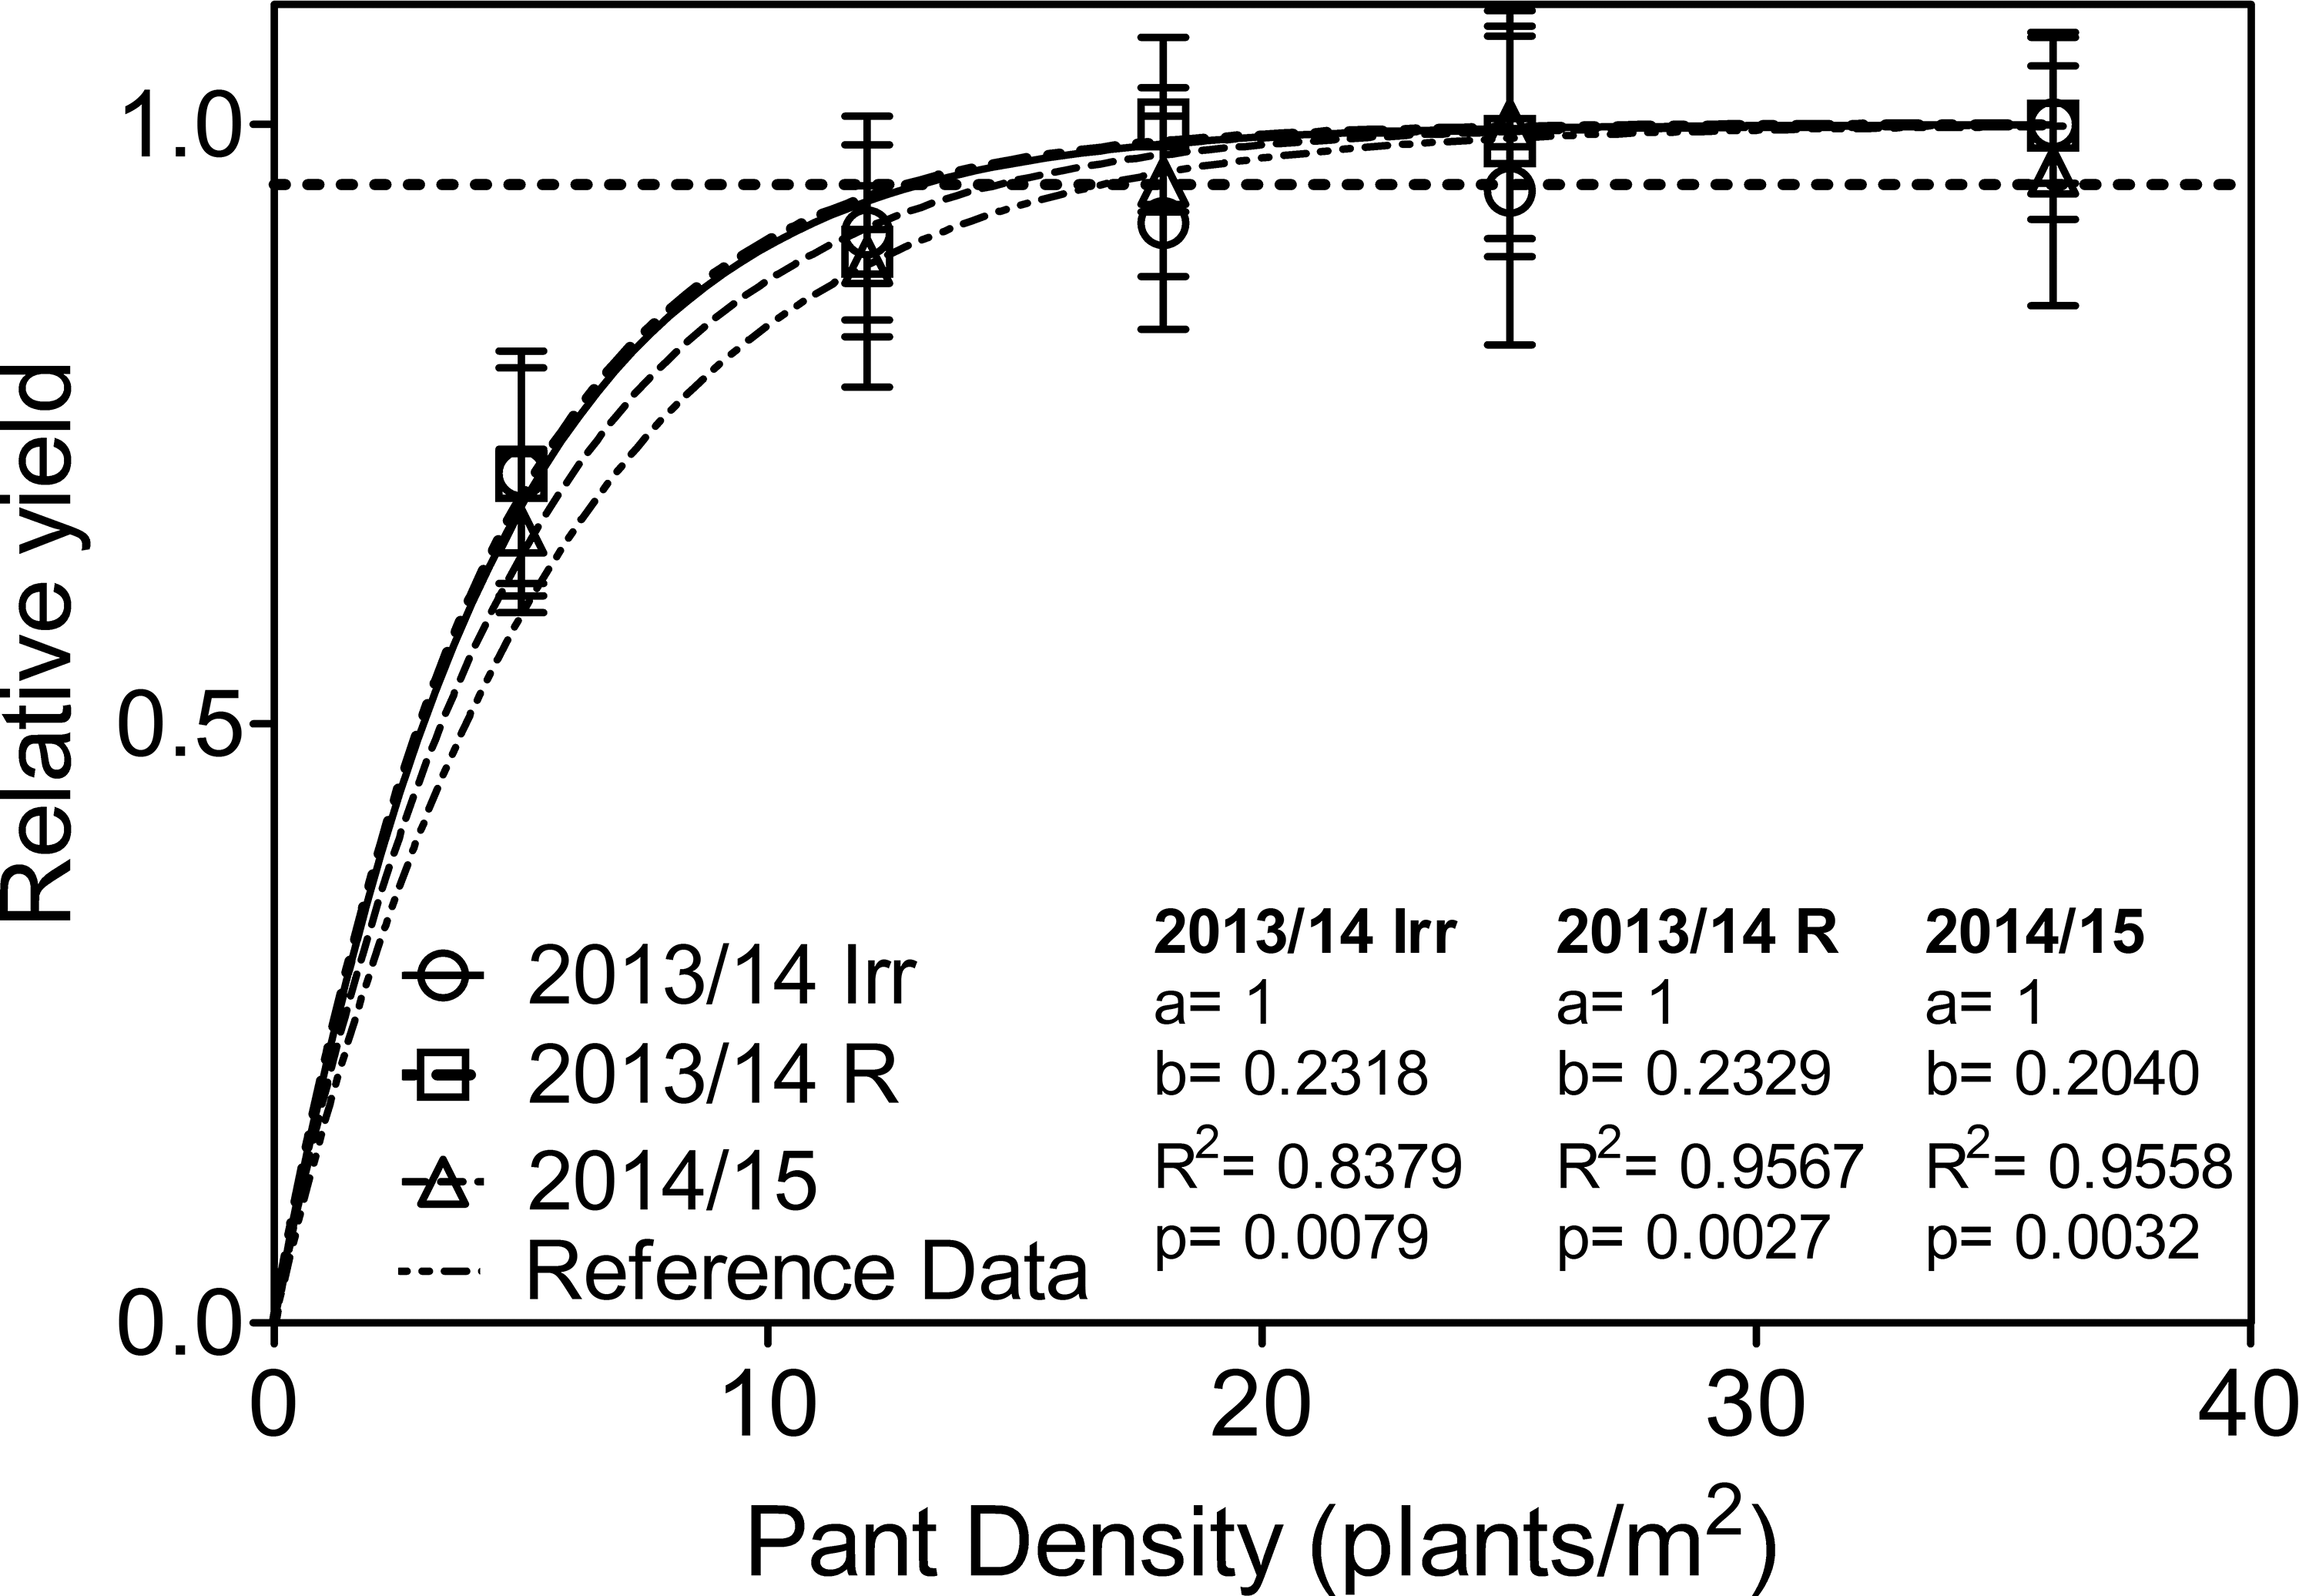
Relative peanut pod yield in response to plant density for Granoleico cultivar (y = a(1 - e-bx)), in 2013/14 Irr (irrigate), 2013/14 R (rain-fed) and 2014/15 growing condition. Reference equation from figure 1B is also shown. The dashed horizontal lines correspond to 95% of the maximum relative yield.
These curves do not differ (2013/14 Irr: P = 0.1029, 2013/14 R: P = 0.1042, 2014/15: P = 0.1300) when analyzing the set of information in all the peanut growing area of Córdoba, indicating that it is possible to use this one model for the wide range of environmental conditions analyzed in this work. Contrary to what is stated in the literature (Bell and Wright, 1998; Giayetto et al., 2006), no differences were noted according to the water condition to which the peanut crop was exposed (irrigation and rain-fed). As growth and branch development are mechanisms that allows peanut crop to compensate modifications in its structure (plant density and spatial arrangement), it is expected that water as well as nutritional deficiencies affect the crop response (Bell et al., 1987; Rasekh et al., 2010).
Future studies should evaluate the effect of unfavorable environmental conditions, such as late sowing dates that modify temperature and radiation to which the crop is exposed, or cause water and nutritional deficiencies, which modify growth and branch development on the crop responses to changes in plant density. This approach can be a valuable input, along with other variables to analyze, when choosing peanut sowing density. For this, a spreadsheet was developed based on the results of this work. It includes other variables such as physiological quality, size and price of the seeds, expected yield, and production cost, to estimate the economically optimum plant density (EOPD). This system is available online http://www.produccionvegetalunrc.org as a help tool in the decision-making process by the Argentinian technician or producer (Morla et al., 2017).
Literature Cited
F.H., Andrade, L., Echarte, R., Rizzalli, A., Della Maggiora, and M. Casanovas (2002). Kernel number prediction in maize under nitrogen or water stress. Crop Sci 42: 1173- 1179.
M.J., Bell, and G.C. Wright (1998). Groundnut growth and development in contrasting environments. 1. Growth and plant density responses. Exp Agric 34: 99- 112.
M.J., Bell, R.C., Muchow, and G.L. Wilson (1987). The effect of plant population on peanuts (Arachis hypogaea) in a monsoonal tropical environment. Field Crops Res 17: 91- 107.
M.J., Bell, G., Harch, and G.C. Wright (1991). Plant population studies on peanut (Arachis hypogaea L.) in subtropical Australia. 1. Growth under fully irrigated conditions. Aust J Exp Agric , 31: 535- 543.
K.J. Boote, (1982). Growth Stages of Peanut (Arachis hypogaea L.). Peanut Sci 9: 35- 40.
Casini C. and M. Sagadín 1998 Estudio del efecto de la densidad de siembra sobre el rendimiento y la calidad del maní XIII Jornada Nacional del Maní. CIA Cabrera - INTA. 42-44.
Casini C., R. Rolandoand R. Haro 1999 Efecto de la densidad de siembra sobre la calidad y el rendimiento del maní: Tres aos de experiencia XIV Jornada Nacional del Maní. CIA Cabrera - INTA. 35-36.
C., Casini R. Rolando, R. Haroand M.R. Yacci (2008). Efecto de la densidad de siembra sobre el rendimiento y la calidad del maní (Arachis hypogaea L.) apto para alimento humano. IDIA XXI: 95- 98.
Cavigliasso M.D. 2012 Interacción de la temperatura del suelo y la emergencia en cultivo de maní Tesis de Grado. Facultad de Agronomía y Veterinaria. Universidad Nacional de Río Cuarto 34 p.
G.A., Cerioni, F.D., Morla M.I.T., Kearney D.O., Della Mea E.L., Fernandez, O., Giayetto M.B. Rossoand E.M. Fernandez (2012). Disminución de la densidad de plantas en el cultivo de maní ¿cuál es el límite?. Ciencia y Tecnología de los Cultivos Industriales 3: 266- 271.
O., Giayetto, G.A., Cerioni, and M.S. Amin (2005). Water use, growth and pod yield of two peanut cultivars under different interrow spacings. Journal of Peanut Sci 34: 5- 13.
O., Giayetto, G.A., Cerioni, and W.E. Asnal (1998). Effect of sowing spacing on vegetative growth, dry matter production, and peanut pod yield. Peanut Sci 25: 86- 87.
Giayetto, O., Fernandez E.M.and G.A. Cerioni 2006 Fecha y Modelos de Siembra pp 157- 170 In: : Fernandez E.M. y O. Giayetto (eds.) El cultivo de maní en Córdoba. Publicaciones de la UNRC. Río Cuarto.
C.D., Lee, D.B., Egli, and D.M. TeKrony (2008). Soybean response to plant population at early and late planting dates in the Mid-South. Agron. J 100: 971- 976.
E.A. Mitscherlich, (1909). The law of the minimum and the law of diminishing soil productivity (In German). Landwirtschafliche Jahrbuecher 38: 537- 552
Morla F.D., O. Giayetto, E.M. Fernandez, G.A. Cerioni, M.I.T. Kearneyand C. Cerliani 2014 Respuesta del rendimiento de maní a la densidad de plantas en la zona manisera de Córdoba XXIX Jornada Nacional del Maní. CIA Cabrera - INTA. 14-16.
Morla F.D., Giayetto O., G.A. Cerioni, y E.M. Fernandez, 2017 Arreglo Espacial y Densidad de Plantas p 217- 230 In: Fernandez E.M. y O. Giayetto (eds.). El cultivo de maní en Córdoba. Segunda Edición ampliada. Publicaciones de la UNRC. Río Cuarto.
R., Pedelini R.C. Díazand J. Viale (1986). Efecto de la densidad de plantas sobre el rendimiento de maní (Arachis hypogaea L.) cv. "Flornunner" en la provincia de Córdoba. Revista Agronómica de Manfredi II: 51- 54.
Pedelini R. 2016 Maní. Guía práctica para su cultivo Boletín de divulgación Técnica N°2. 4° Edición. Ediciones INTA 20 p.
H., Rasekh, J., Asghari, S.L., Massoumi, and R. Zakerinejad (2010). Effect of planting pattern and plant density on physiological characteristics and yield of peanut (Arachis hypogaea L.) in Iran. Res. J. of Biological Sci 5: 542- 547.
H., Tewolde, M.C., Black, C.J., Fernandez, and A.M. Schubert (2002). Plant growth response of two runner peanut cultivars to reduced seeding rate. Peanut Sci 29: 8- 12.
Notes
- Departamento Producción Vegetal, Facultad de Agronomía y Veterinaria, Universidad Nacional de Río Cuarto. Ruta Nacional 36, Km 601. 5800 Río Cuarto, Córdoba, Argentina. [^] *Corresponding author's E-mail: fmorla@ayv.unrc.edu.ar
Author Affiliations