

Introduction
Variability in phenotypic peg strength may contribute to greater digging losses in some peanut cultivars. Previous research has shown that peg strength can vary due to agronomic practices, field conditions, peg age, moisture content, peanut cultivar, and fungal infections (Bauman and Norden, 1971; Troeger et al., 1976; Thomas et al., 1983; Chapin and Thomas, 2005; Sorensen et al., 2015). For instance, Bauman and Norden (1971) showed that cultivars Florunner and Florigiant had the same attachment force but were significantly higher than 'Early Runner'. Troeger et al (1976) showed that Spanish type peanut had higher attachment force than either Runner or Virginia type peanuts. Thomas et al., (1983) using 30 different genotypes (plant introductions) showed that peg strength can vary greatly between genotypes. Chapin and Thomas (2005) showed that pods from plants exhibiting tomato spotted wilt virus (TSWV) symptoms had significantly stronger pegs than those from healthy plants, and plants with southern stem rot (Sclerotium rolfsii) had lower peg strength than healthy plants. In addition they showed no difference in peg strength as pods mature through the mesocarp color categories. However, peg strength decreased about 32% in over mature black pods compared to mature black pods.
A study by Sorensen et al. (2015) hypothesized that peg strength may be used as a determinant for peanut digging date. They showed that cultivar Georgia-06G had greater peg strength than either Georgia-09B or Tifguard. They also showed that peanut yields were greater at early planting and harvest dates and decreased at later harvest dates. Conversely, peanut pod loss was lower with early planting and harvest dates but increased with later harvest dates. In addition, there was a strong positive linear relationship between peg strength and peanut yield for each cultivar. However, there was a relatively small difference in peg strength between the maximum and minimum peanut yield impyling that peg strength may not be a reliable characteristic of determining harvest date or predicting yield.
At present, peanut breeding programs in the United States do not have greater peg strength as a breeding objective. Therefore, it is currently unknown how recent released cultivars with advanced genetic characteristics, i.e., increased yield, disease resistance, or drought resistance, compare in peg strength versus harvestable yield at different locations. The objective of this study was to compare peg strength, pod yield, and pod loss of various released cultivars and advanced breeding lines grown at two locations for two years with three harvest dates.
Materials and Methods
There were 9 and 11 peanut genotypes planted in 2010 and 2011, respectively, at two sites, Dawson (31°47'04"N 84°29'14"W) and Tifton (31°26'24"N 83°35'23"W), GA. Peanut cultivars selected in 2010 were Georgia Green (GG; Branch, 1996), Georgia Greener (GNR; Branch, 2007b), Georgia-02C (02C; Branch, 2003), Georgia-06G (06G; Branch, 2007a), Georgia-07W (07W; Branch and Brenneman, 2008), Florida-07 (F07; Gorbet and Tillman, 2009), Tifguard (TFG; Holbrook et al., 2008), and the advanced breeding lines Exp27-1516 (EXP27) and TifGP-2 (Holbrook et al., 2012). The same genotypes were used in 2011 plus cultivars Georgia-09B (09B; Branch, 2010) and Georgia-10T (10T; Branch and Culbreath, 2011).
Genotype EXP27 is an advanced breeding line derived from the cross between GK7-O/H and H95. EXP27 has high yield, high total sound mature kernels (TSMK), good seed size, and medium maturity with the same maturity rating as Georgia Green (135 days; Dr. Charles Chen, personnel communication, 2015). It also has a very good resistance to TSWV disease and good seedling vigor. TifGP-2, is a late-generation-derived sister line of 'Tifguard'. TifGP-2 has high resistance to TSWV, but is susceptible to root-knot nematode. It is a medium-maturity class peanut (Holbrook et al., 2012).
The experimental design at both sites was a split plot design where digging date was the main plot and peanut genotype as subplots in randomized complete blocks with three harvest dates and four replications per genotype. The soil at both locations was Tifton loamy sand (Fine-loamy, kaolinitic, thermic Plinthic Kandiudults) with 1-2% slope. Individual plots were 1.83-m wide by 12.2-m long. Each harvest date was separated by alleys for travel purposes.
Peanut was planted between 10 and 20 May each year using recommended seeding rate of 20 seeds m-1 to minimize severity of TSWV (Brown et al., 2002a; Brown et al., 2002b). Aldicarb (5.6 kg ha-1; 2-methyl-2-(methylthio)-O-((methylamino) carbonyl) oxime) and boron (0.56 kg ha-1) were applied at planting and during the growing season at recommended rates, respectively. Fungicide, insecticide, and herbicide were applied at recommended rates and timing as determined by field scouting during the growing season for disease, insect, and weed control, respectively. The crop was irrigated at both sites using overhead sprinkler irrigation and events were scheduled using IrrigatorPro (http://irrigatorpro.org/farm/) for peanut.
There were three projected digging dates each year of 130, 140 and 150 days after planting (here after called early, mid, and late). Due to weather and labor conditions, digging dates averaged 132, 146 and 157 days after planting across both years and sites. Prior to each digging date, a minimum of six peanut plants from each plot were hand dug, placed in mesh bags, and stored in plastic cooler boxes with ice to keep the samples cool. The samples were taken from the field to the laboratory and washed with tap water to remove any excess soil. Three peanut plants were separated from the total sample. Peanut vines were separated using scissors to remove excess stems and leaves. This process maintained about 5-cm of stem associated with each peanut peg. If peanut pegs were close together on a stem, such as around the plant crown, the whole stem was left intact. The 5-cm stem length was used so that the operator would have a hold position away from the peg attachment point. After removing excess leaves and branches, the pegs with the associated stems were placed in plastic bags and stored in a refrigerator. All samples were processed within two days of sampling.
Each peanut pod was placed in a "U" shaped metal bracket that was attached to an electronic force gauge (Imada, Inc. Model DS2-11, Northbrook, IL, www.imada.com), connected to a computer. The force gauge was adjusted to collect the maximum force needed to detach the peanut from the peg. The stem was pulled manually away from the pod until the pod detached. Force data were then sent electronically to the computer. Electronic force data for each peg and eventually the total plot was named and saved into separate electronic files for retrieval and analysis.
After hand sampling, peanut plots were inverted using two row equipment. Plots were allowed to dry in the field and then combined. The yield sample was captured using a 2-row combine with a bagging attachment, placed on air dryers, and dried below 10.5% moisture. Each yield sample weight was documented and a random 1500-g subsample was taken, and used for grade and quality using x-ray technology (National Peanut Research Laboratory, Dawson, GA).
After combining, peanut hay was manually removed from each plot using pitchforks. A 3-m long by 1.83-m wide area was marked in each plot to designate where the digging loss machine/scavenger would travel (designed, built and operated by personnel from the National Peanut Research Laboratory, Dawson, GA) to collect peanut pods lost during harvest (digging and combining). The scavenger separated soil, rock, and other debris from peanuts that were lost during the harvest process. The scavenger would transport all material from a 1.83-m wide swath about 5-cm deep and lifted onto a screened vibrating table. With vibration, shaking, and air fans, peanuts were separated from other heavier material and collected in mesh bags. Any peanut that may have passed over the scavenger and fell to the ground was manually collected and added to the mesh bag. All scavenged peanut samples in mesh bags were placed on forced-air dryers to dry both soil and peanuts. After drying, each sample was cleaned using a belt cleaner to remove rocks, pebbles, soil, or other foreign debris. Each sample was then hand checked to remove any other foreign material leaving only peanuts. There was no in-depth analysis on peanut pods to determine the cause of pod loss, i.e., disease, mechanical, or biological (animal damage). Each peanut sample was then weighed to determine total pod loss.
A factorial design of general analysis of variance procedure was used to analyze peg strength, pod yield, and pod loss (Statistix10, 2013, Analytical Software, www.stastitix.com) with respect to harvest date, peanut cultivar, and location. Peg strength, crop yield, and pod loss were analyzed individually by location, cultivar, and harvest date. Data were pooled by location, cultivar, or harvest date if ANOVA F-test showed no significance at the alpha level of 0.05. Differences between peg strength, crop yield, and pod loss means were determined using least significant difference (LSD) multiple comparison when ANOVA F-test showed significance (P ≤ 0.05).
Results and Discussion
Peg strength - 2010
Data analysis for peg strength in 2010 (Table 1) showed that peanuts had higher peg strength (6.14N) at Dawson when averaged across all harvest dates and cultivars when compared to Tifton (5.28 N; p < 0.001). In Dawson, peg strength ranged between 5.12 to 7.2 N of tension to remove a pod versus 4.61 to 6.45 N at Tifton (Table 1). Comparison of individual cultivars when averaged across all harvest dates and between locations showed both consistency and variation in peg strength depending on cultivar. For instance, cultivars 06G, 02C, and F07 were in the top third for all cultivars and TFG and GG were in the lower third, if not the lowest position at both locations. The breeding lines, EXP27 and TifGP-2, were quite variable between sites such that EXP27 was at the 4th position in Dawson and in the 8th position in Tifton. On the other hand, TifGP-2 had the lowest position in Dawson and the 6th position in Tifton. Across both sites, TifGP-2 was the only cultivar that had about the same peg strength.
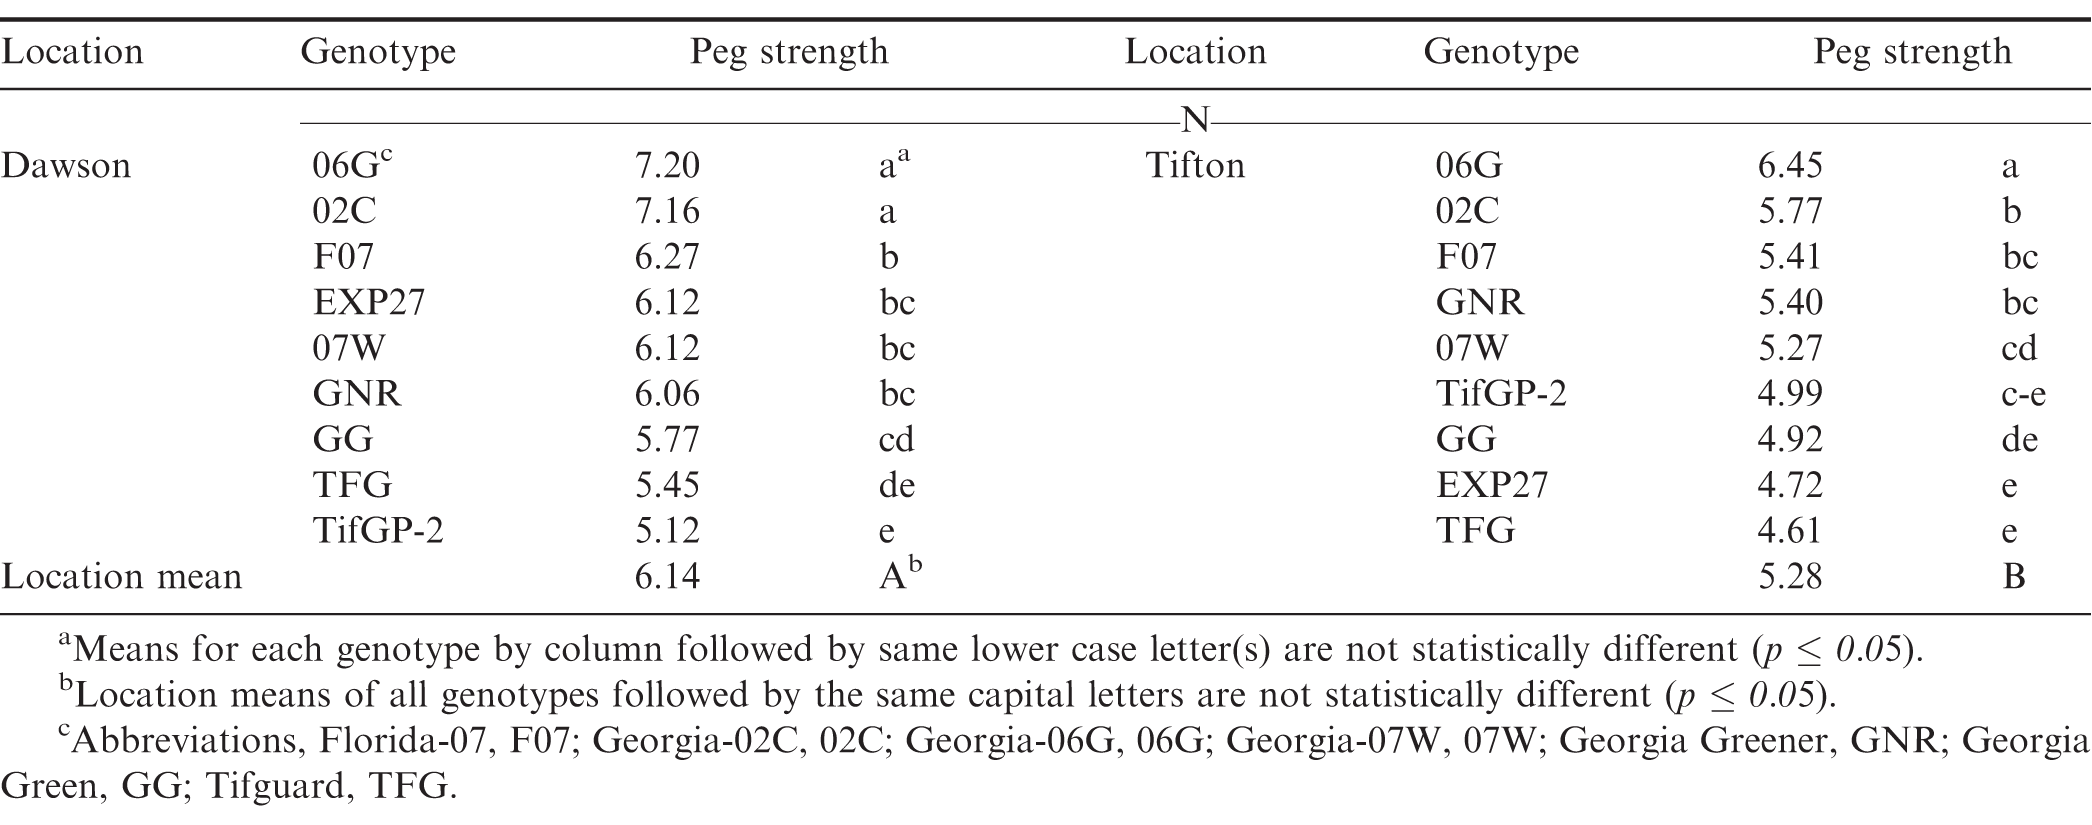
Average peg strength across harvest dates by genotype and location for 7 cultivars and 2 advanced breeding lines in Dawson and Tifton, Georgia in 2010.
At the Dawson location, there were peg strength differences between harvest dates and cultivars (data not shown). Dawson had higher average peg strength at the early compared with both the mid and late harvest. Both 02C and 06G were in the top two positions across all harvest dates. Genotypes TifGP-2 and TFG were typically in the lower third position of all the genotypes across all harvest dates. Genotypes with highest and lowest peg strengths tended to be at the same positions at both locations.
At Tifton, there was no difference in average peg strength between any of the harvest dates when averaged across all cultivars/genotypes, but there were significant differences among cultivars within harvest dates (data not shown). Cultivar 06G had the highest peg strength across all three harvest dates. Genotype TFG had the lowest peg strength across all harvest dates. In general, peg strength tended to decrease with time (later harvest dates) as peanut plants age beyond the normal harvest date.
Peg Strength - 2011
Data analysis for peg strength in 2011 showed no difference for average peg strength across all treatments of site, cultivar, and harvest date (Table 2; p=0.269). However, average peg strength was different between cultivars within each site. At Dawson, peg strength showed a narrow range from 4.06 to 4.82 N while at Tifton peg strength had a much wider range between 3.66 and 5.39 N. Comparison of individual cultivars across locations showed very little consistency with respect to peg strength.
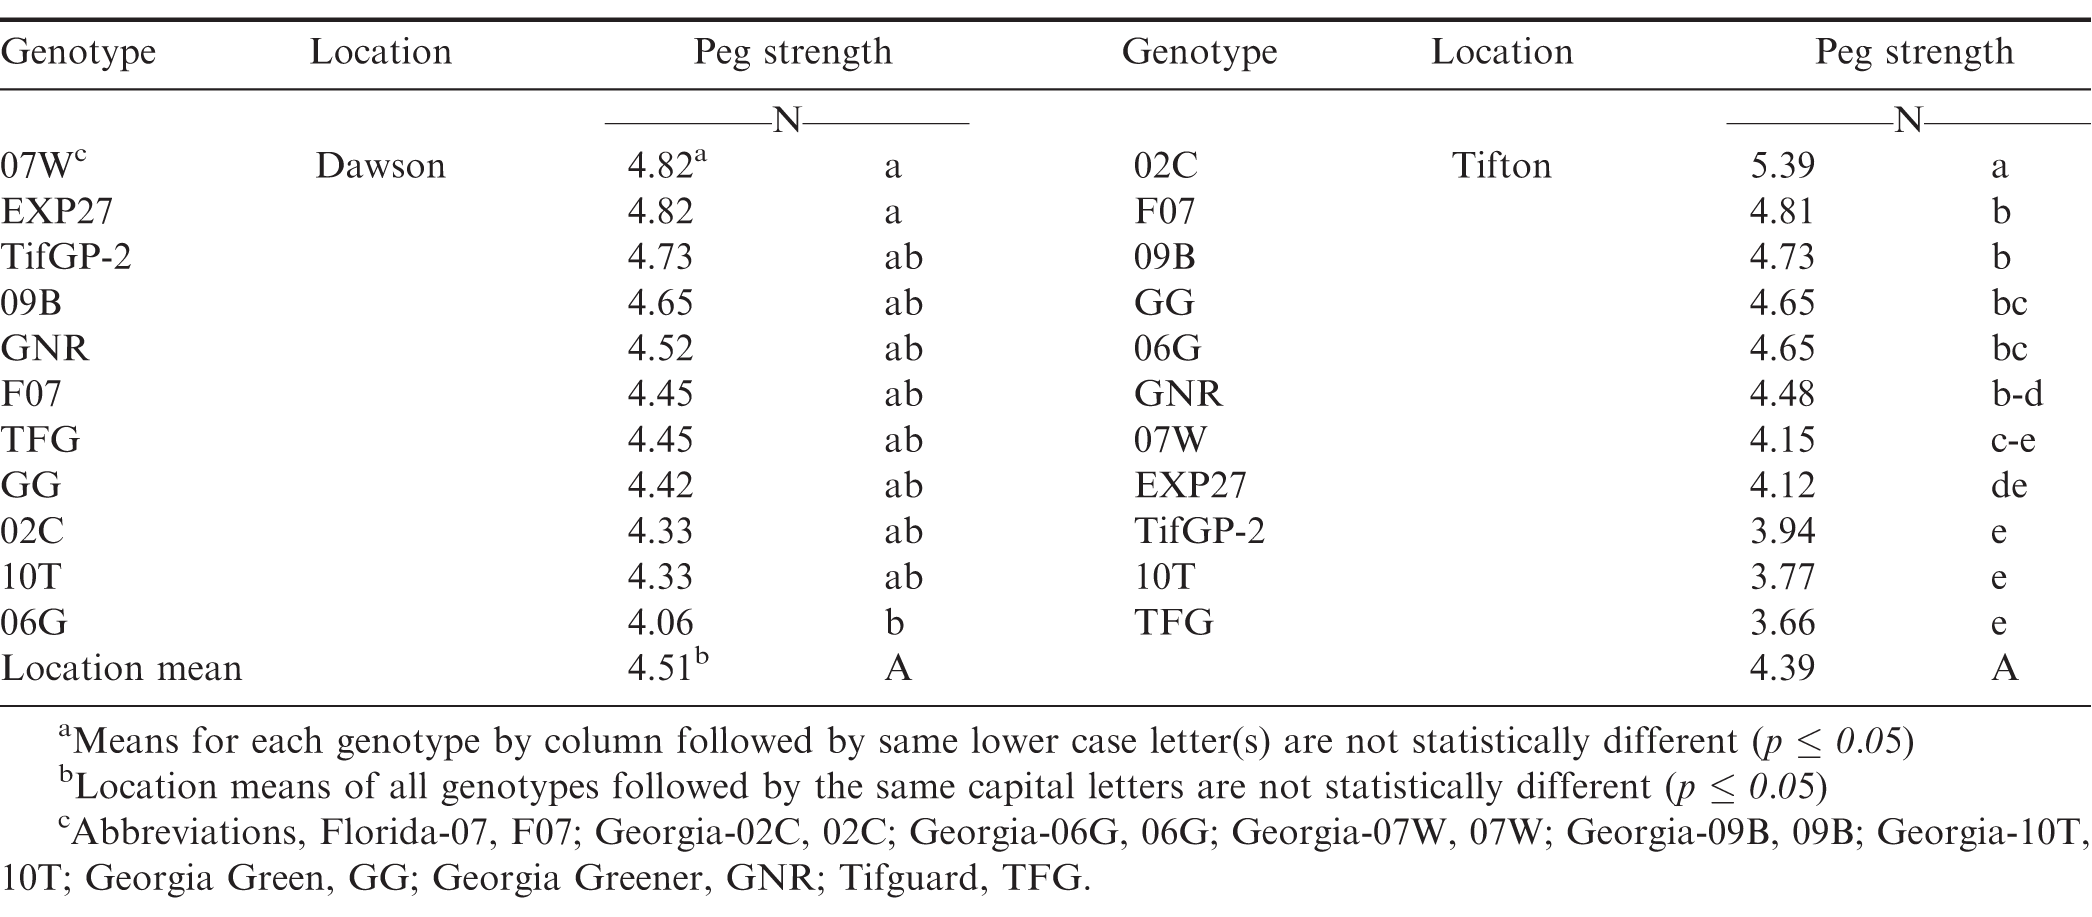
Average peg strength across harvest dates by genotype and location for 9 cultivars and 2 advanced breeding in Dawson and Tifton, Georgia in 2011.
In Dawson, there was no difference in average peg strength across harvest dates or within harvest date or cultivar by harvest date. In Tifton, there was no difference in average peg strength between early and mid-harvest date but the late harvest date peg strength was significantly lower when averaged across all cultivars (p=0.02; data not shown).
Pod Yield and Pod Loss - 2010
Table 3 shows the average pod yield and pod loss for both Dawson and Tifton in 2010. Average pod yield in 2010 was greater at the Dawson location (5474 kg/ha) across all harvest dates and cultivars compared with Tifton (3865 kg/ha). Within location, there were yield differences between genotypes (Table 3).
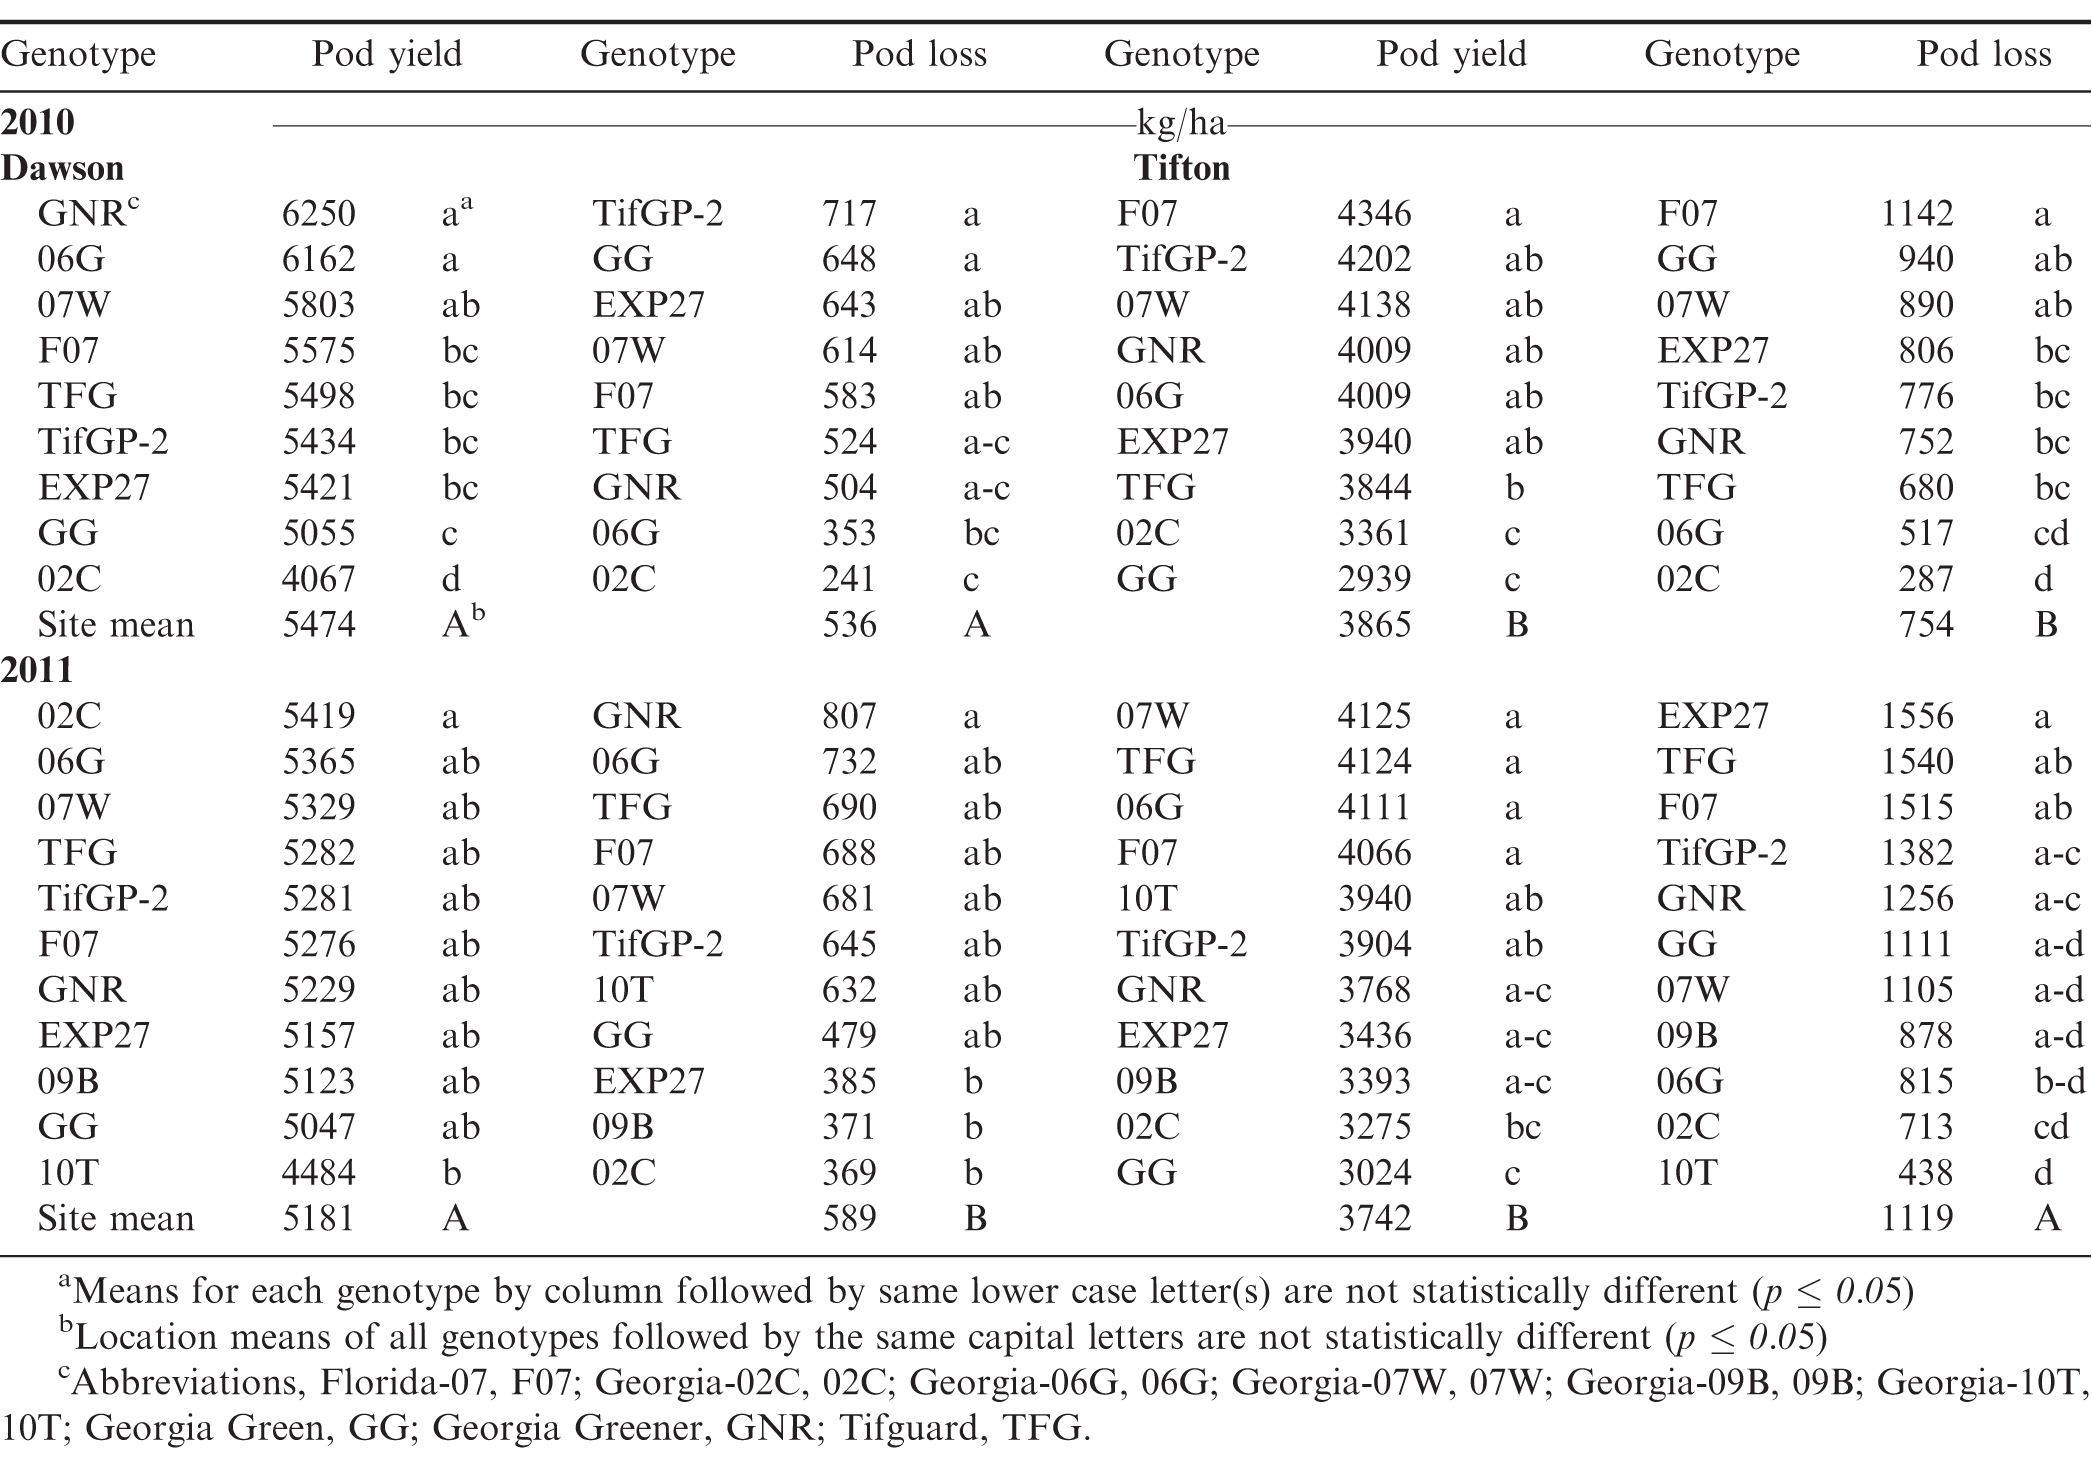
Average pod yield for 7 (2010) and 9 (2011) released cultivars and 2 advanced breeding lines in Dawson and Tifton, Georgia in 2010 and 2011.
When comparing pod yield across all harvest dates in 2010, the highest yielding genotypes at the Dawson location were GNR, 06G, and 07W while at the Tifton location the highest yielding genotypes were F07, TifGP-2, 07W, GNR, 06G, and EXP27 (Table 3). Conversely, the lowest yielding genotypes at Dawson were 02C and GG and at Tifton the lowest yielding genotypes were GG and 02C.
Average pod loss at Dawson (Table 3) across all cultivars and harvest dates was less (536 kg/ha) than in Tifton (754 kg/ha). Pod loss in Dawson ranged between 241 to 717 kg/ha while in Tifton, pod loss ranged between 287 to 1142 kg/ha. There does not seen to be any consistency of any one cultivar having greater pod loss, however, both 02C and 06G had the least pod loss across both sites.
Pod Yield and Pod loss - 2011
Table 3 shows the average pod yield and loss for genotypes in both Dawson and Tifton in 2011. Average pod yield was greater at the Dawson location (5181 kg/ha) across all harvest dates and cultivars compared with Tifton (3742 kg/ha). In Dawson, only 02C was significantly greater than 10T. There were no yield differences between the other cultivars. At the Tifton location cultivars 07W, TFG, 06G, and F07 had higher pod yield than 02C and GG.
Table 3 showed that pod loss at Dawson across all harvest dates and cultivars was lower (589 kg/ha) compared with pod loss at the Tifton site (1119 kg/ha). Pod loss was greater at the late harvest compared with the early and mid-harvest (data not shown). At the early harvest, GNR had the greatest pod loss compared with all other genotypes. In the mid harvest, 10T had less pod loss compared with 06G. By the last harvest TFG had greater pod loss than 10T, EXP27, and 09B. There was no clear cultivar or set of cultivars that had the highest or least amount of pod loss across harvest dates.
Pod yield and pod loss data for the 2010 and 2011 crop years and at both locations were analyzed using linear regression to identify possible relationships between pod yield and pod loss. Linear regression analysis showed an r2=0.07 which implies a small relationship between pod yield and pod loss. There was a better linear and non-linear (polynomial) relationship (r2=0.41 and 0.45, respectively) between harvest date and pod loss such that as time increased past the optimum harvest date pod loss increased by about 129 kg/harvest (data not shown).
On average, peanut cultivars 02C, F07, and 06G had the greatest peg strength and the least pod loss across both locations and years with 06G showing the greatest yield across both locations and years. The market dominance of one cultivar being planted versus another indicates yield stability over various soil types and environments. In this case, 06G has dominated the market place since its release in 2006 and in multiple locations due to its high yield and disease resistance characteristics (Brandon, 2012; Johnson, 2015). Data from this research may explain 06G's market dominance with consistently higher peg strength, high yield, and low pod loss. Other cultivars in this experiment may have had stronger peg strength, greater pod yield or lower pod loss but none were more consistent than 02C, F07, and 06G, across years, locations, and harvest dates.
Increased pod loss after the optimum digging date for all peanut cultivars has been well documented by previous researchers, extension personnel, and individual growers. The above data also shows peg strength will vary with individual cultivars as described by Thomas et al (1983) using 30 different genotypes (plant introductions). They showed that peg strength can vary greatly between genotypes. The variations among different genotypes indicated that peg strength is heritable. Thus, peg-strength values or strength characteristics may be valuable documentation for growers to compare existing and new peanut cultivars.
Acknowledgements
The authors would like to recognize and thank Tommy Bennett, Dan Todd, Bobby Haggler, Jesse Bolton, and Ernest Yoder for designing, building, and modifying the peanut scavenger/digging loss machine.
Literature Cited
Anonymous. 2014 variety guide. The Peanut Grower , http://www.peanutgrower.com/feature/2014-variety-guide
R.W Bauman, and A.J Norden (1971). Effect of growth regulators and reproductive characteristics of six peanut genotypes. J. Amer. Peanut Res. Educ. Assoc 3: 75- 86.
W.D Branch, (1996). Registration of 'Georgia Green' peanut. Crop Sci 36: 806.
W.D Branch, (2003). Registration of 'Georgia-02C' peanut. Crop Sci 43: 1883- 1884.
Branch, W.D 2007 a Registration of 'Georgia-06G' peanut J. Plant Registrations 1: 120.
Branch, W.D 2007 b Registration of 'Georgia Greener' peanut J. Plant Registrations 1: 121.
W.D Branch, and T.B Brenneman (2008). Registration of 'Georgia-07W' peanut. J. Plant Registrations 2: 88- 91.
W.D Branch, (2010). Registration of 'Georgia-09B' peanut. J. Plant Registrations 4: 175- 178.
W.D Branch, and A.K Culbreath (2011). Registration of 'Georgia-10T' peanut. J. Plant Registrations 5: 279- 281.
Brandon, H 2013 Peanuts: more and better variety option Delta Farm Press, 28 Mar. http://www.deltafarmpress.com/peanuts/peanuts-more-and-better-variety-options
Brown, S., J.W Todd, A.K Culbreath, J.A Baldwin, J.P Beasley, and B Kemerait 2002 a Managing spotted wilt of peanut. Bull. 1165R Georgia Agric. Exp. Sta., Tifton, GA.
Brown, S., J.W Todd, A.K Culbreath, J.A Baldwin, J.P Beasley, and B Kemerait 2002 b The 2002 Tomato spotted wilt risk index for peanuts In: G. H Harris (ed.) 2002 Peanut Update: 2002. Bulletin no. CSS-02-04. Georgia Agric. Exp. Sta. Athens, GA.
J.W Chapin, and J.S Thomas (2005). Effect of fungicide treatments, pod maturity, and pod health on peanut peg strength. Peanut Sci 32: 119- 125.
D.W Gorbet, and B.L Tillman (2009). Registration of 'Florida-07' peanut. J. Plant Registrations 3: 14- 18.
C.C., Holbrook, W Dong, P Timper, A.K Culbreath, and C.K Kvien, (2012). Registration of peanut germplasm line TifGP-2, a nematode-susceptible sister line of 'Tifguard'. J. Plant Registrations 6: 208- 211.
Johnson, C 2015 Building the perfect peanut The Furrow, John Deere Publication, http://johndeerefurrow.com/2016/03/27/building-the-perfect-peanut/
C.C., Holbrook, P Timper, A.K Culbreath, and C.K Kvien (2008). Registration of 'Tifguard' peanut. J. Plant Registrations 2: 92- 94
R.J., Thomas, R.E Pettit, R.A Taber, and B.L Jones (1983). Peanut peg strength: force required for pod detachment in relation to peg structure. Peanut Sci 10: 97- 101.
Sorensen, R.B., M.C Lamb, and C.L Butts 2015 Can peg strength be used as a predictor for pod maturity and peanut yield? Peanut Sci 42 (2): 92- 99 (doi:10.3146/0095-3679-42.2.92)
J.M., Troeger, E.J Williams, and J.L Butler (1976). Factors affecting peanut peg attachment force. Peanut Sci 3: 37- 40.
Notes
*Mention of proprietary product or company is included for the reader's convenience and does not imply any endorsement or preferential treatment by the USDA-ARS.
Author Affiliations
Research Agronomist, USDA-ARS, P.O. Box 509, Dawson, GA 39842.
Cotton Development Specialist, Dow AgroSciences, P.O. Box 120, Shellman, GA 39886.
Research Geneticist, USDA-ARS, P.O. Box 748, Tifton, GA 31793
Assoc. Prof. Crop, Soil and Environmental Sciences, Auburn Univ., Auburn, AL 36849
*Corresponding author, email: ron.sorensen@ars.usda.gov