

Introduction
Sufficient Ca in the pegging zone (upper 7 to 10 cm of soil) is crucially important for peanut pod development and therefore quality peanut (Arachis hypogaea L.) production. Many soil testing methods have been designed to evaluate available Ca in the soil for developing plants; however, none were specifically developed for peanut. A summary of four commonly used soil testing methods for Ca is provided in Table 1. Currently, recommendations of supplemental Ca for peanut production in many of the peanut producing states in the southeastern United States are based on the Mehlich 1 (M1) method (Mehlich, 1953) evaluated on pegging zone soil samples. The M1 method is used because it is a routine soil test for Ca, K, Mg, and P for all crops in this region, and is thus convenient for evaluation. Other methods, such as Mehlich 3 (M3) and 1 N neutral ammonium acetate (AA), are also widely used for Ca and may be used in other peanut producing regions (i.e., M3 in North Carolina). The M3 method was developed for a wider range of soils including soils with neutral or slightly alkaline pH (Mehlich, 1984), and AA was first developed to analyze exchangeable cations in the soil (Schollenburger and Simons, 1945). Correlations among the above-described methods for various soil nutrients have been intensively studied, and conversion equations have been provided for a wide range of soils (Hartzog and Adams, 1973; Mehlich, 1984; Michaelson et al., 1987; Sims et al., 1989; Beegle and Oravec, 1990; Evans and McGuire, 1990; Gascho et al., 1990; Gartley et al., 2002; Mylavarapu et al., 2002; Wang et al., 2004; Franklin and Simmons, 2005).
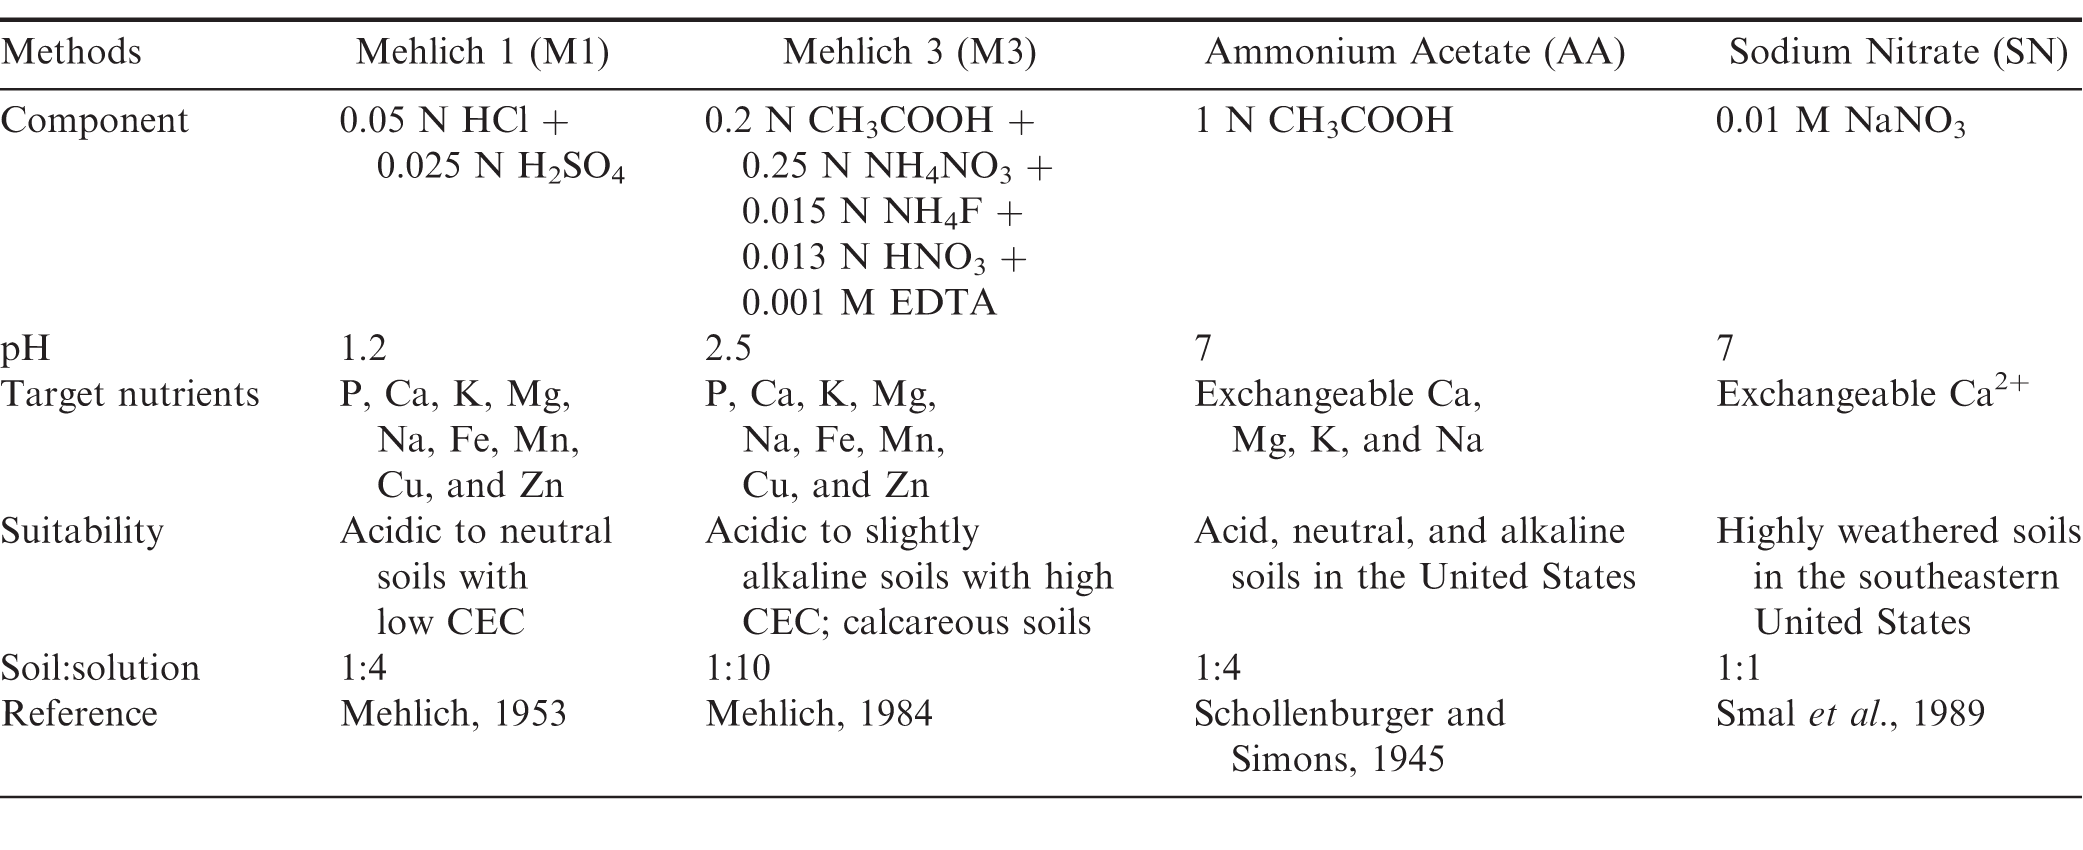
A summary of routine soil testing methods for Ca including Mehlich 1 (M1), Mehlich 3 (M3), 1 N neutral ammonium acetate (AA), and 0.01 M sodium nitrate (SN).
Some concerns have been raised about the accuracy of soil testing Ca for supplemental Ca recommendations for peanut production. Studies have shown that M1 may overestimate available Ca to developing pods in lime-amended soils, due to the dissolution of undissolved lime particles by the highly acidic M1 solution (Smal et al., 1989; Alva et al., 1990a). Previous studies also demonstrated that peanuts cultivated on soils with greater extractable Ca by AA method were not necessarily higher in yield than those grown on soils with lower AA-extractable Ca, indicating that AA-extractable Ca is an inaccurate indicator of Ca availability to peanut (Alva et al., 1989). In order to improve the predictability of soil test Ca for peanut production, a diluted salt solution, 0.01 M sodium nitrate (SN), was proposed by Smal et al. (1989) in Georgia. Their results indicated that peanut yield, grade, and pod rot were better correlated with Ca extracted by the SN solution than by M1 (Smal et al., 1989) using the boundary line method by Webb (1972). These results have not been widely verified by other researchers, and this method has not been widely adopted by public or private soil testing programs in major peanut growing regions.
Soil Ca is not the only criteria that should be used to provide accurate peanut fertility recommendations. The Ca/K ratio also should be considered when determining whether a soil is limited by Ca. When the Ca/K ratio is 3:1, the capability of peanut to absorb Ca may be limited (Alva et al., 1989), possibly due to competition between Ca and K for plant uptake. High concentrations of K may also limit Ca diffusion to the pod. Sullivan et al. (1974) found that application of K fertilizers reduced peanut yield, percentage of sound mature kernels (SMK), proportion of extra-large kernels, and tended to increase the incidence of dark plumule; however, negative effects of K application were not noted when Ca fertilizer was also applied. Conversely, over-application of Ca may limit availability of K and Mg to the peanut plant and subsequently reduce yield, especially when soil K and Mg are very low. Because of these noted interactions between Ca, K, and Mg, there have been some efforts to incorporate these factors into recommendations. In Georgia, current recommendations for peanut include supplemental Ca if soil Ca in the pegging zone is 250 mg/kg and the Ca/K ratio is 3:1 (Kissel and Sonon, 2008). The activity ratio of Ca, defined as mol Ca per mol of the sum of Ca, K, and Mg, has also been used as an effective indicator of Ca availability for peanut production. Optimal relative yield per fruit cavity, defined as seed weight per number of cavities, occurred with an activity ratio of 0.25 (Wolt and Adams, 1979). Although the ratio of Ca to Mg and K has been recognized to be important for peanut production, there are few studies that have evaluated the effect of Ca fertilization on soil extractable Mg and K for peanut production. Due to the differences among extractant solutions, relationships among methods in context of Ca supplementation need to be evaluated.
The objective of this study is to compare relationships among the common soil Ca tests, M1, M3, AA, and SN for pegging zone soils of the southeastern United States, determine effects of recent field applications of gypsum and lime on soil test Ca, Mg, and K, and evaluate the ability of soil Ca tests for correct evaluation of Ca availability for peanut.
Materials and Methods
Soil samples were taken from Ca supplementation field trials conducted at the Wiregrass Research and Extension Center (WREC) in Headland, AL (31.36°; N, 85.32°; W), and the Gulf Coast Research and Extension Center (GCREC) in Fairhope, AL (30.55°; N, 87.87°; W), in 2012 and 2013. Study sites at each location were not the same in 2012 and 2013 to avoid carryover effects of gypsum or lime from the previous season. Soil series include Dothan sandy loam (fine-loamy, kaolinitic, thermic Plinthic Kandiudults) and Lucy loamy sand (loamy, kaolinitic, thermic Arenic Kandiudults) at WREC, and Malbis fine sandy loam (fine-loamy, siliceous, subactive, thermic Plinthic Paleudults) at GCREC. The field trials were organized as randomized complete block designs with 4 replications under irrigated and non-irrigated conditions. Soil samples were taken from the following treatments: untreated control, 1120 kg/ha gypsum (251 kg Ca/ha) applied at early bloom, and 1120 kg/ha lime (381 kg Ca/ha as calcitic lime at WREC and 437 kg Ca/ha as dolomitic lime at GCREC) applied at planting. Lime was applied prior to planting due to its lower solubility, which requires more time to dissolve in soil than gypsum. Pegging zone soil samples (top 7 cm of soil) were collected from each plot immediately prior to planting and any Ca amendment and at mid-bloom after application of lime and gypsum. Mid-bloom is ∼70 days after lime application and ∼30 days after gypsum application. All pegging zone soil samples were composite samples of 14 individual samples collected from each plot with a hand-held soil probe, dried at 60 C for 48 h, ground using a mortar and pestle, and sieved to pass a 2-mm screen.
Soil Ca, Mg, and K were determined using four different soil testing methods (Table 1): M1 (Mehlich, 1953), M3 (Mehlich, 1984), AA (Schollenburger and Simons, 1945), and SN (Smal, et al., 1989). For M1 and AA tests, 5 g soil was shaken in a centrifuge tube with 20 mL extracting solution for 5 min. The M3 test uses a soil/solution ratio (w/v) of 1:10. For this test, 20 mL of M3 solution was added to 2 g soil and shaken for 5 min. The suspensions from M1, M3, and AA extractions were centrifuged at 900 rcf for 10 min and the supernatant filtered through Whatman No. 40 filter paper (GE Healthcare Life Sciences, Pittsburgh, PA). For SN test, a soil solution ratio (w/v) of 1:1 was used. Briefly, 20 g soil was shaken in a centrifuge tube with 20 mL 0.01 M SN solution for 30 min, centrifuged at 1400 rcf for 20 min, and filtered through Whatman No. 42 filter paper (GE Healthcare Life Sciences, Pittsburgh, PA). The filtrate from all extractant solutions was analyzed for Ca, Mg, and K by inductively coupled plasma atomic emission spectroscopy (ICP-AES, Spectro Ciros CCD, side on plasma, SPECTRO Analytical Instruments Inc., Kleve, Germany).
Peanut yield from treatment plots was determined at harvest after peanuts were dried to approx. 10% moisture. In order to combine yield data from multiple site-years, relative yields, which represents the yield of the plot compared to the mean yield of the untreated control treatment for that site-year, were calculated for each experimental plot. Thus, relative yields could exceed 100%. Peanut grade represents the percentage of SMK in a 250 g sample. The SMKs were then dried at 60 C for 48 h, finely ground in a coffee grinder (Hamilton Beach Inc., Picton, Canada), and microwave digested using a Mars Xpress microwave (CEM Corp., Matthews, NC) using modified EPA-3051 procedure (USEPA, 1994) prior to Ca determination by ICP-AES. In detail, 1 g finely ground peanut sample was pre-digested overnight in 10 mL 30% (v/v) hydrogen peroxide (H2O2) and then microwave digested with 10 mL concentrated nitric acid (HNO3) for 15 min. The digested solution was filtered using Whatman No. 40 filter paper, and the volume was adjusted to 100 mL with deionized water before analysis by ICP-AES.
The recovery of Ca from various sources of gypsum and lime in M1, M3, AA, and SN was also analyzed. Three types of gypsum including Agri-Cal, which is flue gas desulfurized (FGD) gypsum (AGRI-B Plantation LLC, Albany, GA); USG® 500, which is naturally mined gypsum (United States Gypsum Company, Chicago, IL); and PCS Wetbulk, which is phosphogypsum (PotashCorp, White Springs, FL) were used along with two types of agricultural lime including calcitic lime (Tri-State Lime LLC, Arlington, GA) and dolomitic lime (Farmer's Favorite Fertilizer Company, Moultrie, GA). A large solution/solid ratio (> 1000/1, v/w) was used to assure that the solubility of gypsum and lime was not limiting Ca recovery. In detail, 200 mg gypsum material was measured and shaken with 250 mL extractant solution for 2 h, while 4 mg lime with 500 mL extractant solution. The suspension was allowed to settle for 1 h and the supernatant was filtered using Whatman No. 42 filter paper. Concentration of Ca in filtrate was analyzed by ICP-AES. Total Ca in each amendment was analyzed similarly to seed Ca using the EPA-3051 procedure without the hydrogen peroxide pre-treatment. Calcium recovered by each extracting solution represents a percentage of total Ca in each Ca amendment. Four analytical replications were performed for each amendment.
Mixed model methodology as implemented in SAS PROC GLIMMIX were used to analyze the soil Ca, K, and Mg data obtained at mid-bloom (Littell et al., 2006). This specific sampling time was used because it is indicative of peak reproductive growth (Brady, 1947; Mizuno, 1959), during which a majority of applied Ca would be expected to be absorbed by developing pods. Soil test, Ca treatment, and location were treated as fixed effects, whereas year and block were the random effects. To test for differences among main effects and their interactions, the Tukey adjustment was applied to the least square means (LSMEANS) statement of SAS 9.3 software (SAS Institute Inc., Cary, NC, USA). Analysis of covariance (ANCOVA) methodology as implemented in SAS was used to evaluate effect of treatment (e.g., gypsum and lime) and sampling time (e.g., pre- and post-gypsum/lime) on correlations among different soil tests. Sampling time was treated as covariate. Relationships of pegging zone Ca, K, and Mg assessed by M1, M3, AA, and SN were analyzed using Deming regression as implemented in Sigma Plot 12.5 software (Systat Software, San Jose, CA, USA). The boundary line method developed by Webb (1972) was used to evaluate correlations between soil test Ca and peanut relative yield, grade, and seed Ca concentration. For this analysis, only soil samples taken at mid-bloom (60-70 DAP) were used. Data points with the largest 5% of Mahalanobis distances were treated as outliers and removed (Shatar and McBratney, 2004). Then, all soil Ca values were divided into 25 units containing equal number of data points. Maximum relative yield, grade, seed Ca concentration, and corresponding soil Ca value within each unit were identified and combined to form a data subset. The boundary line was fitted using the data subset in Sigma Plot 12.5 software.
Results and Discussion
Method comparison of extractable Ca, K, and Mg
There was no significant location effect on soil Ca (P = 0.32), K (P = 0.68), or Mg (P = 0.22), therefore, data were combined for both locations to determine effects of soil tests and Ca treatment on soil Ca, K, and Mg. Extractable Ca, Mg, and K by the M1, M3, AA, and SN methods were notably different (P 0.001), and no significant Ca treatment × soil test interaction on Ca (P = 0.60), K (P = 0.90), or Mg (P = 0.70) was observed; therefore, data were combined for all Ca treatments to evaluate effect of soil tests on soil extractable Ca, Mg, and K (Table 2). Soil Ca extracted by M1 and M3 were similar. The AA test extracted approximately 30% less Ca than was extracted by M1 and M3; however, the trends were inconsistent for K and Mg. The M3 and AA tests extracted significantly greater amount of K than M1, whereas the amount of soil Mg extractable by M1, M3, and AA were similar (Table 2). The SN test extracted considerably less Ca, K, and Mg than the other three tests, possibly because this solution is very dilute and has a neutral pH.
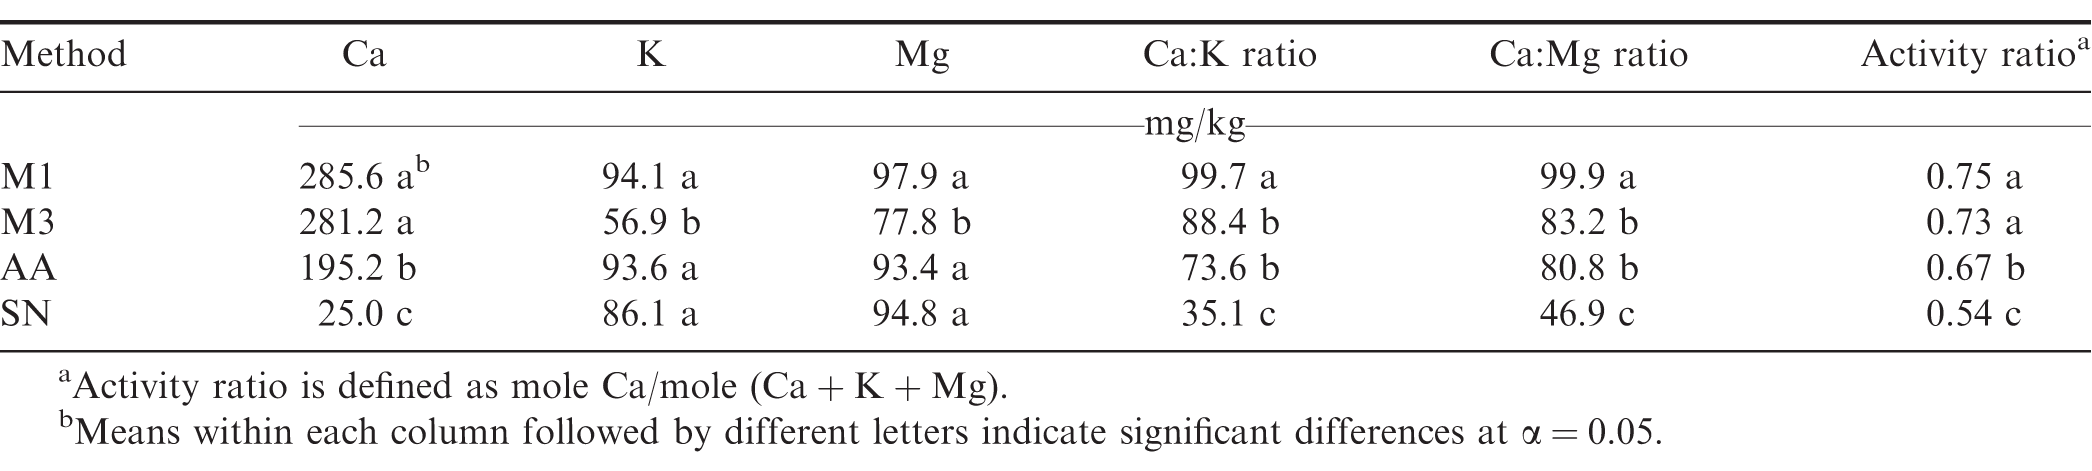
Soil Ca, K, Mg, Ca:K ratio, Ca:Mg ratio, and activity ratio of Ca determined using Mehlich 1 (M1), Mehlich 3 (M3), 1 N neutral ammonium acetate (AA), and 0.01 M sodium nitrate (SN) methods. Data were combined for all Ca treatments due to lack of Ca treatment × soil test interaction.
Significant variations of soil test Ca, K, and Mg have been reported due to diverse soils used by different studies. For example, using soils from central Florida, Alva (1993) reported that soil Ca and Mg by M3 were 20% lower than those by M1, but M3 extracted 20% more K than M1. For five soils from Coastal Plain of Georgia, soil Ca, K, and Mg by M1 and M3 were similar (Gascho et al., 1990). Previous studies, together with the current research suggest separate conversion equations are necessary for different soils.
Due to the varied trends for Ca, K, and Mg by different soil tests, the Ca/K ratios for each test were drastically different, ranging from 2.2 by the SN test to 9.5 by the M1 test (Table 2). The Ca/Mg ratio and activity ratio of Ca were significantly different as well. The M1 and M3 tests gave similar Ca/Mg ratio and activity ratio of Ca, which were significantly greater than those provided by the AA and SN tests (Table 2).
Method comparison of Ca extraction from gypsum and lime materials
In order to more thoroughly evaluate the contribution of Ca supplementation to correlations among soil extractable Ca, the four soil tests were evaluated directly on various Ca sources including FGD gypsum, mined gypsum, phosphogypsum, calcitic lime and dolomitic lime. Recovery of Ca from FGD, which is the gypsum used in the field study, and two other types of gypsum did not differ using M1, AA, and SN methods (Table 3). Alva et al. (1989) compared recovery rate of seven gypsum materials with various particle sizes and also found that the recovery of Ca using M1 and SN for finely powdered gypsum was not significantly different. Therefore, it is likely that if any undissolved gypsum particles were present in the soil sample, the M1, AA, and SN tests were able to completely dissolve them, and the relationships among the tests would not be significantly affected. Recovery of Ca using the M3 test was significantly lower than with the other tests. This is not consistent with comparison of M1 and M3 methods, which were approximately the same. In order to better understand this contradictory issue, the chemical speciation program MINTEQA2 (USEPA, 2006) was used to calculate the composition of equilibrated M1, M3, AA, and SN solution after shaking with gypsum. Results showed that fluoride (F-), which is dissociated from ammonium fluoride (NH4F) in M3 solution could react with Ca from gypsum and form calcium fluoride (CaF2) precipitant, which would be removed through filtration. Therefore, the M3 test recovered less Ca from gypsum than the other tests. In the current study, the mid-bloom soil samples were taken 30 d after gypsum was applied. A majority of gypsum may have been dissolved with sufficient rainfall and absorbed by peanut, or leached out of the pegging zone, thus inclusion of undissolved gypsum particles is less likely in this study. Therefore, correlations for soil test Ca among different tests were similar in untreated and gypsum-treated soils.
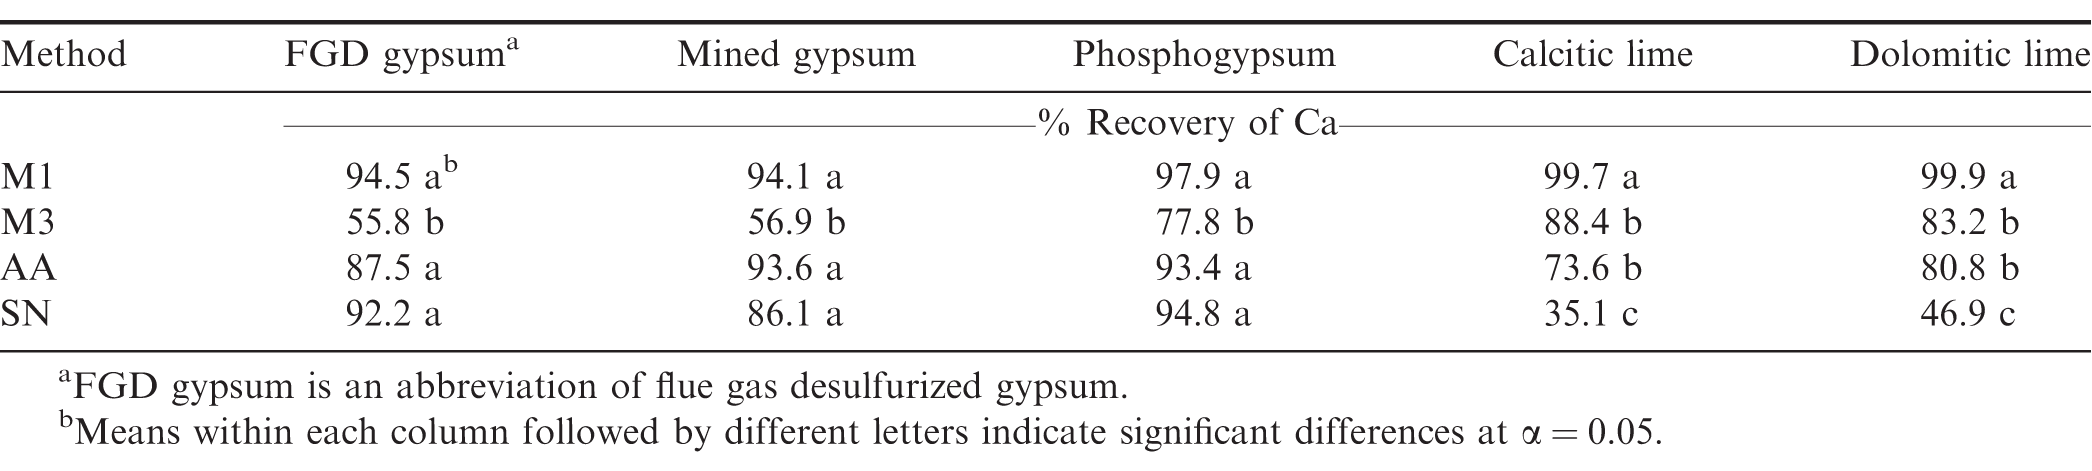
Recovery of Ca from different Ca amendments using Mehlich 1 (M1), Mehlich 3 (M3), 1 N neutral ammonium acetate (AA), and 0.01 M sodium nitrate (SN) extracting solutions. Calcium recovered in each extracting solution was calculated as a percentage of total Ca in the Ca amendment.
Recovery of Ca from the two agricultural limes using the M1 method was 25, 50, and 200% greater than with M3, AA, and SN (Table 3). This is likely due to the low pH of the M1 method (pH 1 to 2), which enhances solubilization of the lime. In addition, strongly retained Ca on the exchange complex may be extractable with M1, but it is less extractable in dilute salt solutions such as SN (Alva et al., 1990). Therefore, M1 could overestimate available soil Ca in recently limed soils, compared to M3, AA, and SN. The likelihood and magnitude of overestimation may depend on the time of application and particle size of the liming material. If lime is applied well in advance of the date of sampling (e.g., > 6 mo before the sampling date), undissolved lime in soil samples is less likely to be present (Smal et al., 1989; Alva et al., 1990b). Particle size of lime may also affect dissolution and thus the chance of undissolved lime in soils, because fine particles are more easily dissolved than coarse particles. More than 50% of particles in the lime used in the current study were 1 mm. A large proportion of lime may have been dissolved with rainfall, especially in 2013, which was a particularly wet year. Therefore, unrealistically high M1-Ca in lime-amended soils was not observed in this study, but could be a factor in drier years.
Effect of Ca supplementation on extractable soil Ca, K, and Mg
Application of Ca supplements showed inconsistent influence on extractable Ca (P = 0.11), Mg (P 0.01), and K (P 0.01). Due to lack of Ca treatment × soil test interaction (P > 0.5), data were combined for all soil tests to evaluate the effects of Ca supplements. Calcium supplementation in this study did not significantly elevate soil Ca level (Fig. 1), which may be attributed to dissolution and leaching caused by high rainfall soon after application. Studies have demonstrated that following a high intensity rainfall over a few days, which is the typical rainfall pattern in the southeastern U.S., a significant amount of gypsum (e.g., > 50%) could be leached out of the pegging zone (Alva et al., 1989; Alva et al., 1990a; Alva and Gascho, 1991; Keisling and Walker, 1978). In 2013, more than 600 mm rainfall was received within 30 days following gypsum application at WREC and GCREC, a majority of applied gypsum or lime may have been leached, or absorbed by peanut pods by the date of sampling (30 or 70 d after application for gypsum and lime, respectively); therefore, overall effect of Ca supplementation was not significant. Lime has a lower solubility than gypsum, thus a slightly greater soil Ca in lime-treated soils relative to gypsum-treated soils was observed.
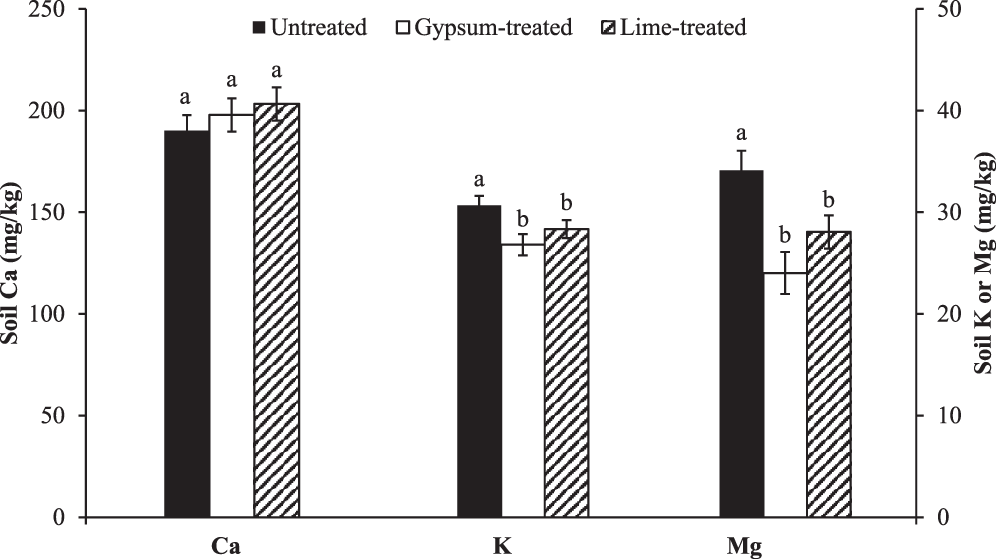
Soil Ca, Mg, and K in untreated, gypsum-treated, and lime-treated soils. Data were combined for all soil testing methods due to lack of Ca treatment × soil testing method interaction. Means for each element followed by different letters indicate significant differences at 𝜶 = 0.05.
Addition of gypsum and lime notably decreased soil Mg and K extraction from the pegging zone relative to the untreated control (Fig. 1). Previous studies have reported that high Ca fertilization may reduce availability of K and Mg in the pegging zone, possibly due to competition among Ca, K, and Mg for plant absorption (Alva and Gascho, 1991; Hallock and Allison, 1980b). It is also possible that Ca from gypsum and lime displaced K and Mg from cation exchange sites and made them more susceptible to leaching.
Correlations among soil tests for Ca
Even though there was no Ca treatment × soil test interaction, some of the relationships among Ca extracted by M1, M3, AA, and SN differ. Regression lines were fitted separately by locations first. Slopes of regression lines at different locations were not notably different (P = 0.49); therefore, data were combined for both locations and the regression lines among different soil tests was fitted to determine effects of Ca amendments on the correlations among the soil tests. Soils taken at mid-bloom were used. The correlations between M1 and M3 (r2 > 0.9), M1 and AA (r2 > 0.9), M1 and SN (r2 > 0.8) were strong in untreated and gypsum-treated soils (Fig. 2); however, application of lime notably weakened the correlations, especially between M1 and SN (r2 = 0.51; Fig. 2I). Results indicate that conversion of data from one method to another is less accurate in lime-treated soils than untreated or gypsum-treated soils. Results also showed that slopes of regression lines for soil Ca in untreated and gypsum-treated soils were not significantly different between M1 and M3 (P = 0.78), M1 and AA (P = 0.81), and M1 and SN (P = 0.35) (Fig. 2), suggesting that applied gypsum had little effect on the relationship among the methods. Since the solubility of gypsum (2.6 g/L) is relatively high, gypsum dissolution is likely to have occurred in the field or during extraction with the soil test. This is especially true in this case because a finely powdered form of gypsum was used.
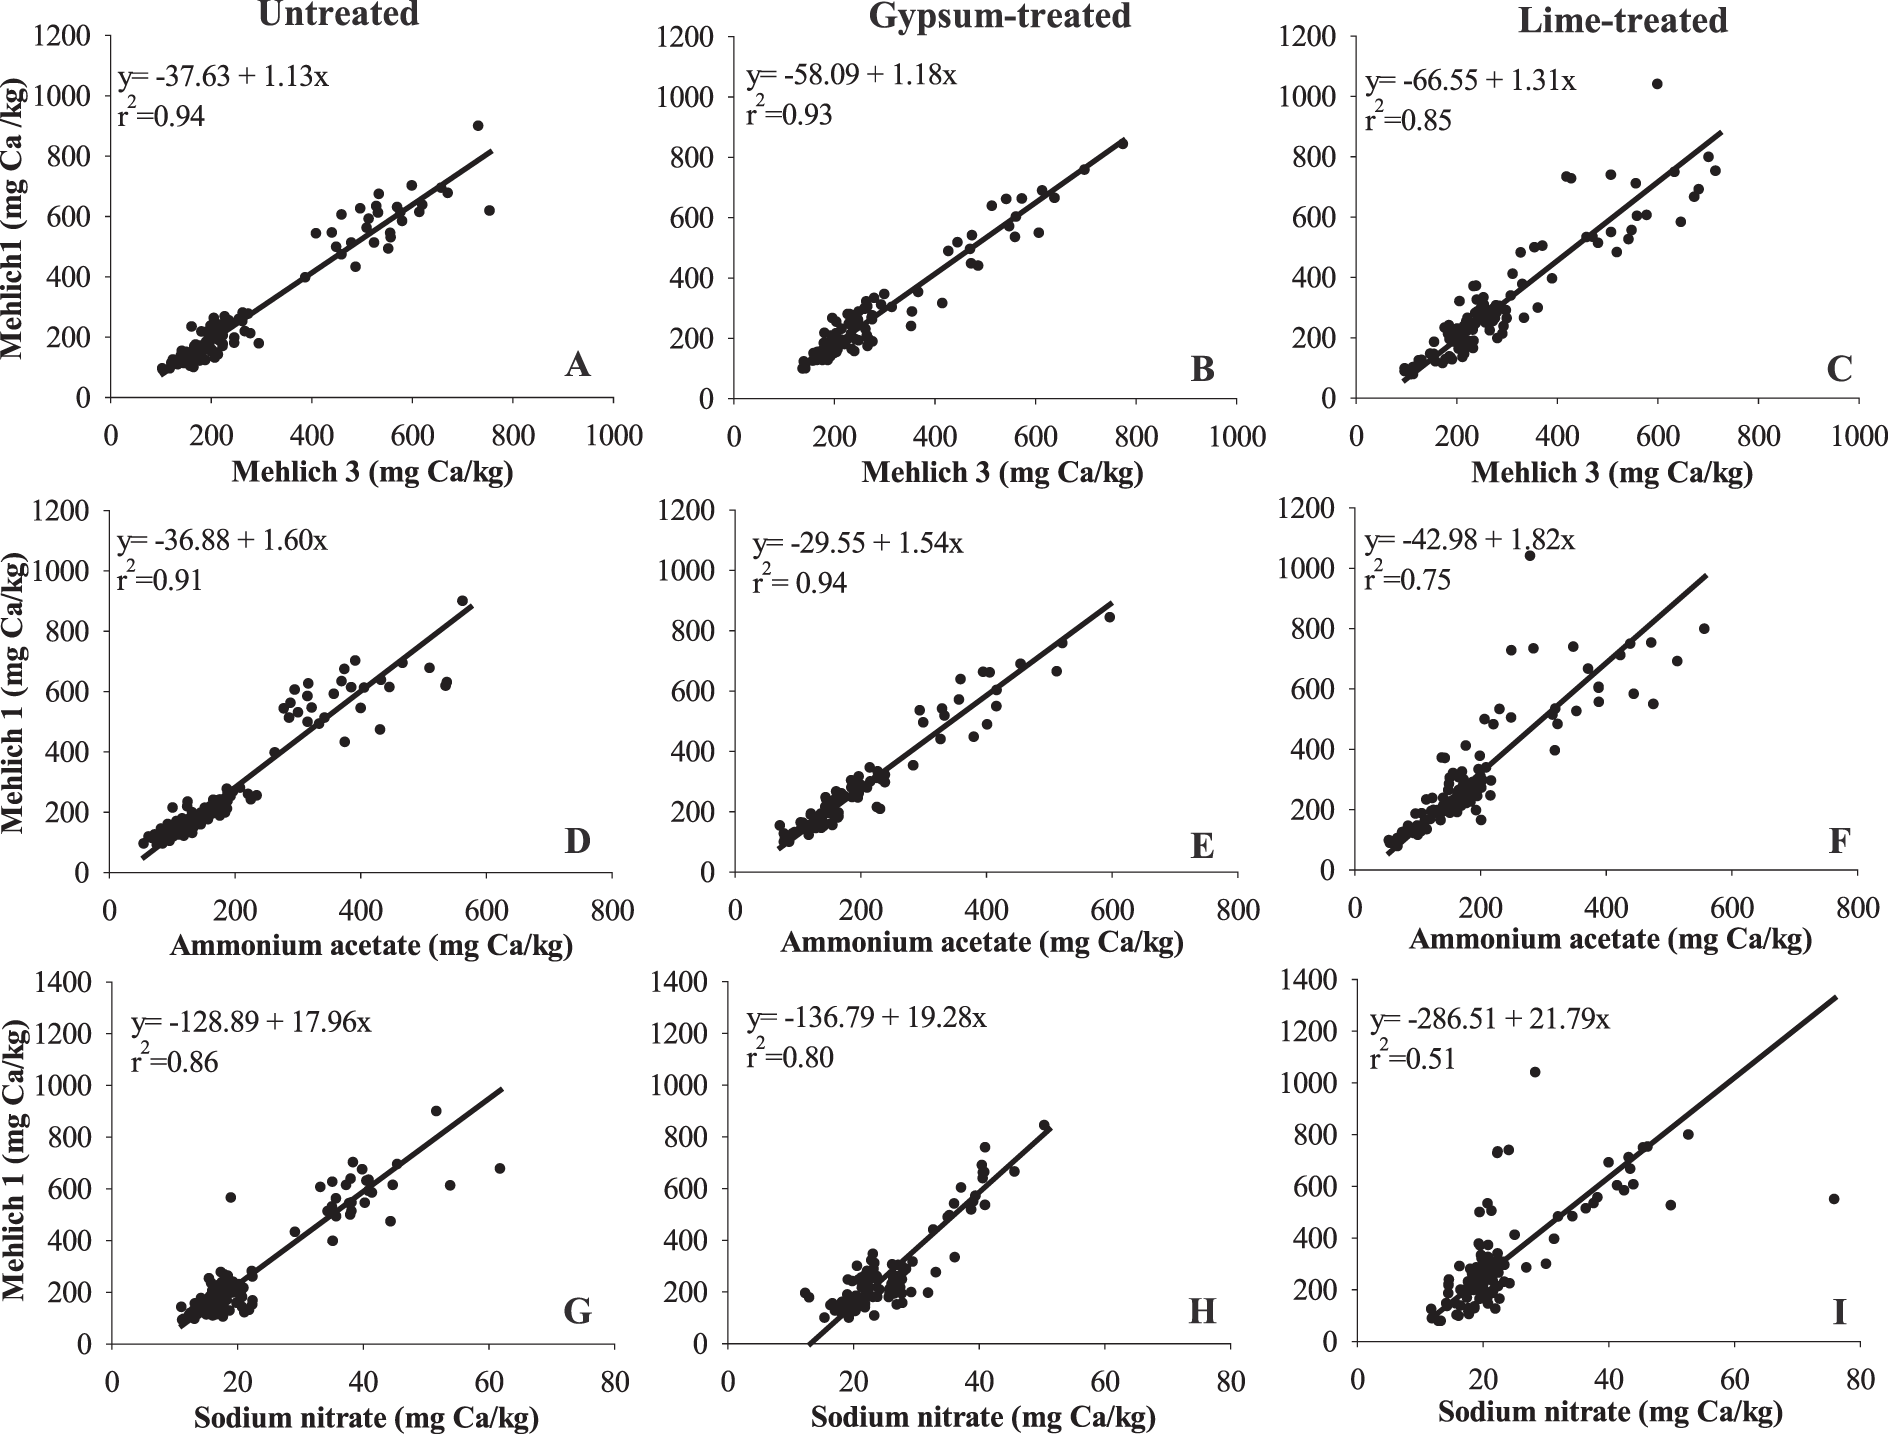
Relationships between soil Ca extractable by Mehlich 1 (M1) and (A-C) Mehlich 3 (M3), (D-F) 1 N neutral ammonium acetate (AA), and (G-I) 0.01 M sodium nitrate (SN) methods in untreated (A, D, G), gypsum-treated (B, E, H), and lime-treated (C, F, I) soils sampled at mid-bloom, which was 30 d after gypsum application and 60-70 d after lime application.
The slopes of regression lines for soil test Ca in lime-treated soils between M1 and M3 (P 0.001), M1 and AA (P = 0.001), and M1 and SN (P 0.001) were significantly higher than in untreated and gypsum-lime soils (Figure 2), suggesting that relationships among soil tests are different when lime has been applied shortly (70 d in this study) before soil sampling. This indicates that M1 extracts more Ca than M3, AA, and SN in lime-treated soils than in untreated or gypsum-treated soils. Alva et al. (1990b) reached the same conclusion using a greenhouse incubation study, which had relatively uniform initial soil Ca in each pot since soils were thoroughly mixed before the study. In current field study, however, initial soil Ca varied among locations and years. Initial soil Ca at WREC (195 mg/kg) was significantly lower than that at GCREC (513 mg/kg) for both growing seasons. At WREC, average soil Ca for 2012 was 220 mg kg-1, which is significantly greater than the following year (170 mg mg/kg). Soil Ca fertility was not evenly distributed across the plots within locations. For example, 60% of the untreated control plots had greater background Ca (191 mg kg-1) than gypsum-treated plots (163 mg/kg) in 2012 at WREC. These variations in initial soil Ca levels may affect the abovementioned correlations as data obtained solely at mid-bloom was used. Therefore, soil samples taken from the same plots before and after application of gypsum and lime was used to further verify these results.
Soils taken prior to planting were defined as pre-gypsum and pre-lime, while those taken at mid-bloom after gypsum and lime application were defined as post-gypsum and post-lime. Using this method of comparison, variation among plots can be reduced, and evidence of differences in extraction would be reflected by different slopes. Slopes of regression lines between M1 and M3 (P = 0.81), M1 and AA (P = 0.66), and M1 and SN (P = 0.88) in pre- and post-gypsum soils did not differ significantly (Fig. 3), whereas slopes of regression lines between M1 and M3 (P = 0.01), M1 and AA (P = 0.02), and M1 and SN (P 0.001) in post-lime soils were significantly greater than in pre-lime soils (Fig. 4). Results clearly show the differences in methods in extracting undissolved lime. In particular, M1 extracts more Ca than other methods when lime is present. Results can be attributed to enhanced dissolution of undissolved lime in the soils by M1, since lime has a lower solubility (0.01 g/L) relative to gypsum (2.6 g/L) but enhanced dissolution in strong acids.
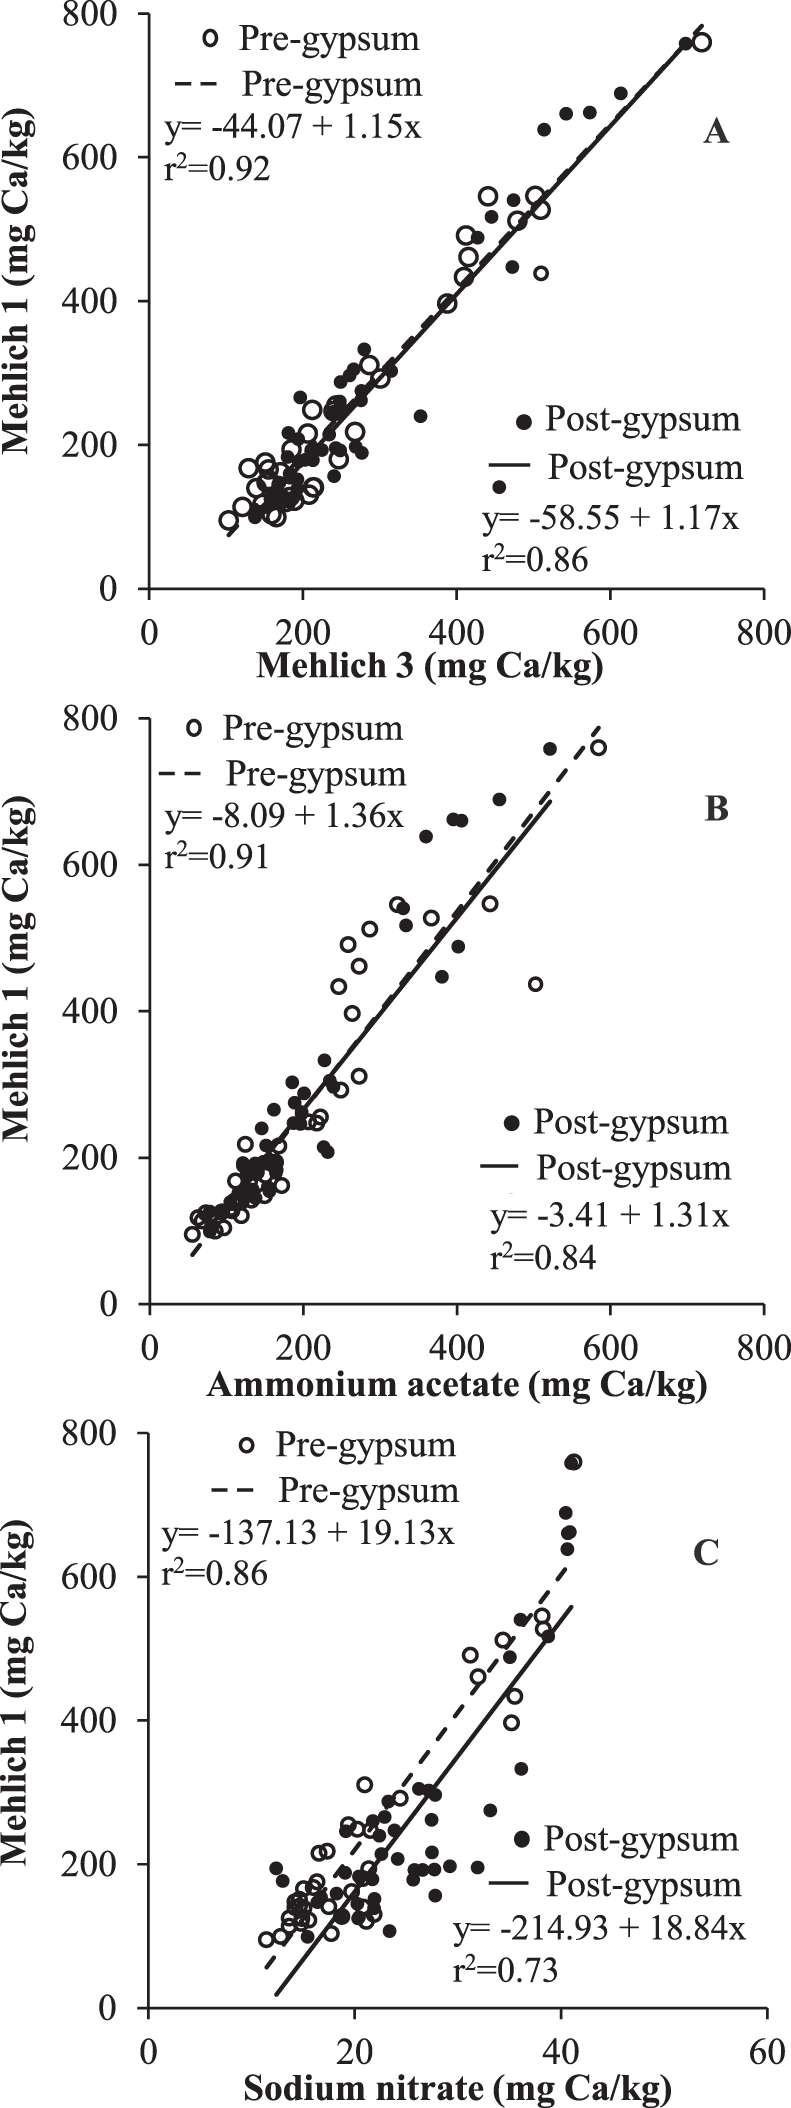
Relationships between soil Ca extractable by Mehlich 1 (M1) and (A) Mehlich 3 (M3), (B) 1 N neutral ammonium acetate (AA), and (C) 0.01 M sodium nitrate (SN) methods in pre- and post-gypsum soils. Pre- and post-gypsum data points represent soil samples taken before and 30 d after gypsum application.
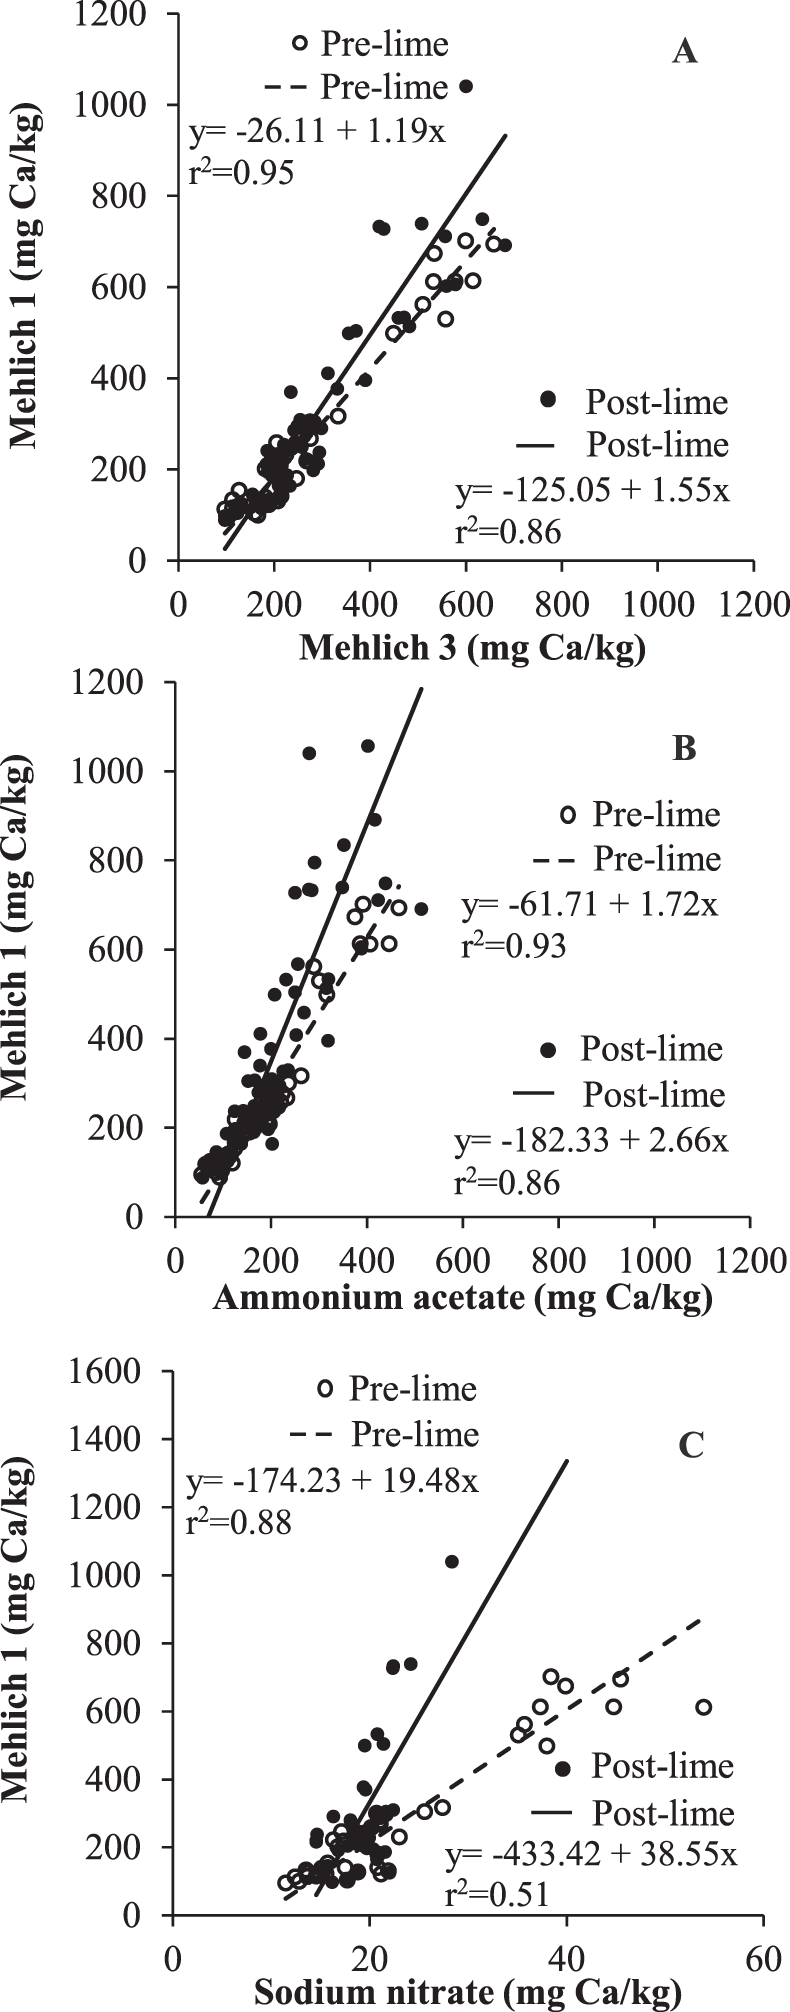
Relationships between soil Ca extractable by Mehlich 1 (M1) and (A) Mehlich 3 (M3), (B) 1 N neutral ammonium acetate (AA), and (C) 0.01 M sodium nitrate (SN) methods in pre- and post-lime soils. Pre- and post-lime data points represent soil samples taken before and 60-70 d after lime application.
Correlations among soil tests for Mg and K
Relationships between the soil test methods for K were evaluated to generate approximate conversion equations. Data were combined for all locations and Ca treatments due to a lack of location effect and Ca treatment × soil test interaction. There were strong correlations for K extracted by M1, M3, and AA (r2 > 0.7); however, M1 and SN were poorly correlated (r2 = 0.37, Fig. 5C). Strong correlations between M1 and SN for K have been reported (Alva et al., 1989, 1990b), but these studies used a soil/solution ratio of 1:4 for SN extraction rather than the 1:1 ratio reported in the original method (Smal et al., 1989) and used in the current study. Different soil solution ratios could affect the extraction process and result in different correlations.
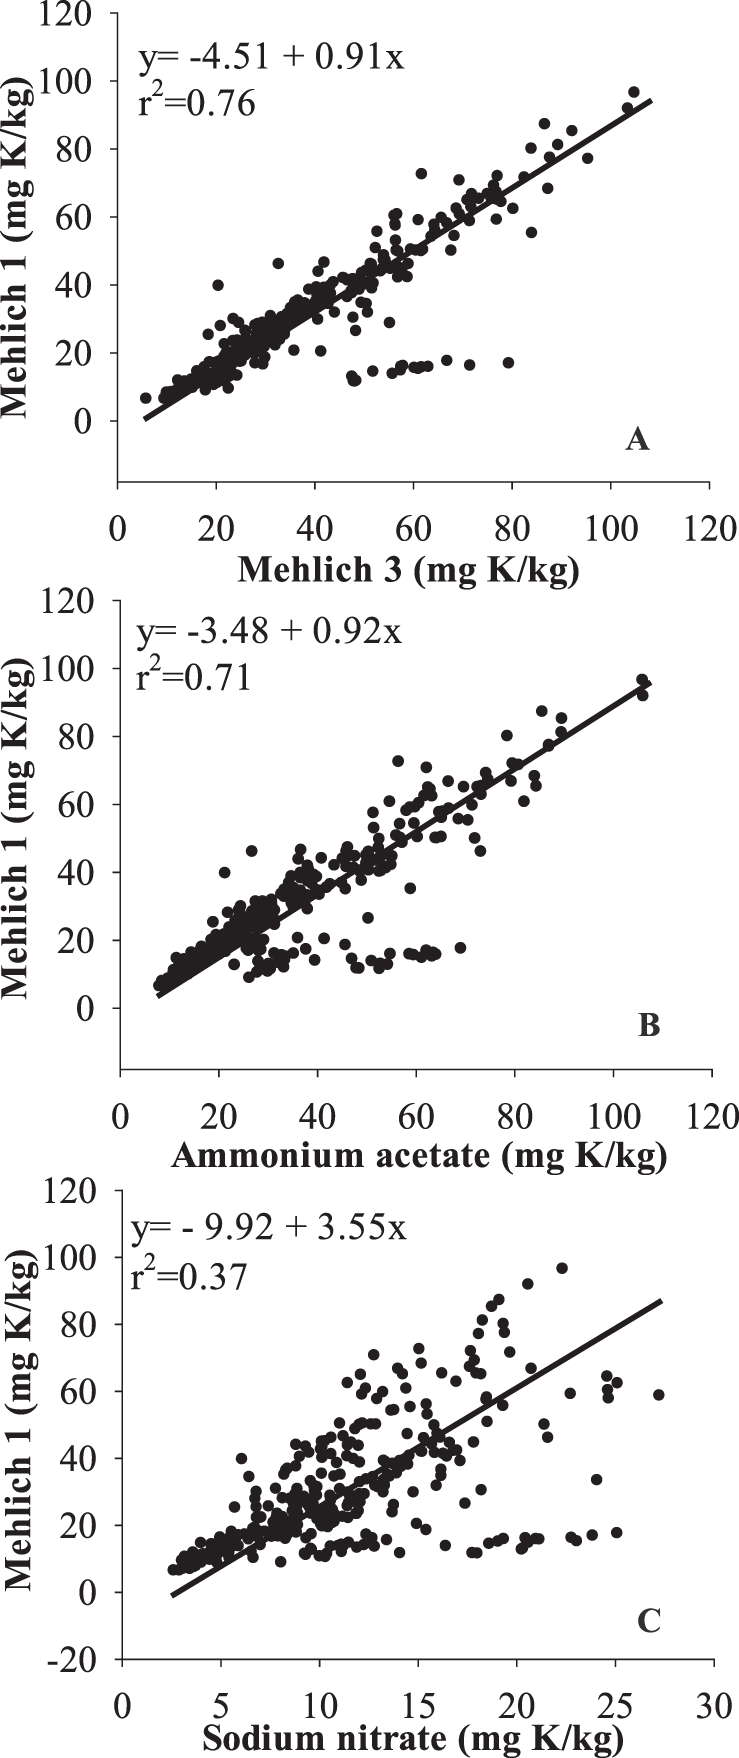
Relationships between soil K extractable by Mehlich 1 (M1) and (A) Mehlich 3 (M3), (B) 1 N neutral ammonium acetate (AA), and (C) 0.01 M sodium nitrate (SN) methods.
Soils from GCREC were 5 to 10 times greater in Mg than those from WREC, which is likely due to the longstanding use of dolomitic lime at GCREC and calcitic lime at WREC. As a result of these differences, the relationships between M1 and other methods differed by location (P = 0.018), and regression lines were fitted separately (Fig. 6). In general, correlations for soil Mg were the best between M1 and M3 (r2 = 0.72 and 0.52) and were the worst between M1 and SN (r2 = 0.40 and 0.19). Slopes of regression lines in soils from GCREC were greater than from WREC, indicating M1 extracted more Mg from soils from GCREC than the other three tests (Fig. 7). Possible explanation for this result is that soils at GCREC are frequently limed with Mg-containing dolomitic lime (Malcomb Pegues, pers. commun.), which contains > 6.5 g Mg/kg, and thus have an overall higher Mg content. Solubility product constant (Ksp) for pure MgCO3 in water at 25 C is 10-7.8, indicating maximum concentration of Mg in pure water is ∼3 mg/L. In this study, extractable Mg by SN is > 10 mg/L. Due to frequent application, the concentration of dissolved Mg has exceeded its maximum, resulting in reduced dissolution of dolomitic lime.
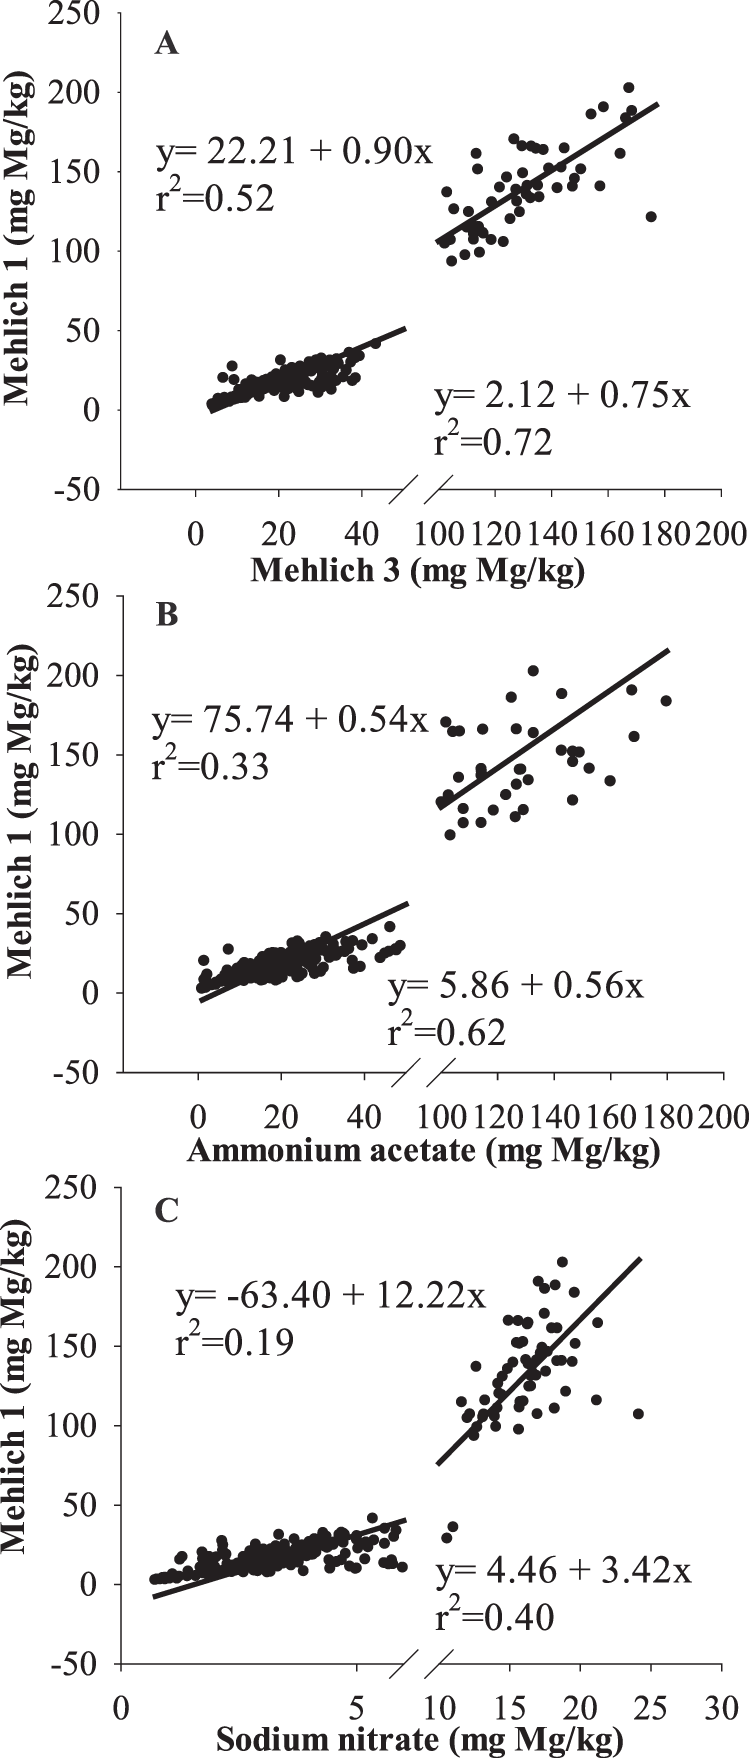
Relationships between soil Mg extractable by Mehlich 1 (M1) and (A) Mehlich 3 (M3), (B) 1 N neutral ammonium acetate (AA), and (C) 0.01 M sodium nitrate (SN) methods.
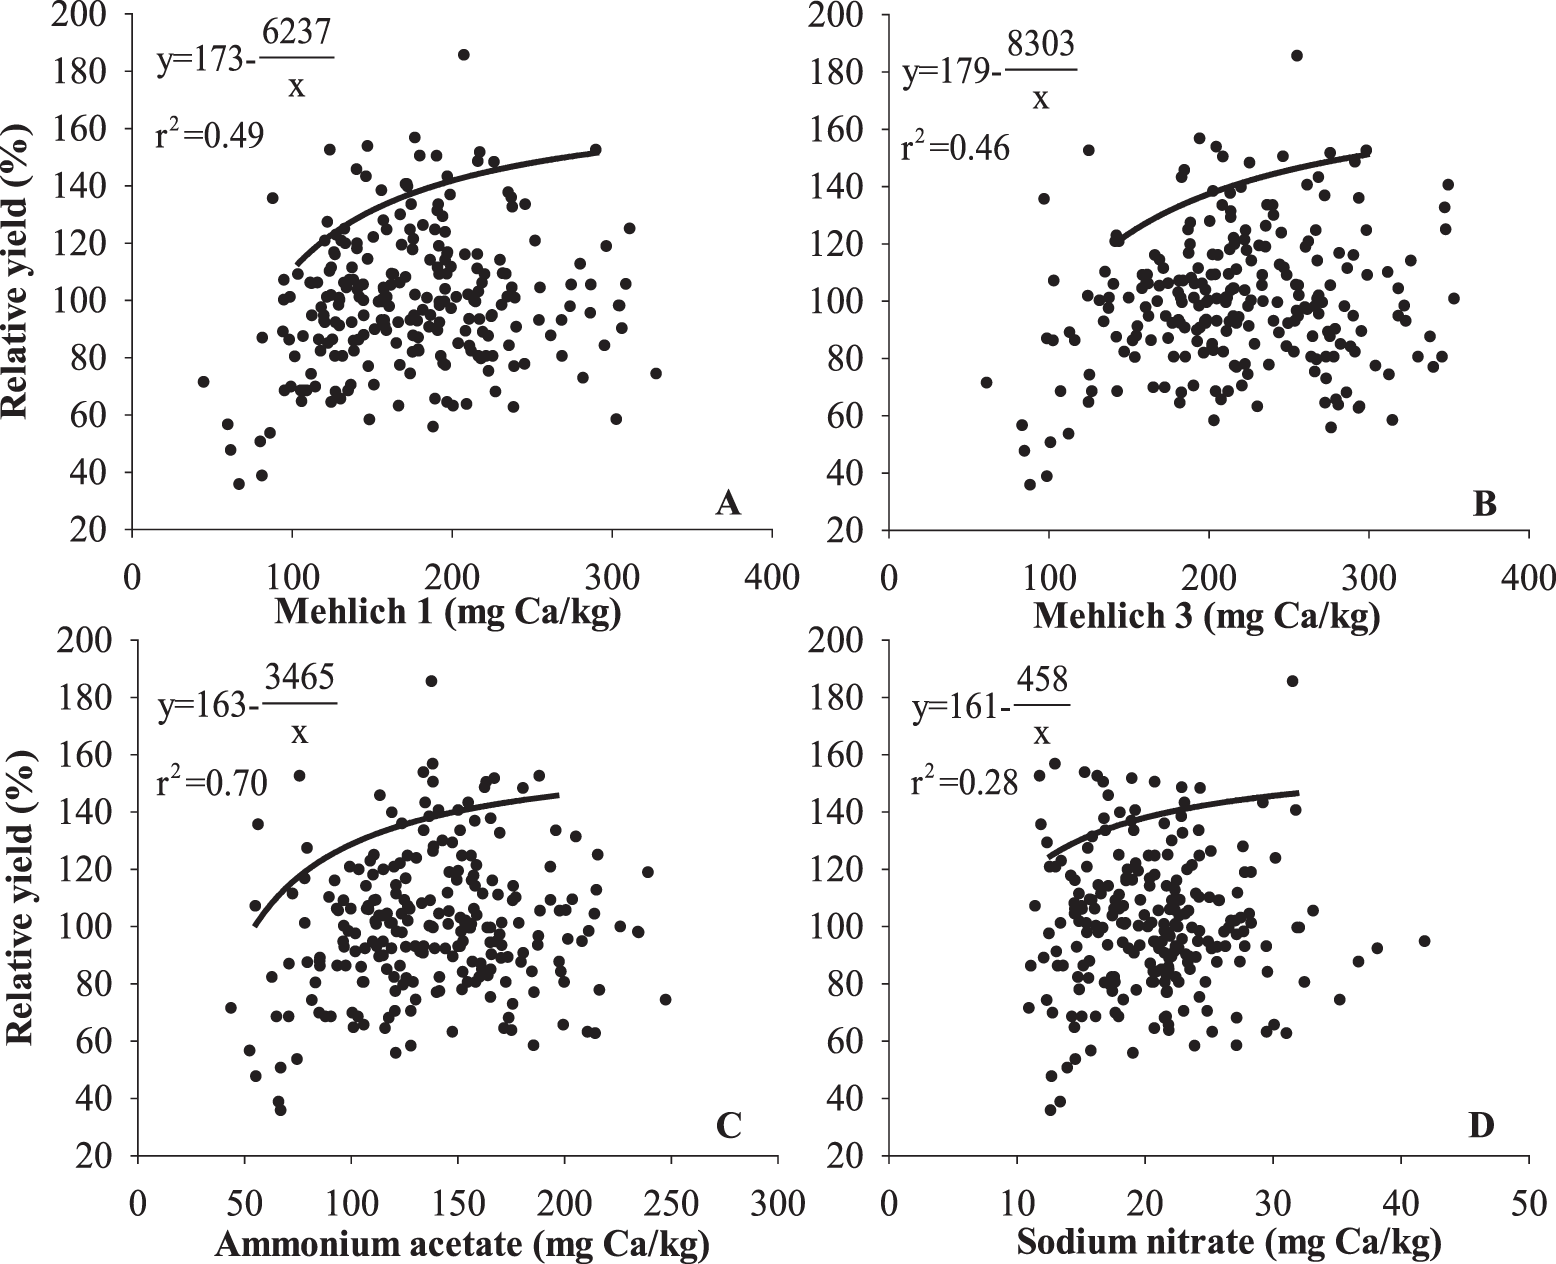
Correlations using the boundary line method among peanut relative yield and soil extractable Ca by (A) Mehlich 1 (M1), (B) Mehlich 3 (M3), (C) 1 N neutral ammonium acetate (AA), and (D) 0.01 M sodium nitrate (SN) generated by boundary line method.
Relationships between soil Ca and peanut yield, grade, and seed Ca
Relationships between soil test Ca and relative yield and grade of peanut in the current study were weak. For relative yield of peanut, r2 using the boundary line method was 0.49, 0.46, 0.70, and 0.28 for M1, M3, AA, and SN, respectively (Fig. 7). Peanut grade also did not have a strong relationship with soil test Ca. The r2 was 0.55, 0.39, 0.59, and 0.44 for M1, M3, AA, and SN, respectively (Fig. 8). Results indicate that the AA test was the best predictor of peanut yield and grade and that M1 was the next best predictor. The SN test was not a particularly good indicator of either yield or grade. Alva et al. (1989) reached the same conclusion; however, Smal et al. (1989) reported a better relationship between SN and peanut yield and grade than M1.
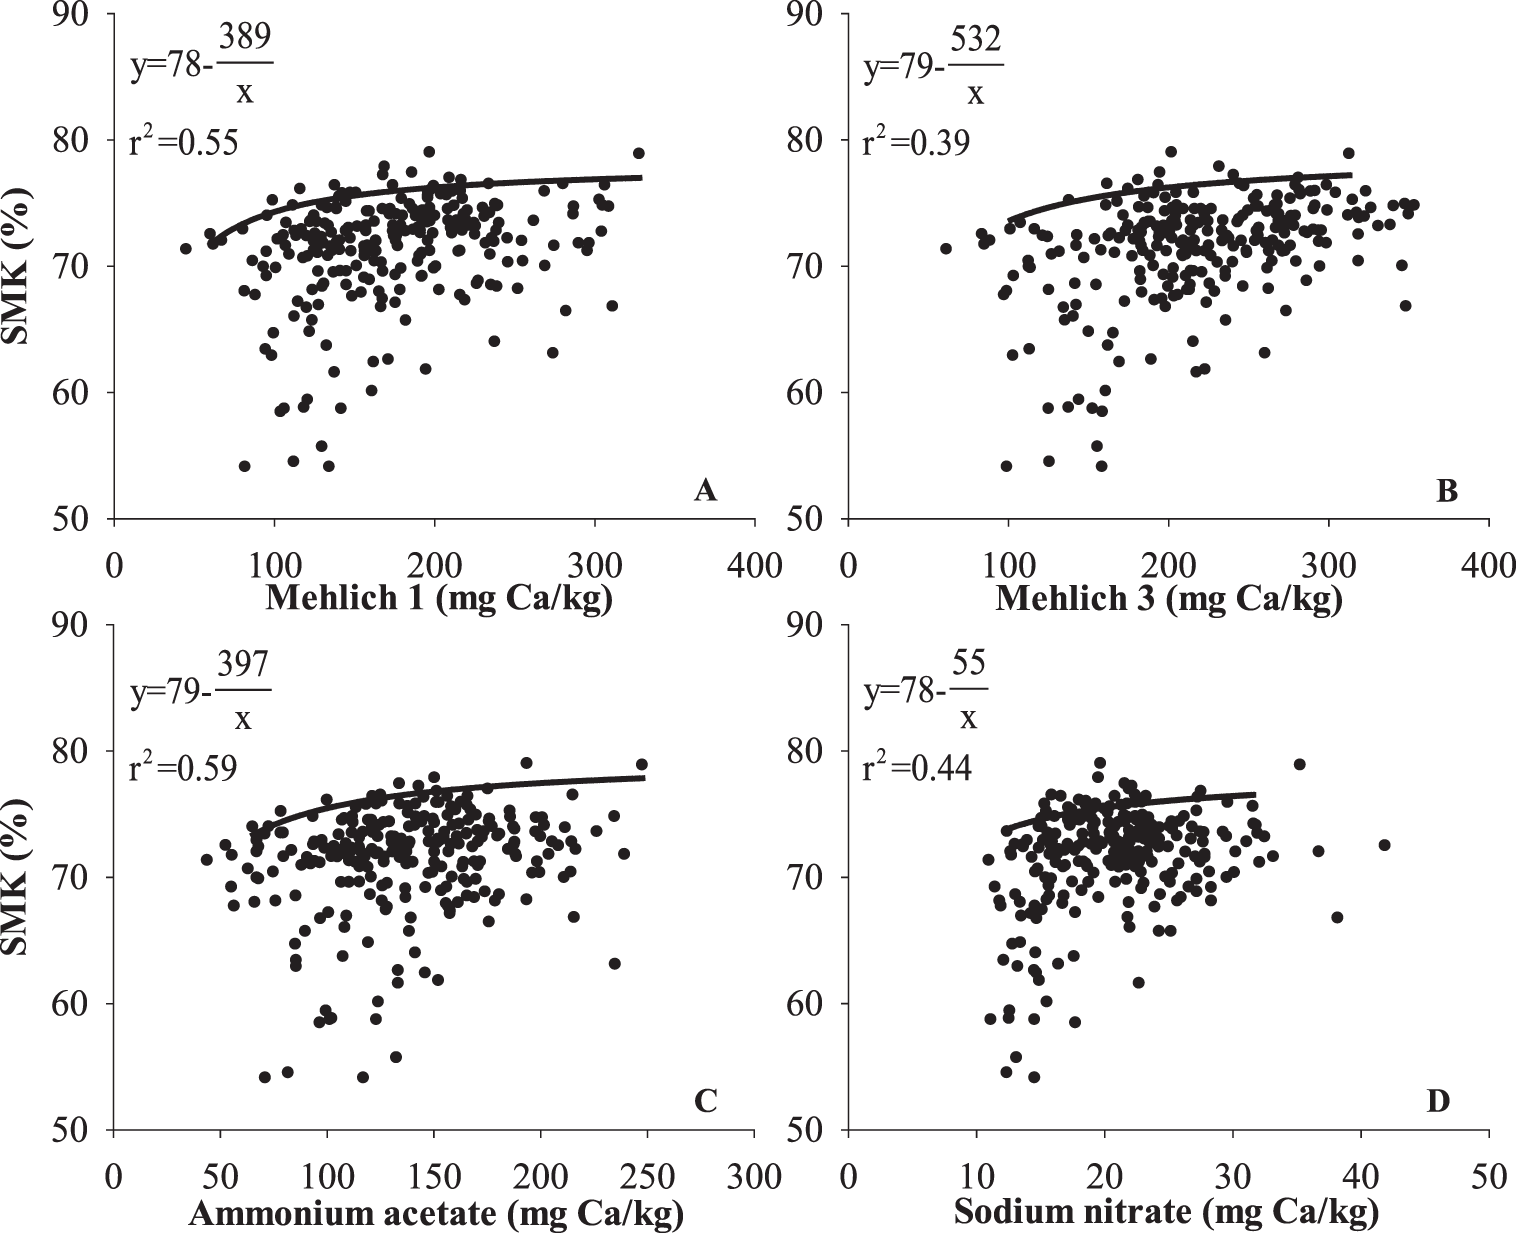
Correlations using the boundary line method among peanut grade represented as percentage of sound mature kernels (SMK) and soil extractable Ca by (A) Mehlich 1 (M1), (B) Mehlich 3 (M3), (C) 1N neutral ammonium acetate (AA), and (D) 0.01 M sodium nitrate (SN) generated by boundary line method.
Several factors could account for the poor relationships between soil tests and peanut yield and grade observed in the current study as well as previous studies. In the current study, the background Ca level was ≥ the established critical value (150 mg/kg) for peanut production in Alabama. Therefore, Ca may not be a limiting factor for peanut production in those soils, and a yield or grade response to increased soil Ca may not occur. Also, there could be an effect of peanut cultivar. Each of these evaluations was performed with different peanut cultivars that may have different Ca uptake patterns or requirements.
Strong correlations (r2 > 0.6) were found between seed Ca concentration and soil Ca using the boundary line method with the four different soil tests (Fig. 9). The AA test had the best correlation with seed Ca (r2 = 0.81, Fig. 9C). Seed Ca concentration increased with increasing soil Ca extracted by M1, M3, and AA from 150 to 300 mg/kg, suggesting that seed Ca concentration can further increase to a level above that which is required for optimum yield and grade. This positive relationship between soil Ca and seed Ca has been previously reported. Adams et al. (1993) reported correlation coefficients between soil Ca and seed Ca of 0.49, 0.51, 0.52, and 0.54 for four different runner-type peanuts, including GK7, Florunner, Southern Runner, and Sunrunner, respectively. A lower correlation coefficient of 0.40 was observed by Adams and Hartzog (1991), but authors argued that this correlation may be weakened by various moisture regimes of the peanuts used in the study. Since higher seed Ca corresponds to improved germination, growers producing peanuts for seed are advised by Auburn University (Hodges et al., 1994) in Alabama and The University of Georgia (Kissel and Sonon, 2008) in Georgia to apply gypsum at bloom, even if soil Ca levels are above the critical value for optimum peanut yield. When determining the efficacy of different Ca sources and timing of their application to supply Ca for peanut, seed Ca concentration may be a better indicator than yield and grade, due to its sensitivity to varied soil Ca conditions.
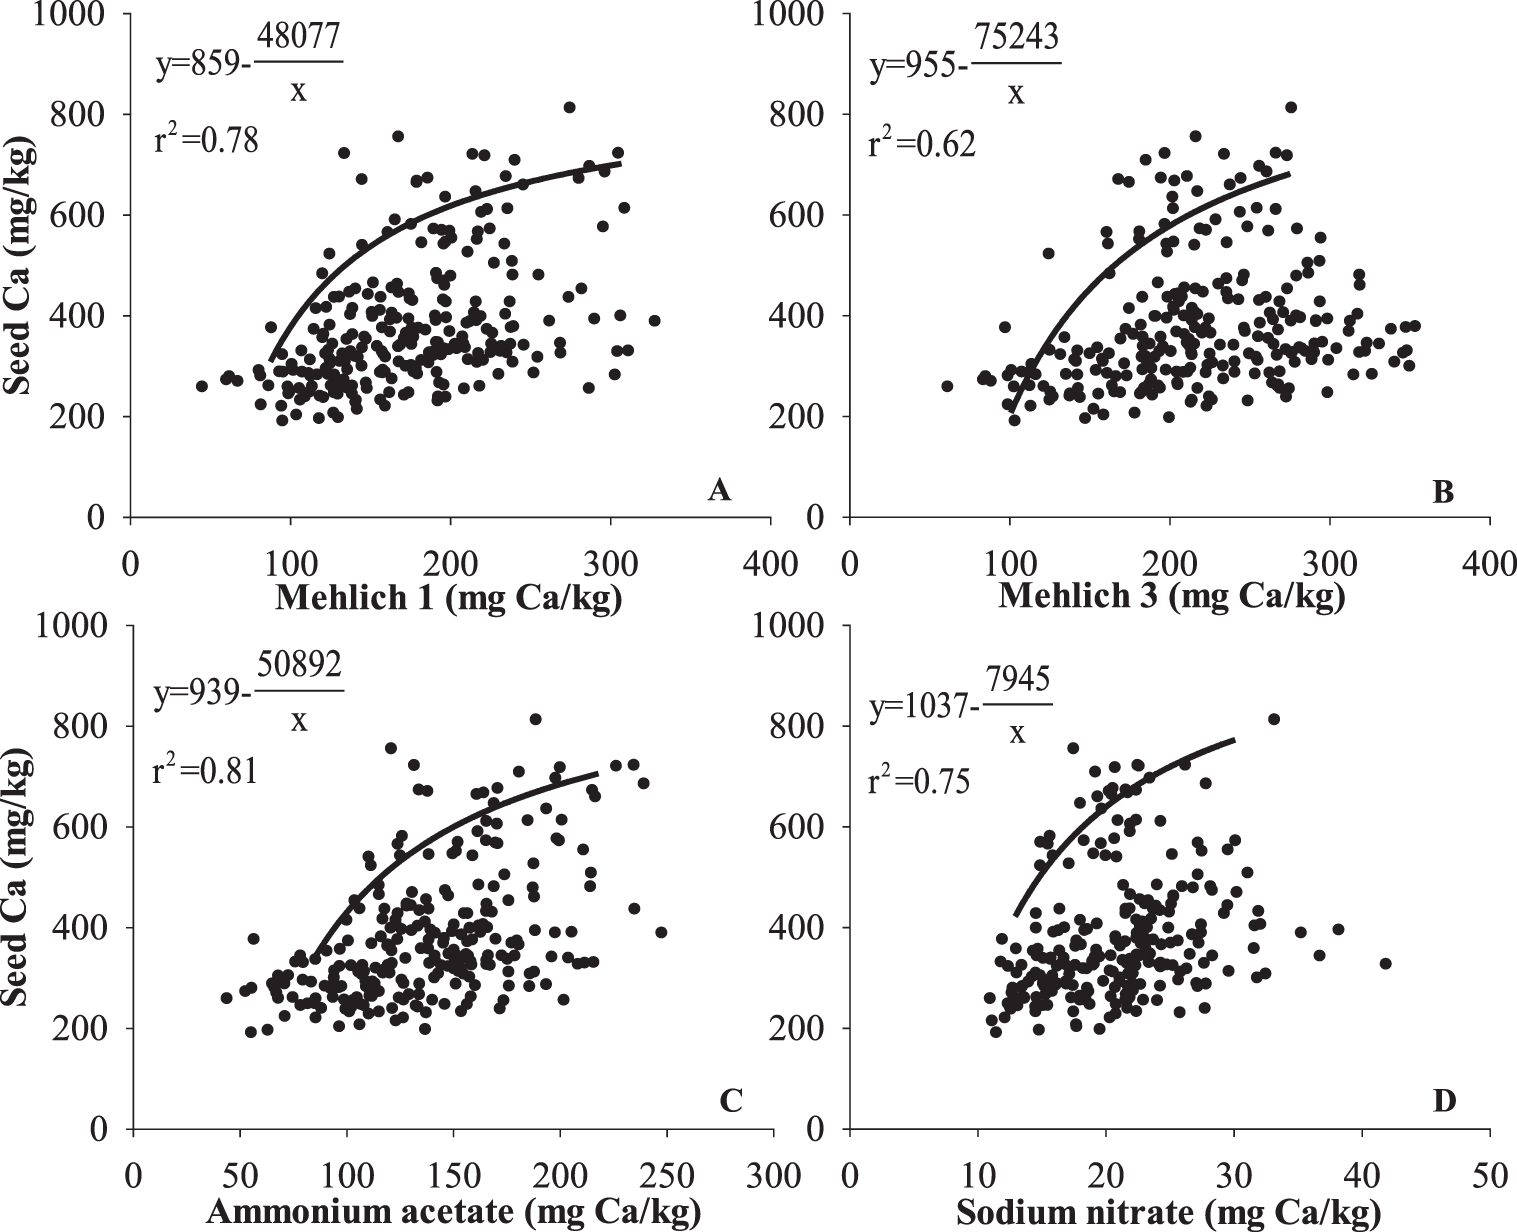
Correlations using the boundary line method among peanut seed Ca concentration and soil extractable Ca by (A) Mehlich 1 (M1), (B) Mehlich 3 (M3), (C) 1 N neutral ammonium acetate (AA), and (C) 0.01 M sodium nitrate (SN) generated by boundary line method.
Summary and Conclusions
Addition of gypsum shortly (e.g., within 30 d) before soil sampling had minimal effect on correlations among soil test Ca. In addition, strong correlations for soil Ca exist with M1, M3, AA, and SN in gypsum-treated soils; therefore, M1 is a satisfactory index of soil available Ca for peanut if soil is unamended or gypsum is used for Ca supplementation.
The relationships are also strong among M1 and other methods for lime-treated soils. The slope changes because the M1 test extracts more Ca from recently applied lime than other tests. It is likely that the M1 test overestimates soil Ca in lime-treated soils, if undissolved lime is present in the soil sample. In such cases, reduced peanut yield and substandard grade may occur due to inadequate Ca, even though M1 extractable Ca is above the critical level for Ca supplementation. Therefore, it is important to know whether a soil has been recently limed prior to converting one soil test value to another. If soil is recently (e.g., within 6 mo) limed, care should be taken when evaluating soil Ca extracted by M1. An alternative way is to use any of the other three soil tests for soil Ca and convert to M1-Ca to get recommendations for Ca supplementation.
The soil Ca extracted by AA showed the best correlation with peanut yield, grade, and seed Ca concentration among the four evaluated tests. The M1 test is the second best, and the SN test was the worst. In practice, M1 test should continue serving as routine soil test in order to improve the efficiency of soil testing, since M1 extracts nutrients other than Ca (e.g., P, Mg, and K) at the same time.
Acknowledgements
Thanks to continuous support of National Peanut Foundation and Alabama Peanut Producers Association.
Literature Cited
A.K Alva, (1993). Comparison of Mehlich 3, Mehlich 1, Ammonium bicarbonate-DTPA, 1.0 M ammonium acetate, and 0.2 M ammonium chloride for extraction of calcium, magnesium, phosphorus, and potassium for a wide range of soils. Commun. Soil Sci. Plant Anal 24: 603- 612.
A.K., Alva, and G.J Gascho (1991). Differential leaching of cations and sulfate in gypsum amended soils. Commun. Soil Sci. Plant Anal 22: 1195- 1206.
Alva, A.K., G.J Gascho, and W.A Cromer 1990 a Irrigation frequency effects on leaching of cations from gypsum amended Coastal Plain surface soils Water Air Soil Poll 52: 325- 336.
A.K., Alva, G.J Gascho, and Y Guang (1989). Gypsum material effects on peanut and soil calcium. Commun. Soil Sci. Plant Anal 20: 1727- 1744.
Alva, A.K., G.J Gascho, and Y Guang 1990 b Evaluation of three calcium extractants for coastal plain soils Commun. Soil Sci. Plant Anal 21: 29- 47.
D.B., Beegle, and T.C Oravec (1990). Comparison of Mehlich 3 P and K with Bray-Kurtz P and ammonium acetate K for corn. Commun. Soil Sci. Plant Anal 21: 1025- 1036.
N.C Brady, (1947). The effect of period of calcium supply and mobility of calcium in the plant on peanut fruit filling. Soil Sci. Soc. Am. Proc 11: 336- 341.
C.E., Evans, and J.A McGuire (1990). Comparison of soil test extractants on Alabama soils. Commun. Soil Sci. Plant Anal 21: 1037- 1050.
Franklin, R., and L.D Simmons 2005 Correlations of Mehlich 1 and 3 extractable plant nutrients in South Carolina soils. SB 677 Clemson University, Clemson, SC.
K.L., Gartley, J.T Sims, C.T Olsen, and P Chu (2002). Comparison of soil test extractants used in mid-Atlantic U.S. Commun. Soil Sci. Plant Anal 33: 873- 895.
G.J., Gascho, T.P Gaines, and C.O Plank (1990). Comparison of extractants for testing coastal plains soils. Commun. Soil Sci. Plant Anal 21: 1051- 1077.
Hallock, D.L., and A.H Allison 1980 b Effect of three ca sources applied on peanuts II: soil Ca, K, Mg levels Peanut Sci 7: 26- 31.
Hartzog, D., and F Adams 1973 Fertilizer, gypsum, and lime experiments with peanuts in Alabama, 1967-1972 Bull. Ala. Agric. Exp. Stn. Auburn University, Auburn, AL.
Hodges, S.C., G.J Gascho, and G Kidder 1994 Chapter 6: Calcium and Magnesium In: C.C Mitchell (ed) Research-based soil testing interpretation and fertilizer recommendation for peanuts on Coastal Plain soils. Southern Cooperative series bulletin No. 380. Auburn University, AL.
T.C., Keisling, and M.E Walker (1978). Calcium-supplying characteristics of two gypsum materials on southeastern coastal plains soils. Soil Sci. Soc. Am. J 42: 513- 517.
Kissel, D.E., and L Sonon 2008 Soil Test Handbook for Georgia. Spec. Bull.62 Georgia Coop. Ext., College of Agric. and Environ. Sci., Univ. of Georgia, Athens, GA.
Littell, R.C., G.A Milliken, W.W Stroup, R.D Wolfinger, and O Schabenberger 2006 SAS for mixed models (2nd edition) SAS Institute Inc., Cary, NC.
Mehlich, A 1953 Determination of P, Ca, Mg, K, Na, and NH4 North Carolina Soil Test Division, Mimeo, NC.
A Mehlich, (1984). Mehlich 3 soil test extractant: a modification of Mehlich 2 extractant. Commun. Soil Sci. Plant Anal 15: 1409- 1416.
G.J., Michaelson, C.L Ping, and G.A Mitchell (1987). Correlation of Mehlich 3, Bray 1 and Ammonium Acetate extractable P, K, Ca and Mg for Alaskan agricultural soils. Commun. Soil Sci. Plant Anal 18: 1003- 1015.
S Mizuno, (1959). Physiological studies on the fruitification of peanut. I. Distribution of radioactive calcium administered to the fruiting zone on the fruiting organ. Proc. Crop Sci. Soc. Japan 28: 83- 35.
R.S., Mylavarapu, J.F Sanchez, J.H Nguyen, and J.M Bartos (2002). Evaluation of Mehlich-1 and Mehlich-3 extraction procedures for plant nutrients in acid mineral soils of Florida. Commun. Soil Sci. Plant Anal 33: 807- 820.
C.J., Schollenberger, and R.H Simons (1945). Determination of exchange capacity and exchangeable bases in soils. Soil Sci 50: 13- 24.
T.M., Shatar, and A.B McBratney (2004). Boundary-line analysis of field-scale yield response to soil properties. J. Agr. Sci 142: 553- 560.
J.T Sims, (1989). Comparison of Mehlich 1 and Mehlich 3 extractants for P, K, Ca, Mg, Mn, Cu, and Zn in Atlantic Coastal Plain soils. Commun. Soil Sci. Plant Anal 20: 1707- 1726.
H., Smal, C.S Kvien, M.E Sumner, and A.S Csinos (1989). Solution calcium concentration and application date effects on pod calcium uptake and distribution in Florunner and Ttifton-8 peanut. J. of Plant Nutr 12: 37- 52.
G.A., Sullivan, G.L Jones, and R.P Moore (1974). Effects of dolomitic limestone, gypsum, and potassium, on yield and seed quality of peanuts. Peanut Sci 1: 73- 77.
USEPA 1994 Method 3051: Microwave assisted acid digestion of sediments, sludges, soils, and oils. US Environmental Protection Agency Washington D.C., USA.
J.J., Wang, D.L Harrell, R.E Henderson, and P.F Bell (2004). Comparison of soil-test extractants for phosphorus, potassium, calcium, magnesium, sodium, zinc, copper, manganese, and iron in Louisiana soils. Commun. Soil Sci. Plant Anal 35: 145- 160.
R.A Webb, (1972). Use of boundary line in the analysis of biological data. J. Hort. Sci 47: 309- 319.
J.D., Wolt, and F Adams (1979). Critical levels of soil- and nutrient-solution calcium for vegetative growth and fruit development in Florunner peanuts. Soil Sci. Soc. Am. J 43: 1159- 1164.
Notes
- Graduate Research Assistant, Dept. Crop, Soil and Environmental Sciences, Auburn University, Auburn, AL 36849 [^]
- Associate Professor, Dept. of Soil and Crop Sciences, Texas A University, College Station, TX 77843 [^]
- Extension Specialist, Dept. Crop, Soil and Environmental Sciences, Auburn Unviersity, Wiregrass Research and Extension Center, Headland, AL 36345 [^] *Correspondence author's E-mail: j-howe@tamu.edu
Author Affiliations