

Introduction
Peanut or groundnut ( Arachis hypogaea L.) is cultivated worldwide as both an oilseed and food crop with a total annual production of 40.4 million tons of seed in shell (FAO, 2012). Peanut seeds contain approximately 50% oil, 25% protein, 15% carbohydrates, 2% fiber, and 2% ash. Besides producing oil, peanut seeds are also an important protein source for human consumption, especially in developing countries where animal protein sources are limited. In addition, peanut seeds contain useful phytochemicals (such as flavonoids, tocopherols, folate, and resveratrol) and minerals, which play important roles in human health (Cobb and Johnson, 1973; Branch and Gaines, 1983; Dwivedi et al., 1990; Sobolev and Cole, 1999; Dean et al., 2009; Shin et al., 2009; Wang et al., 2013). Macronutrient and micronutrient deficiencies are major public health concerns in developing countries, especially for infants and pregnant women (Batra and Seth, 2002). Breeding for enhanced protein and mineral concentrations in peanut seeds could provide improved varieties to help alleviate nutrient deficiencies in humans. Determination of protein and mineral variability in peanut germplasm collections would benefit the breeding efforts on developing new cultivars. The concentrations of seed minerals (including 11 mineral elements) have been previously evaluated among 26 peanut germplasm accessions, and significant variability has been identified (Branch and Gaines, 1983). However, no information is available for seed mineral concentrations in the U.S. peanut mini-core collection.
The U.S. peanut mini-core, consisting of 112 accessions, was established in 2005 representing ∼1% of the entire peanut germplasm collection (Holbrook and Dong, 2005). Since its establishment, this mini-core collection has become an important genetic resource for breeders to use for improving seed quality and other traits in breeding programs. Genetic diversity and population structure have been assessed in this mini-core collection (Barkley et al., 2007; Wang et al., 2011). Evaluating the seed composition variability will help breeders choose suitable accessions to use in their breeding programs. Some seed quality traits (including oil percentage, fatty acid composition, amino acid composition, as well as flavonoid, tocopherol, and folic acid concentrations) of the mini-core collection have been collected by different laboratories (Dean et al., 2009;Wang et al., 2013). These evaluations on seed quality traits are still incomplete due to the lack of information on protein percentage and mineral concentrations. Recently, the ICRISAT peanut mini-core collection was evaluated for the variability and stability of iron and zinc concentration in the seed (Upadhyaya et al., 2012). To expand this information, protein percentage and mineral concentrations were determined from seeds harvested from the U.S. peanut mini-core collection for 2 yr at a single location. The objectives of this study were to (i) determine the variability in seed protein percentage and mineral concentrations among accessions within the mini-core collection, (ii) determine the correlations among 28 seed chemical composition traits, and (iii) identify accessions with high concentrations of protein and/or certain important mineral elements for germplasm enhancement and product development.
Materials and Methods
Peanut Accession Samples
The same batch of harvested seeds used for chemical composition analysis in a previous study (Wang et al., 2013) was employed for the present study. However, only 95 of the 102 original accessions had enough seeds for the protein percentage and mineral concentration analyses. The plant introduction (PI) number, botanical variety type, and country of origin and collection site of these 95 accessions are listed in Table S1 in the Supporting Information. Twenty seeds from each accession were planted in two-row 10-feet long plots in Dawson, GA during 2008 and 2009. Before planting peanut, the land (Dothan sandy loam soil) was used to plant corn-cotton-peanut for crop rotation. The same amount (500 pound/acre) of gypsum fertilizer was applied for both years when peanuts were cultivated. The harvesting information was previously described (Wang et al., 2013).
Protein Percentage by Nitrogen Analysis
Medium-size peanut seeds (about 5 seeds) were crushed in a small plastic bag with a hammer. After crushing, a small amount of crushed seed powder (∼200 mg) was wrapped in tin foil (50 × 50 mm, Art-No. 12.01-0033, Elementar). The wrapped seed powder was transferred into a small column and then pressed into a small pellet (10 mm diameter x 5 mm high). The seed protein percentage was measured using a Rapid N Cube nitrogen analyzer (Elementar, Hanau, Germany/New Jersey, USA). Protein percentage for each accession was measured in duplicate. Sample pellets were combusted at ∼950 C in a CO2 carrier gas with an O2 injection, resulting in a mixture of oxidized products and ash. Water, SO2, and HX were removed by various absorbers while nitrogen oxides were reduced to molecular nitrogen and detected by a thermal conductivity detector (TCD) (Winkler, 2008). Total nitrogen content was expressed as a percentage of the sample mass, and a protein factor of 5.46 was used to estimate crude protein percentage in peanut seeds (Jones, 1931).
Mineral Concentration by ICP-OES Analysis
Approximately 30 seeds from each accession were dried and ground to a fine powder using a stainless steel coffee grinder. A minimum of two sub-samples (∼0.25 g DW) from each ground and dried sample were digested and processed for elemental analysis as previously described (Pathak et al., 2013). Replicated sub-sample values were used to obtain average mineral concentrations for each accession in each harvest year.
Statistical Analysis
A Pearson's coefficient analysis was performed to determine significant correlations among different seed chemical composition traits. An analysis of variance was performed on the data, and means were separated using Tukey's multiple comparison procedure (SAS, 2008, Online Doc® 9.2. Cary, NC: SAS Institute Inc).
Results
Variability in Protein Percentages and Mineral Concentrations among Accessions
Significant variability was identified for the seed chemical composition traits (protein percentages and mineral concentrations) among accessions within the U.S. peanut mini-core collection (Table 1). There was significant variation in seed protein percentages among accessions, with values ranging from 20.6 to 30.4% and an average of 26.2%. In this study, there were five plant macronutrient minerals investigated, including calcium (Ca), potassium (K), magnesium (Mg), phosphorus (P), and sulfur (S). Their average concentrations in peanut seeds were 0.58, 8.21, 2.05, 4.74, and 2.48 mg/g DW, respectively. Their variability among accessions was less than two-fold, except for calcium (0.25 – 0.93 mg/g DW; 3.7-fold) (Table 1). There were eight plant micronutrient minerals investigated, including boron (B), copper (Cu), iron (Fe), manganese (Mn), molybdenum (Mo), sodium (Na), nickel (Ni), and zinc (Zn). Their average concentrations in peanut seeds were 27.34, 8.88, 25.19, 21.84, 0.92, 8.69, 0.36, and 43.00 μg/g DW, respectively. Their variability among accessions ranged from two-fold (Cu and Fe) to almost seven-fold (Na). Peanut seeds generally contained more B, Fe, Mn, and Zn than Cu, Mo, Na, and Ni. There is greater potential to enhance micronutrient minerals (such as Fe and Zn) than macronutrient minerals due to the range of their variability among accessions. For example, PI 403831 contained two times more zinc than PI 496401 (58.26 μg/g DW vs. 26.02 μg/g DW). The accession, PI 268755 contained two times more iron than PI 157542 (33.5 μg/g DW vs.16.71 μg/g DW). The accessions, PI 403831 and PI 268755 can potentially be used as parents in peanut breeding programs for enhancing zinc and iron concentrations, respectively. The values for all investigated traits of each accession are listed in Table S2 in the Supporting Information, and accessions can be compared by using minimum significant differences (MSD) presented in Table 1.

Variability of protein percentages and mineral concentrations within the U.S. peanut mini-core collectiona.
Variability in Protein Percentages and Mineral Concentrations across Years
The variation for all 14 investigated traits revealed significant year effects and year x genotype interactions except for the seed nickel concentration. The contribution to variation (Type I SS) from year x genotype interaction was greater than the year effect for protein, Ca, Fe, K, Mg, Mn, Mo, Ni, and S concentrations. But the contribution to variation from year effects was greater than year x genotype interactions for B, Cu, Na, and Zn concentrations (Table S3 in Supporting Information). Therefore, Cu, Na, and Zn concentrations in peanut seeds can vary significantly from year to year. In comparison of two years' results (Table 2), the protein percentage was on average significantly higher in seeds from year 1 (26.79%) than seeds from year 2 (25.69%). From a previous study (Wang et al., 2013), 100-seed weight was also significantly higher from the year 1 (53.8 g) than from the year 2 (48.1g) samples. Zinc, Cu, and Na concentrations were significantly higher in seeds from year 1 (means 47.09, 10.51, and 12.75 μg/g DW, respectively) than in seeds from year 2 (mean 38.92, 7.25, and 4.63 μg/g DW, respectively). Overall, genotype was the major factor for determining the trait values except for Cu and Na concentrations (Table S3).
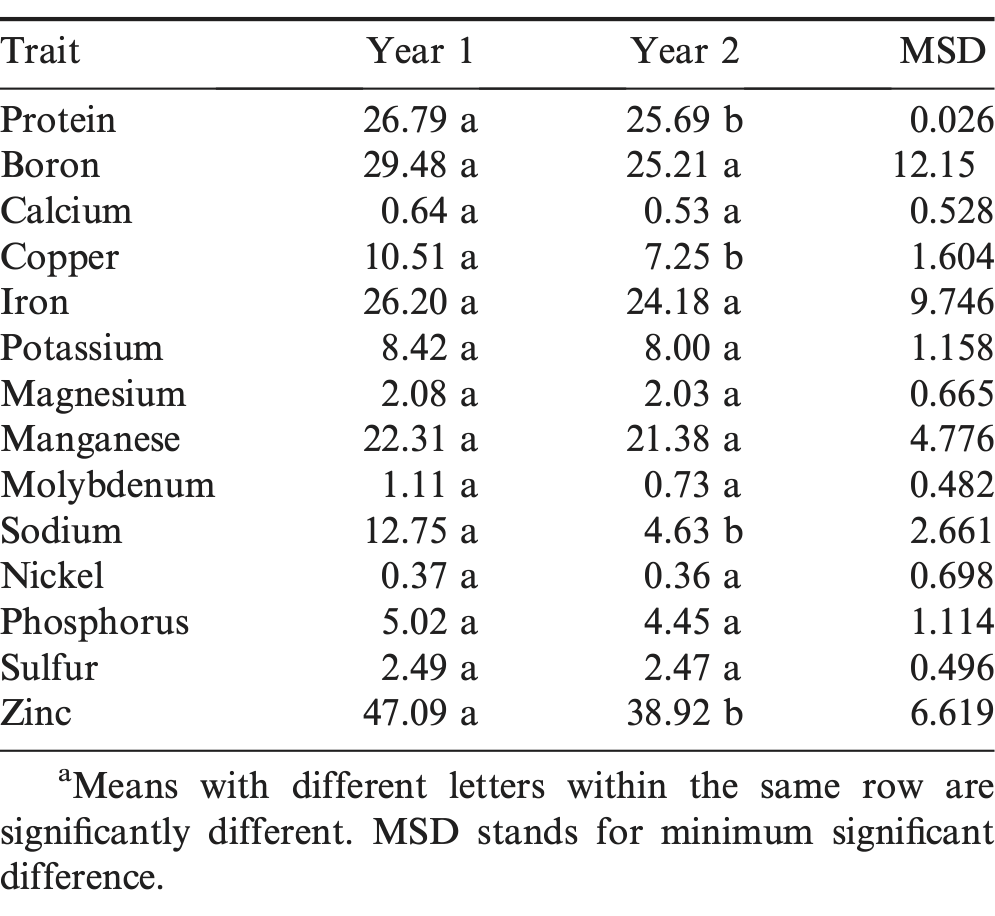
Comparison of protein percentage and mineral concentration values between Year 1 and Year 2a.
Variability in Protein Percentages and Mineral Concentrations among Botanical Varieties
The U.S. peanut mini-core collection includes four botanical varieties (var.): fastigiata var. fastigiata (ff), fastigiata var. peruviana (fp), fastigiata var. vulgaris (fv), and hypogaea var. hypogaea (hh) (Wang et al., 2013). Significant variability in all investigated traits except for Cu and Ni concentrations was detected among the botanical varieties, and the comparison results are listed in Table S4. The average protein percentage of fastigiata var. fastigiata (26.7%) peanut seeds, while statistically different (p < 0.05), was only slightly higher than that of fastigiata var. peruviana (25.4%), and was similar to that of fatigiata var. vulgaris (26.7%) and hypogaea var. hypogaea (25.9%). The variability in macronutrient minerals (K, P, S, Mg, and Ca) among botanical varieties is shown in Figure 1. The botanical variety fastigiata var. peruviana contained a significantly higher average concentration of K (8.66 mg/g DW) and a lower average concentration of Ca (0.34 mg/g DW) in seeds, than in fastigiata var. vulgaris (7.89 mg/g DW and 0.63 mg/g DW, respectively) and hypogaea var. hypogaea (8.14 mg/g DW and 0.62 mg/g DW, respectively). The botanical variety fastigiata var. peruviana also contained a significantly lower average concentration of P (4.32 mg/g DW) in seeds than fastigiata var. fastigiata (4.99 mg/g DW) and fastigiata var. vulgaris (4.67 mg/g DW). The variability in micronutrient minerals (Zn, B, Fe, Mn, Cu, Na, Mo, and Ni) among botanical varieties is shown in Figure 2. The botanical variety fastigiata var. peruviana contained significantly lower average concentrations of Zn, B, and Mn (41.99, 21.24, and 18.55 μg/g DW, respectively), but significantly higher average concentrations of Mo (1.64 μg/g DW) in seeds than the other three botanical varieties. On average, the botanical variety hypogaea var. hypogaea contained significantly lower concentrations of Zn and Fe (39.59 and 23.48 μg/g DW, respectively) in seeds, relative to the other three botanical varieties, while the botanical variety fastigiata var. fastigiata showed the highest average concentrations of both Zn and Fe (47.44 and 27.07 μg/g DW, respectively). Accessions within this botanical variety may be considered for improving Zn and Fe concentrations in peanut breeding programs.
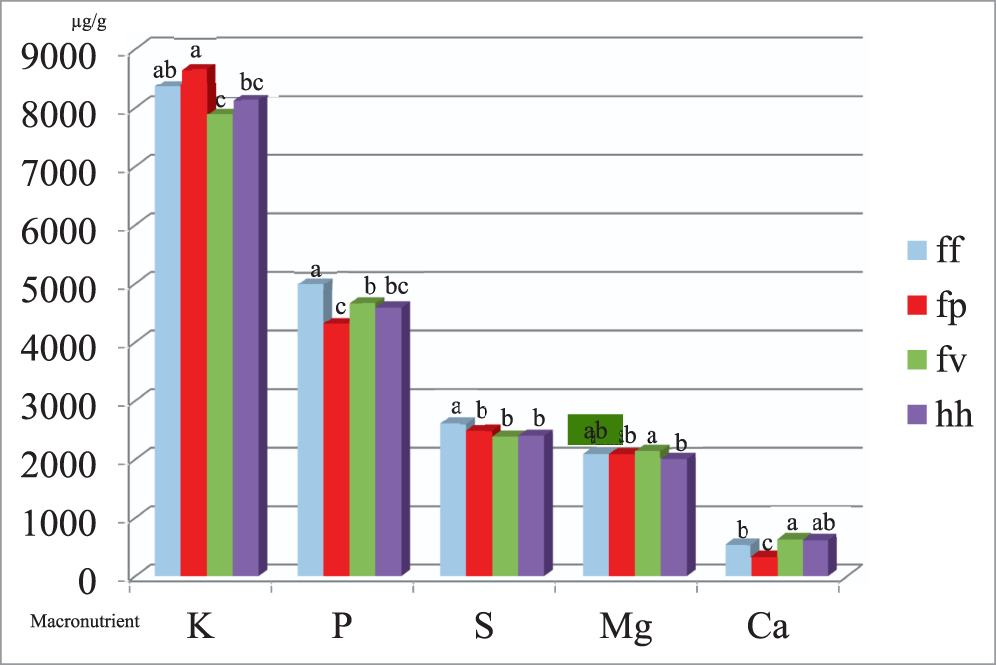
Variability in seed macronutrient element concentrations in μg/g DW among botanical varieties within the U.S. peanut mini-core collection.
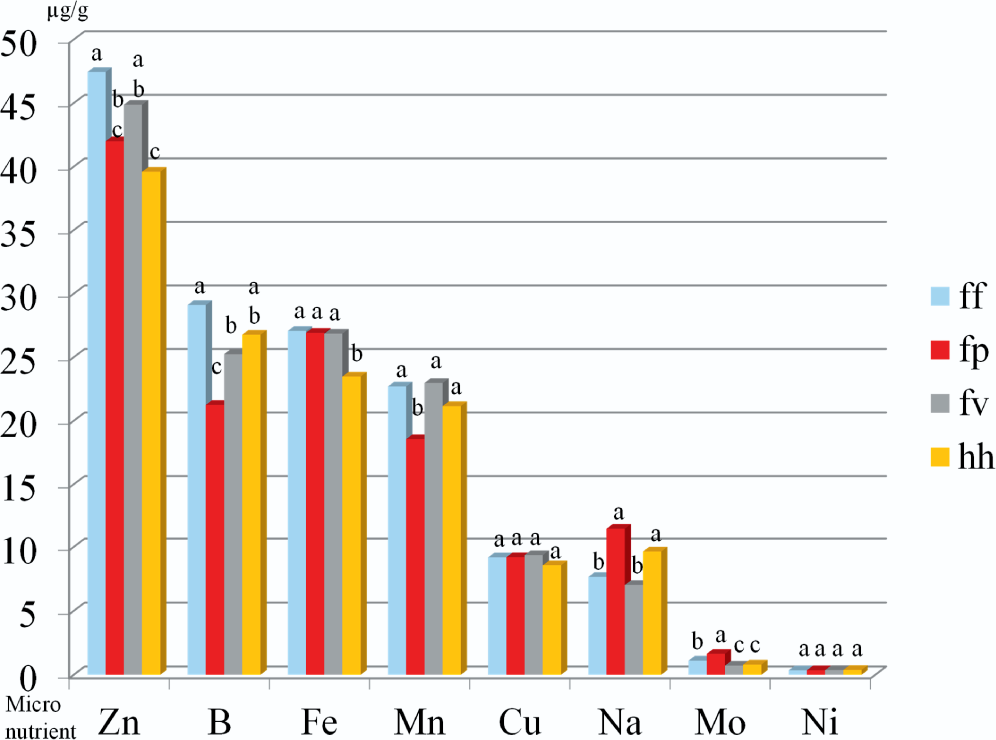
Variability in seed micronutrient element concentrations in μg/g DW among botanical varieties within the U.S. peanut mini-core collection.
Correlation Coefficients among Investigated Traits
Correlation coefficients were calculated from 28 traits (14 traits in this study plus 14 traits in a previous study of Wang et al., 2013), and the results are listed in separate tables based on the trait categories. The results from the correlation coefficients from protein and mineral concentrations with seed weight, oil percentage, and fatty acids are listed in Table 3. Protein percentage was positively correlated with Fe and Zn (two human essential minerals) concentrations (r = 0.44 and r = 0.52; P < 0.0001). These correlations may be desirable and useful for developing high protein cultivars in peanut confectionery breeding programs. The confectionery products with high protein, Fe, and Zn concentrations may be more nutritious. Seed weight, oil, and protein percentage are important seed quality traits; and these three traits may affect each other positively or inversely. In our study, protein percentage was negatively correlated with 100-seed weight and oil percentage (r = −0.25 and r = −0.23; P < 0.0001), but the correlation values were low. However, a highly significant negative correlation was also observed between protein and oil percentage in another study (Dwivedi et al., 1990). Interestingly, protein percentage was negatively correlated with oleic acid percentage (r = −0.46; P < 0.0001), but positively correlated with linoleic acid percentage (r = 0.46; P < 0.0001). From our previous study (Wang et al., 2013), we found oil percentage was positively correlated with oleic acid percentage (r = 0.40; P < 0.0001), but negatively correlated with linoleic acid percentage (r = −0.40; P < 0.0001); and oleic acid percentage was negatively correlated with linoleic acid percentage (r = −0.85; P < 0.0001). The results of correlations among these four chemical traits were confirmed and supported each other. An increase in seed oil generally results in an increase in the level of oleic acid, but a reduction in linoleic acid and protein percentage. Conversely, an increase in seed protein generally results in a reduction of oil and oleic acid percentage, but a higher level of linoleic acid. As far as the authors are aware, no reports of any correlations between minerals and fatty acids in peanuts are available in the literature. We found that the concentrations of Fe, Mg, Mn, and Zn were correlated negatively with oleic acid percentage (r = −0.61, −0.57, −0.60, and −0.45; P < 0.0001) and positively correlated with linoleic acid percentage (r = 0.59, 0.55, 0.58, and 0.46; P < 0.0001). In addition, Ca was positively correlated with oil percentage (r = 0.32; P < 0.0001), but not significantly with protein percentage (r = 0.13; P = 0.0132). These results were consistent with the conclusion from a previous study (Inanaga et al., 1998) indicating that Ca is associated with seed oil percentage but not protein percentage.
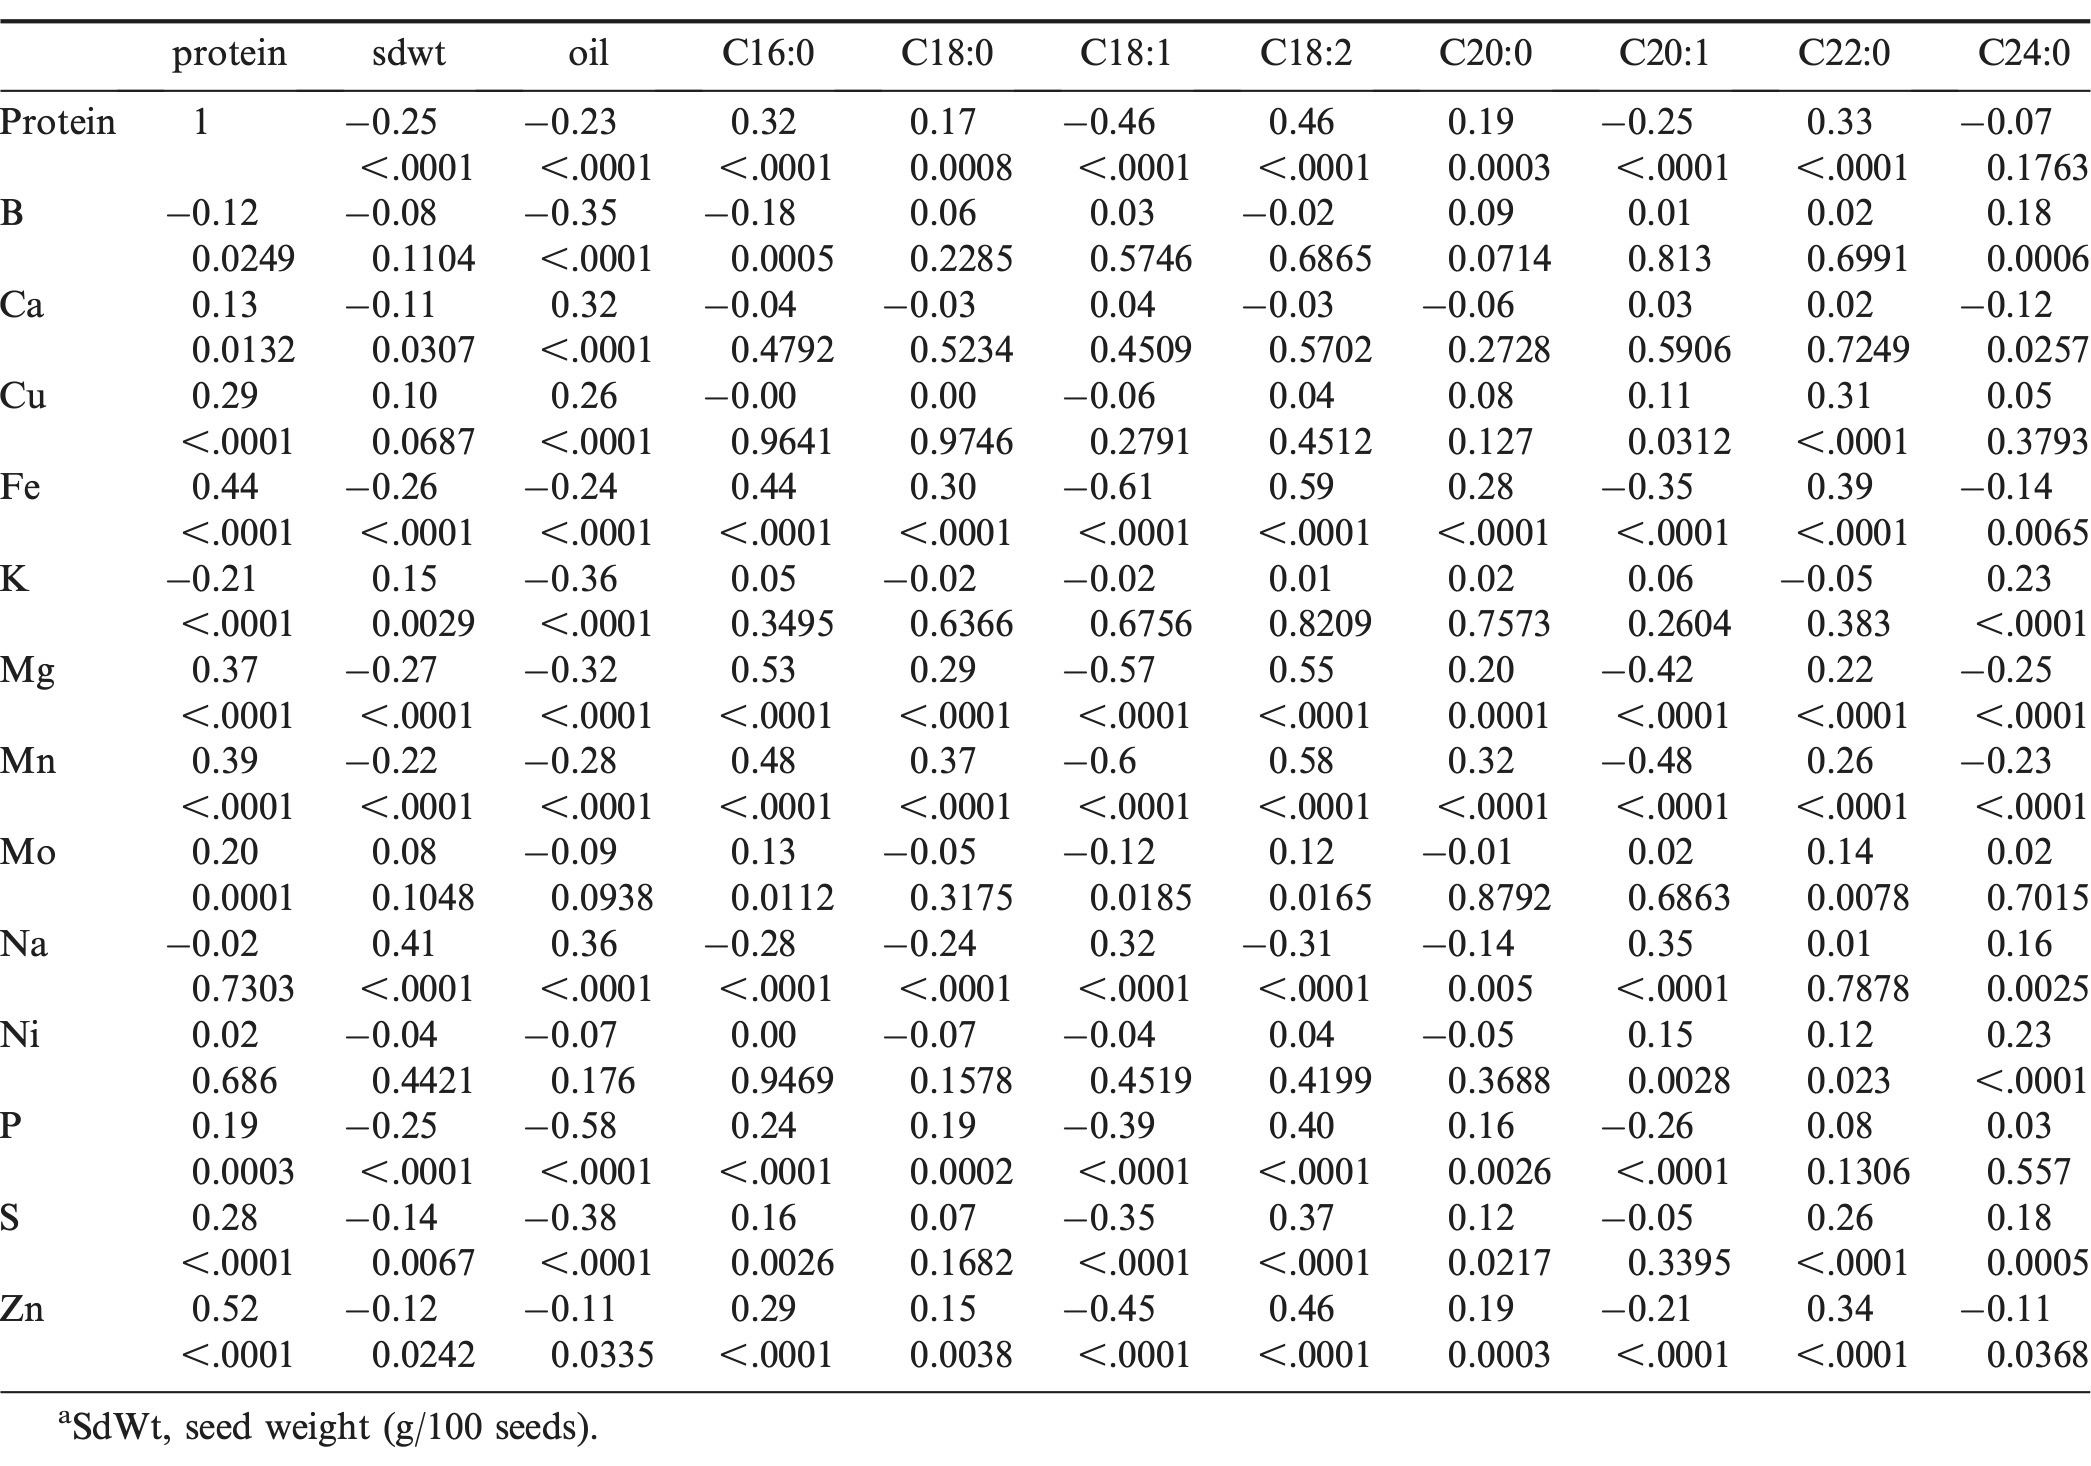
Pearson correlation coefficients and probability values for seed weight, oil, fatty acids, protein percentage and mineral concentration among accessions within the U.S. mini-core collectiona.
The protein and mineral concentration correlation coefficients with flavonoids and resveratrol concentrations are listed in Table S5. No highly significant correlations with high values were observed except with Zn concentration. Zinc concentration was significantly correlated with genistein concentration (r = 0.49; P < 0.0001).
The correlation coefficients between the various minerals were determined, and the results are listed in Table 4. Boron concentration was positively correlated with P concentration in peanut seeds (r = 0.50; P < 0.0001). Calcium concentration was negatively correlated with K concentration (r = −0.45; P < 0.0001). Copper concentration was positively correlated with concentrations of the micronutrient minerals Fe, Mo, Na, and Zn, respectively (r = 0.45, 0.40, 0.51, and 0.64; P < 0.0001). Iron concentration was positively correlated with the concentration of the macronutrient minerals Mg, P, and S (r = 0.59, 0.43, 0.52; P < 0.0001) and also with the concentration of the micronutrient minerals Mn and Zn (r = 0.47, 0.74; P < 0.0001). Similar correlations occurred between B and P (r = 0.33**), Ca and K (r = −0.78**), Cu and Zn (r = 0.32**), and Fe and Mg, P, S, Mn, Zn (r = 0.51**, 0.27*, 0.28*, 0.27*, and 0.42**) were also observed in a previous study (Branch and Gaines, 1983). In another study (Upadhyaya et al., 2012), a positive correlation between Fe and Zn concentration was also observed (r = 0.74; P < 0.0001). Magnesium concentration was positively correlated with Mn and P concentrations (r = 0.54, 0.57; P < 0.0001). Manganese concentration was positively correlated with P and Zn concentrations (r = 0.57, 0.39; P < 0.0001). Sodium concentration was negatively correlated with P concentration (r = −0.45; P < 0.0001). Phosphorus concentration was positively correlated with S concentration (r = 0.63; P < 0.0001). Sulfur concentration was positively correlated with Zn concentration (r = 0.53; P < 0.0001). The positive correlations of S concentration with P and Zn (r = 0.36**, 0.52**) were also observed in a previous study (Branch and Gaines, 1983). The information on correlations among minerals may be useful for improving the seed mineral composition in peanut breeding programs.
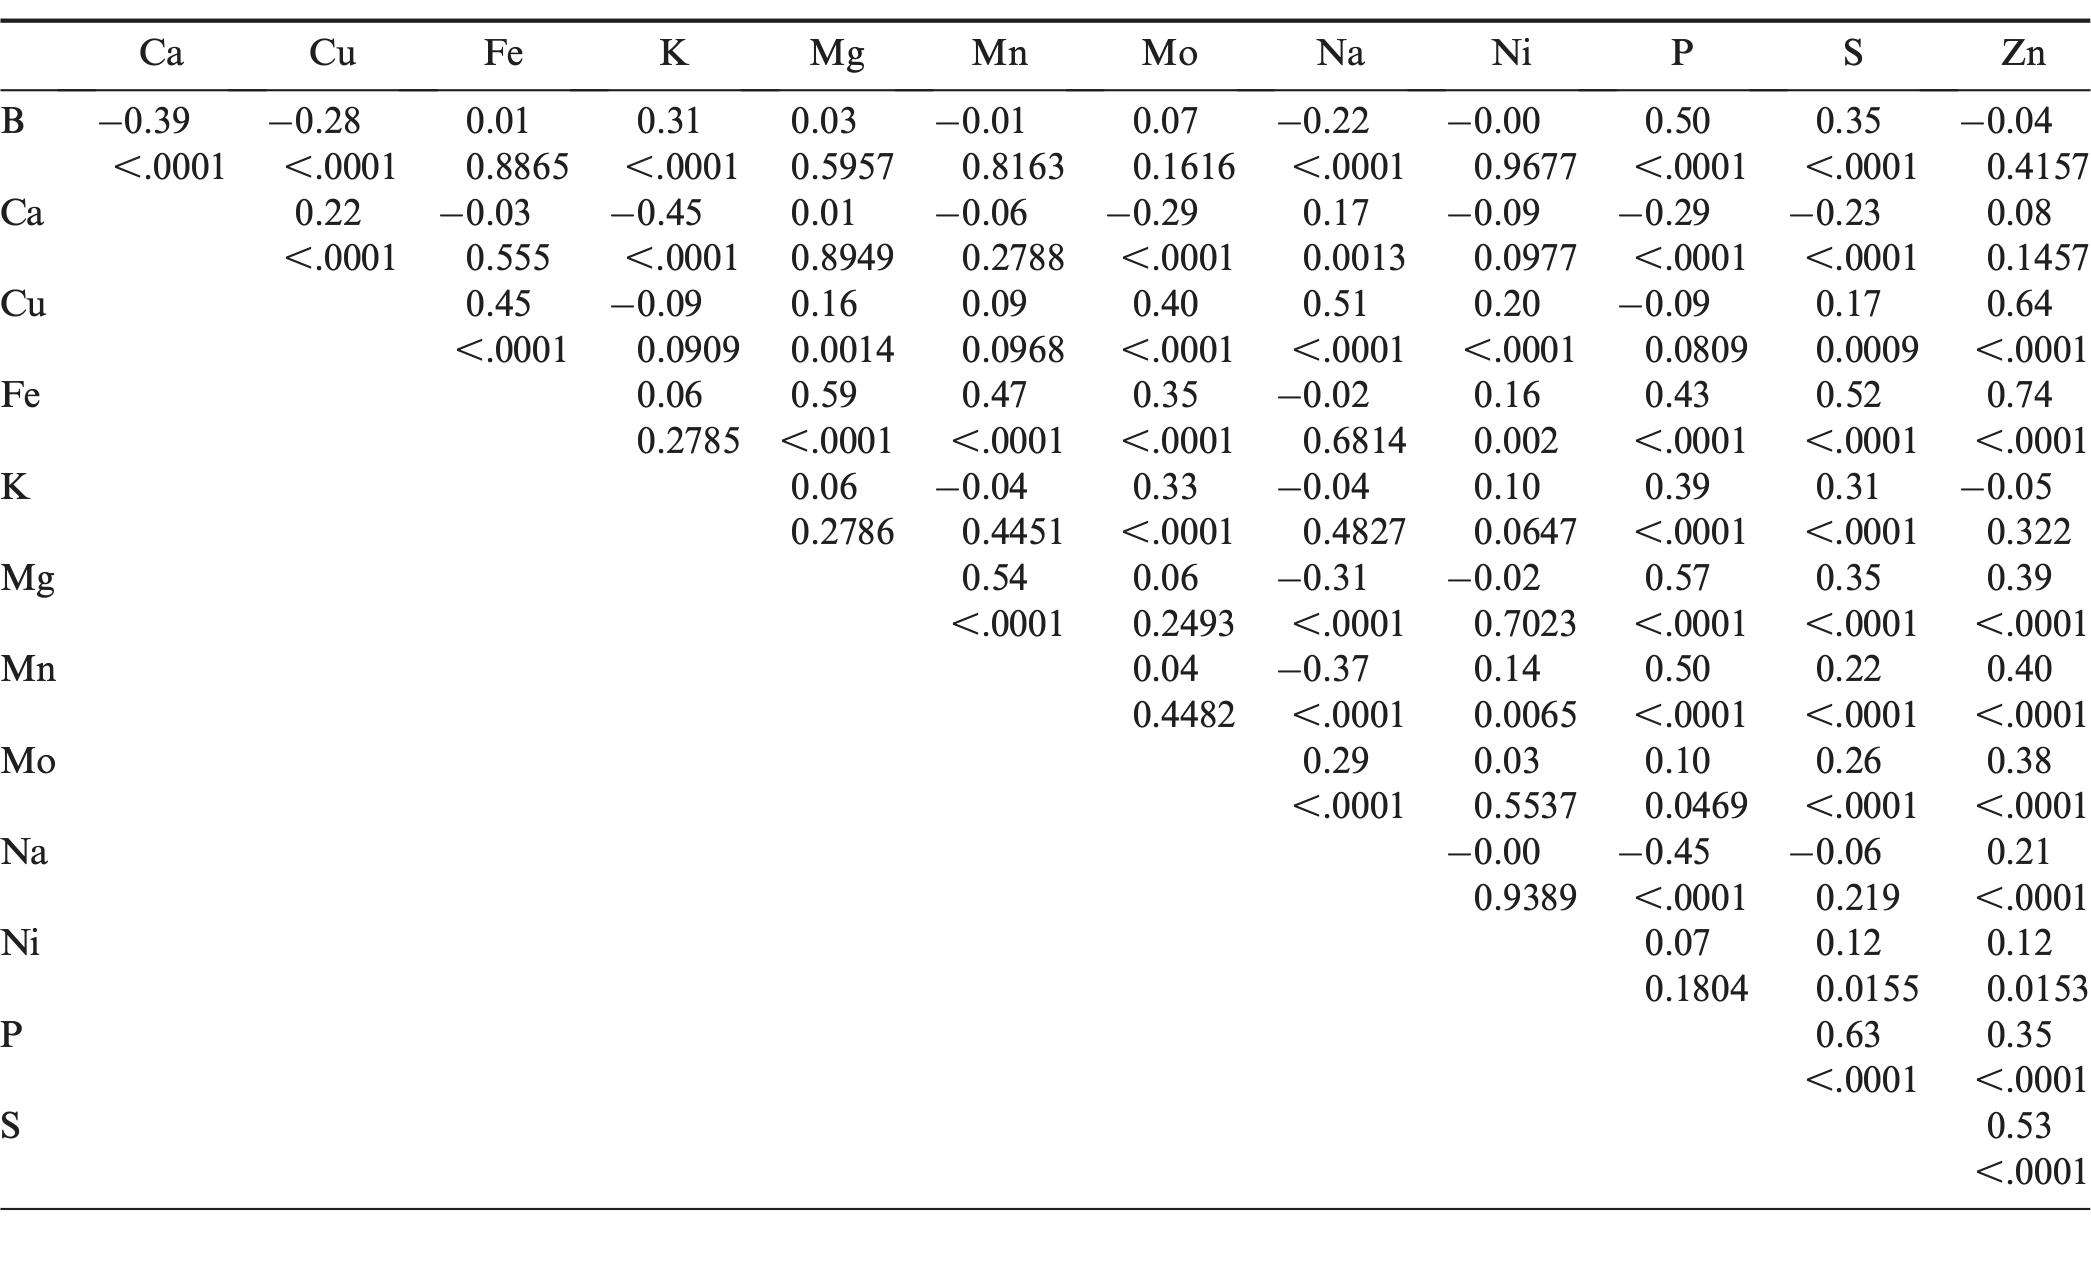
Pearson correlation coefficients and probability values for mineral concentrations among accessions within the U.S. mini-core collection.
Discussion
This study was a continuation research of the previously published report (Wang et al., 2013). The first report investigated oil percentage, fatty acid composition, flavonoid and resveratrol concentrations, and this report investigated protein percentage and mineral concentrations. In total, the seed chemical traits covered from these two reports on the U.S. peanut mini-core were 27 and also all these chemical data were collected from the same batch of seeds which were harvested from two years single location. The correlation coefficients among different chemical traits should be accurate. The only drawback for these two reports was that the seeds were harvested from single location. The soil condition may affect the chemical trait values, especially for mineral concentrations. For future experiments, seeds should be harvested from multiple years multiple locations and then used for chemical analysis.
Among accessions in the U.S. peanut mini-core collection, PI 493880 was identified as high protein material (30.4%) and PI 290620 as a low protein line (20.6%). Both accessions were collected from Argentina. Our previous data (Wang et al., 2013) indicated that PI 493880 seeds contained an average amount of oil (49.1%). If this accession is used as a breeding parent to develop high protein peanut cultivars, normal seed oil levels would not be adversely affected. Iron and Zn are two essential minerals for human health. Three accessions (PI 497517, PI 429420, and PI 493547) were identified as both high Fe (30.96, 30.94, and 30.86 μg/g DW) and high Zn (57.05, 55.53, and 56.72 μg/g DW) materials. All three accessions were from the botanical variety fastigiata var. fastigiata. This is consistent with the results in Figure 2. On average, the botanical variety fastigiata var. fastigiata had significantly higher Fe and Zn concentrations in seeds than the other three botanical varieties. Furthermore, PI 493574 also contained a higher level of seed protein (28.9%). This accession would potentially be a good parent line to use for enhancing protein, Fe, and Zn concentrations in peanut breeding programs.
Acknowledgements
The authors thank Drs. Brad Morris and Zhenbang Chen for their useful suggestions and comments on the manuscript, and Mr. Bobby Goss and Mr. Tony Toby for their help on protein analysis. Ms. Stacie Evans was a young scholar at the University of Georgia working on the protein project within USDA-ARS, PGRCU. This work was supported in part by funding from the U.S. Department of Agriculture, Agricultural Research Service through Cooperative Agreement Number 58-6250-0-008 (MAG). The contents of this publication do not necessarily reflect the views or policies of the U.S. Department of Agriculture, nor does mention of trade names, commercial products, or organizations imply endorsement by the U.S. Government.
Literature Cited
N.A., Barkley, R.E. Dean, R.N. Pittman, M.L. Wang, C.C. Holbrook, and G.A. Pederson. (2007). . Genetic diversity of cultivated and wild-type peanuts evaluated with M13-tailed SSR markers and sequencing. . Genet. Res . 89 : 93 – 106 .
J. Batra and P.K. Seth. (2002). . Effect of iron deficiency on developing rat brain. . Indian J. Clinical Biochem . 17 : 108 – 114 .
W.D. Branch, and T.P. Gaines. (1983). . Seed mineral composition of diverse peanut germplasm. . Peanut Sci . 10 : 5 – 8 .
Cobb, S.K. and B.R. Johnson. 1973 . Physiochemical properties of peanuts. In Peanuts Culture and Uses . Amer. Peanut Res. and Educ. Assoc. Stillwater , OK , pp . 209 – 263 .
L.L. Dean, K.W. Hendrix, C.C. Holbrook, and T.H. Sanders. (2009). . Content of some nutrient in the core of the core of the peanut germplasm collection. . Peanut Sci . 36 : 104 – 120 .
S.L., Dwivedi, R. Jambunathan, S.N. Nigam, K. Raghunath, K.R. Shankar KR, and G.V.S. Nagabhushanam. (1990). . Relationship of seed mass to oil and protein contents in peanut ( Arachis hypogaea L.). . Peanut Sci . 17 : 48 – 52 .
FAO , 2012 . http://faostat.org/site/567 .
C.C. Holbrook, and W. Dong. (2005). . Development and evaluation of a mini core collection for the US peanut germplasm collection. . Crop Sci . 45 : 1540 – 1544 .
S., Inanaga, T. Yoshida, T. Hoshino, and T. Nishiara. (1998). . The effect of mineral elements on the maturity of peanut seed. . Plant Soil 106 : 263 – 268 .
Jones, D.B. 1931 . Factors for converting percentages of nitrogen in foods and feeds into percentages of proteins . Circular 183, United States Dept. Agricul. pp 1 – 22 .
B.P., Pathak, J. Mukesh, B.L. Tillman, M.A. Grusak, and M. Gallo. (2013). . Effect of gypsum application on mineral composition in peanut pod walls and seeds. . Crop Sci . 53 : 1658 – 1667 .
E.C., Shin, Y.Z. Huang, R.B. Pegg, R.D. Philips, and R. Eitenmiller. (2009). . Commercial runner peanut cultivars in the United States: Tocopherol composition. J. Agricul. . Food Chem . 57 : 10289 – 10295 .
V.S. Sobolev, and R.J. Cole. (1999). . trans-Resveratrol content in commercial peanuts and peanut products. J. Agricul. . Food Chem . 47 : 14351439 .
H.D., Upadhyaya, N. Dronavalli, S. Singh, and S.L. Dwivedi. (2012). . Variability and stability for kernel iron and zinc contents in the ICRISAT mini core collection of peanut. . Crop Sci . 52 : 2628 – 2637 .
M.L., Wang, C.Y. Chen, B. Tonnis, N.A. Barkley, D. L. Pinnow, R.N. Pittman, J. Davis, C.C. Holbrook, H.T. Stalker, and G.A. Pederson. (2013). . Oil, fatty acid, flavonoid, and resveratrol content variability and FAD2A functional SNP genotypes in the U.S. peanut mini-core collection. J. Agricul. . Food Chem . 61 : 2875 – 2882 .
M.L., Wang, S. Sukumaran, N.A. Barkley, Z. Chen, C.Y. Chen, B. Guo, R.N. Pittman, H.T. Stalker, C.C. Holbrook, G.A. Pederson, and J. Yu. (2011). . Population structure and marker-association analysis of the US peanut ( Arachis hypogaea L.) mini-core collection. . Theor. Appl. Genet . 123 : 1307 – 1317 .
Winkler, R. The combustion-dumps-principle for a fast N-protein analysis (rapid N cube vario MAX) (2008) www.elementar.de .
Notes
- USDA-ARS, Plant Genetic Resources Conservation Unit, Griffin, Georgia 30223. [^]
- USDA-ARS Children's Nutrition Research Center, Department of Pediatrics, Baylor College of Medicine, Houston, Texas 77030. [^]
- Department of Crop, Soil and Environmental Sciences, Auburn University, Auburn, Alabama 36849. [^]
- Department of Experimental Statistics, University of Georgia, Griffin, Georgia 30223. [^]
- Department of Food Science and Technology, University of Georgia, Griffin, Georgia 30223. [^]
- USDA-ARS, Crop Genetics and Breeding Research Unit, Tifton, Georgia 31793 [^] *Corresponding author e-mail: mingli.wang@ars.usda.gov; mike.grusak@ars.usda.gov. These two authors contributed equally to this work.
Author Affiliations