

Introduction
Peanut production is vital to the Georgia agricultural industry, both economically and as a rotational crop for traditional row-crop producers. Georgia accounts for 49% of the peanut production in the U.S., with planted acreages averaging 231,000+ ha annually (2000–2009) (Georgia Peanut Commission, 2010). The majority (>90%) of peanut production in Georgia occurs in the Coastal Plain region. The highly-weathered, sandy soils and relatively high rainfall in this region are generally favorable for the crop. However, these soils, traditionally cropped under conventional tillage (CT) practices, tend to be drought-prone, and are susceptible to runoff, sediment, and chemical losses. Rainfall in the Coastal Plain (∼1250 mm/yr) tends to have short duration-high intensity, runoff producing storms especially at critical times during the growing season when antecedent water content is high and/or soil cover (residue, canopy) is none to minimal. Also, climatic conditions can yield extended drought periods during the crop growing season, thus, peanut production generally includes supplemental irrigation to minimize yield limiting water stress.
Conservation tillage (strip tillage, ST) adoption in the Coastal Plain region of Georgia has increased because ST systems accumulate residue and organic carbon at the soil surface, which dissipates raindrop impact energy and increases soil resistance; thus maintaining infiltration and reducing runoff, soil detachment, and sediment transport (Reeves, 1997; Truman et al., 2005; Truman et al., 2007; Truman and Nuti, 2010; Truman et al., 2011). However, studies have reported less runoff from CT systems than ST systems, especially 1–3 yrs after ST adoption due to increased consolidation (NeSmith et al., 1987; Radcliffe et al., 1988; Soileau et al., 1994; Cassel and Wagger, 1996). Consequently, paratilling, a non-inversion, deep tillage technique, is often used in ST systems to disrupt dense, water-restrictive subsurface layers. After fall paratilling in 2007, bulk densities for ST were as much as 31% less than those for ST prior to paratilling at the study site described herein. Disrupting these layers with paratilling reduces bulk density, increases infiltration, and reduces runoff (Truman et al., 2005; Truman et al., 2007). In the Coastal Plain region of Georgia, it is generally recommended that land managed in ST and planted to peanut be paratilled in the fall prior to planting peanut the following spring.
Frequency of severe rainfall events has increased throughout the U.S., including the Southeast, mainly in the form of increased intensity of extreme rainfall events (Nearing et al., 2005; Todd et al., 2006). Changes in rainfall intensity within a storm affect how rainfall is partitioned (infiltration, runoff) and sediment and chemical transport (Potter et al., 2010; Truman et al., 2007; Truman et al., 2011).
In the Coastal Plain region of Georgia, data are limited on effects of peanut cropping systems on runoff and sediment yields. Truman & Williams (2001) used simulated rainfall (I = 63.5 mm/h) to evaluate runoff and soil loss from single- and twin-row peanut systems as a function of canopy cover conditions. They found that single-row planted peanut had as much as 3-times more runoff and soil loss than twin-row planted peanut. Twin-row planted peanut maximized peanut canopy development and percent soil cover early in the growing season and minimized the time in which bare soil is vulnerable to a runoff producing rainstorm. However, they did not evaluate peanut production under strip-tillage nor with variable rainfall intensity patterns that commonly occur throughout the growing season. Our objective was to quantify runoff and sediment losses from a Tifton loamy sand managed under conventional- (CT) and strip- (ST) tillage systems and planted to peanut at planting, 30 days after planting, and after harvest.
Materials and Methods
The 1-ha field site was located near Tifton, GA (N 31° 26′, W 83° 35′) on a Tifton loamy sand (Typic Kandiudult; 82% sand, 7% clay; 2% slope), which represents over 762,000 farmable ha in the Coastal Plain region of Georgia. The site has been managed under CT and ST systems in a cotton (Gossypium hirsutum)-peanut (Arachis hypogea) rotation since 1998 (Potter et al., 2010; Truman et al., 2011). The CT consisted of fall disking, drilling a winter rye (Secale cerale) cover crop, followed by spring disking, turning with a moldboard plow, field cultivator levelling/conditioning, and bedding. Rye surface cover was incorporated 10–15 cm. The ST consisted of planting a winter rye cover just after crop harvest in the fall and killing the rye chemically 30 days before planting the next year's row crop. All ST plots were paratilled (depth = ∼30 cm) in the fall (11 October, 2007) prior to the 2008 peanut growing season. With ST, a 10-cm wide strip was tilled and used to plant the crop into. In 2008, this site was cropped to single-row peanut (planted 12 May, 0.9 m row spacing). Surface residue cover for CT and ST were <1 and 50%, respectively.
Rainfall simulation plots (2-m wide, 3-m long) were established on each treatment combination at three critical times during the 2008 peanut growing season: 13–20 May (freshly tilled seedbed condition at planting); 23–26 June (first fungicide application with minimal canopy cover); and 21–31 October (tilled/disturbed soil surface immediately after harvest with peanut hay distributed back over bed). Each 6-m2 plot consisted of a wheel track and two half beds on either side of the wheel track. Antecedent water content (w) was determined gravimetrically (Gardner, 1986) from samples taken in three locations around each 6-m2 plot just prior to simulating rainfall (0–2 and 2–15 cm depths).
Simulated rainfall was applied with an oscillating nozzle rainfall simulator (Truman et al., 2011) that used 80150 Veejet nozzles (2.3-mm median drop size). The simulator was placed 3 m above each 6-m2 plot. Simulated rainfall was applied at three variable rainfall intensity (Iv) patterns: a spring time variable intensity pattern used at planting (IvSPR); a summer time variable intensity pattern used at the first fungicide application (IvSUM); and a fall time variable intensity pattern used just after peanut harvest (IvFALL) (Fig. 1). Data from the IvSPR pattern have been reported previously (Potter et al., 2010).
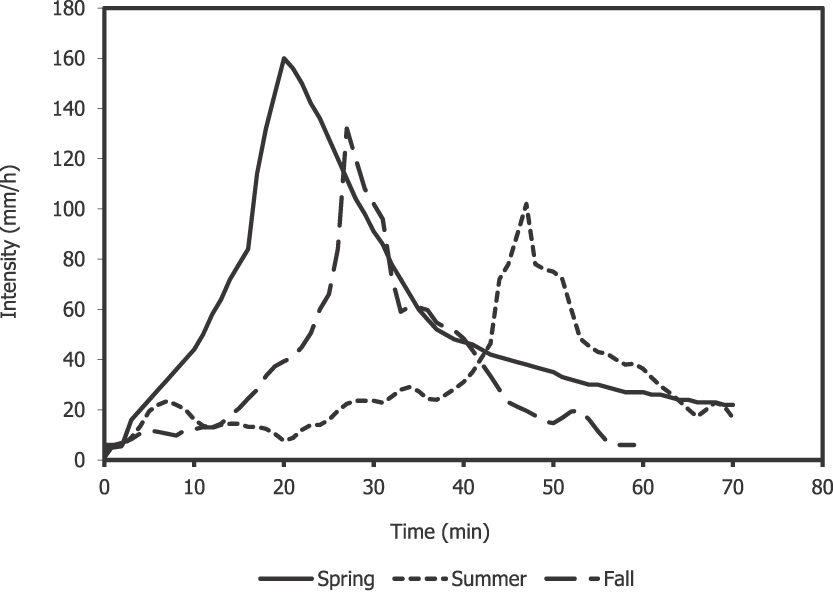
Simulated variable rainfall intensity patterns evaluated.
Variable rainfall intensity patterns were developed from measured 5- and 1-min natural rainfall data (30 yrs) collected at Tifton, GA. Natural rainfall during the spring (March, April, May), summer (June, July, August), and fall (September, October, November) were analyzed to determine respective patterns that occurred most frequently during each 3-month season. Parameters (Imax, time to Imax, Precipmax, duration) were averaged for the group of natural storms occurring most often during each 3-month season. For each season, the individual storm with the most parameters similar to the average of the entire group of storms was selected and its pattern programmed into the simulator on a 1-min basis as the representative Iv pattern for that 3-month season (IvSPR for spring; IvSUM for summer; IvFALL for fall).
Rainfall duration for the IvSPR, IvSUM, and IvFALL patterns was 70, 70, and 60 min, respectively. Average rainfall I during the IvSPR, IvSUM, and IvFALL patterns was 56, 30, and 36 mm/h, respectively. Maximum rainfall I during the IvSPR, IvSUM, and IvFALL patterns was 160, 102, and 132 mm/h, respectively. Total rainfall volume applied to each 6-m2 plot was repeatable (avg. IvSPR = 61 mm, CV = 3%; avg. IvSUM = 30 mm, CV = 3%; avg. IvFALL = 36 mm, CV = 2%). Irrigation well water was used in all simulations. Runoff (R) and sediment (E) were measured from the down slope end of each 6-m2 plot at 5-min intervals throughout each simulation, and determined gravimetrically. Infiltration (INF) was calculated by difference (rainfall-runoff). The parameter dINF was calculated by difference (maximum INF–minimum INF). Estimates of days of water for crop use for Ivsum events were calculated from INF values for each tillage treatment and an assumed evapotranspiration value (6 mm/day).
Treatments consisted of two tillage systems (CT, ST) and three rainfall intensity patterns (IvSPR, IvSUM, IvFALL). Means, coefficients of variation (CV, %), and standard error bars are given for measured data (n = 3). Unpaired t-tests (two-tailed distribution) were used to determine significance among treatment means using SigmaStat 3.1 (Systat, 2004). All test statistics were evaluated at P = 0.05, unless otherwise noted. All other data analysis was conducted with Microsoft Office Excel 2007.
Results and Discussion
Spring (IvSPR) event
Runoff and infiltration from CT and ST plots was 11–13% and 87–89% of the total rainfall applied, respectively (Table 1); no significant differences were found for runoff or infiltration parameters for CT and ST treatments. In previous studies, runoff from CT plots (avg. = 36% of rainfall applied) was 2.3- to 5.1-fold greater than that from ST plots (avg. = 10% of rainfall applied) (Truman et al., 2007; Truman and Nuti, 2010; Truman et al., 2011). Relatively low and similar water contents of the top 15 cm soil depth for CT and ST plots, especially the 0–2 cm layer (w = ∼1.0%), contributed to similar runoff yields from CT and ST plots. The sandy Ap horizon (82% sand, 0–30 cm) of the Tifton loamy sand allows water to infiltrate quickly to less permeable subsurface horizons. Porosities for the Ap horizon were 10% greater than those for the argillic (Bt) horizon (30–51 cm); hydraulic conductivities for Ap and Bt horizons were 5–15 cm/h and 2.5–5 cm/h, respectively (C. Truman, D. Bosch, unpublished data). Infiltrating water is “backed up” during a rainfall event as it reaches the Bt horizon, effectively decreasing infiltration and generating runoff. Amount of water in the Ap horizon when rainfall starts affects how much additional water it can hold before infiltration is decreased and runoff starts. Relatively low water contents at the beginning of IvSPR events yields less water in the Ap horizon, thus more infiltration and less runoff occurs.
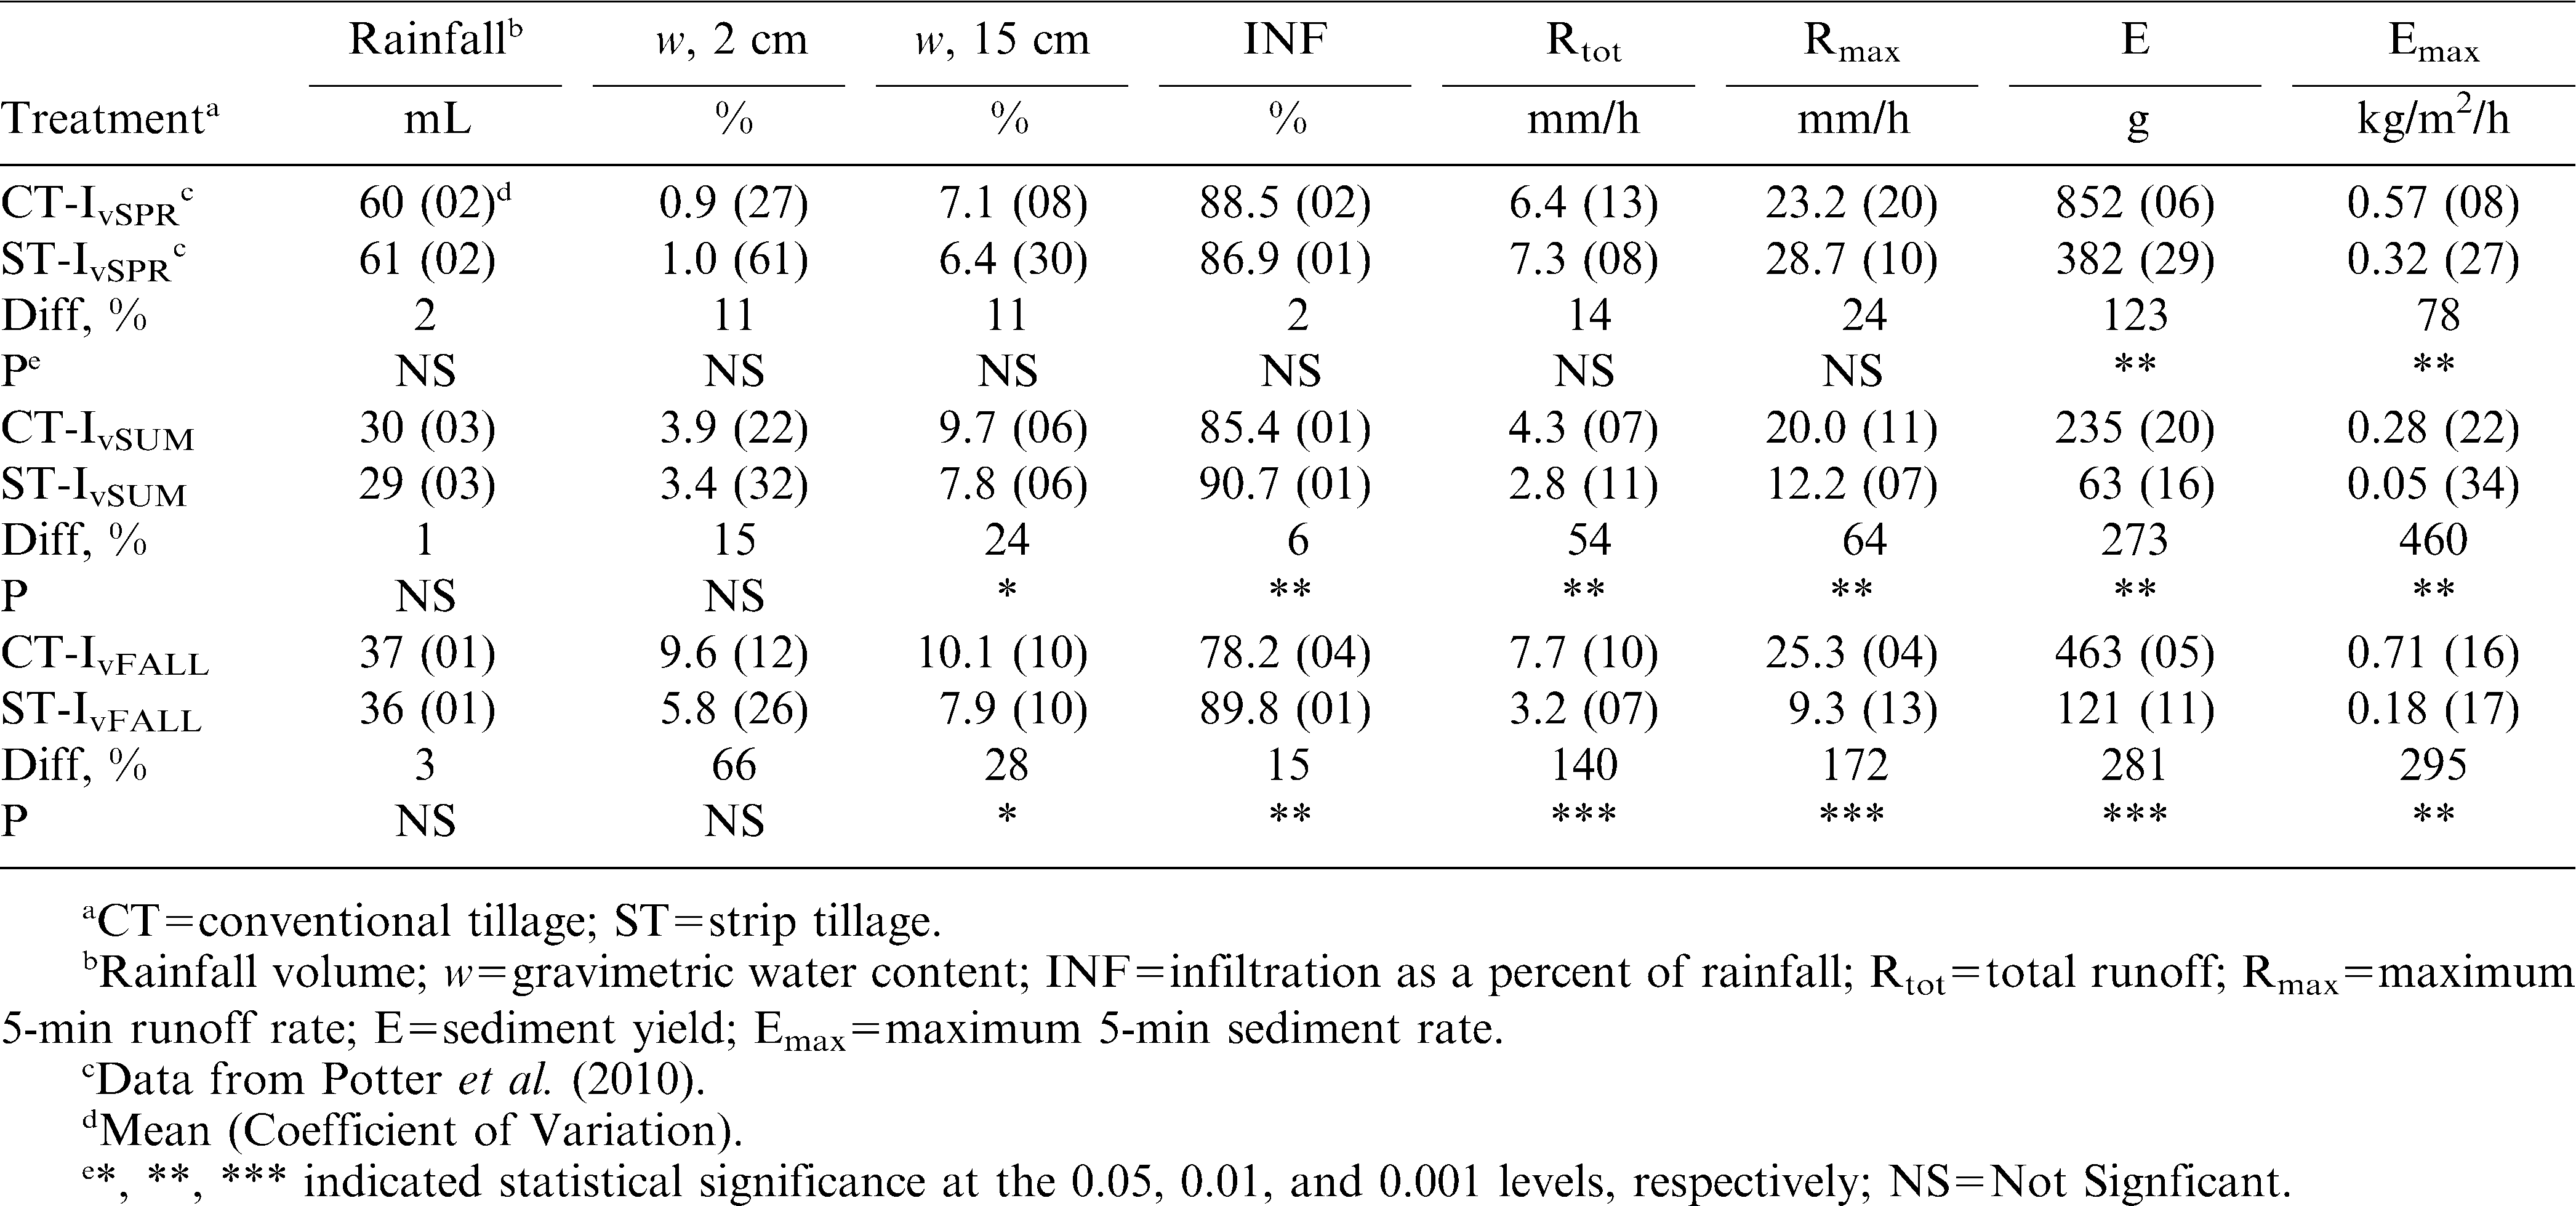
Hydrology and erosion parameters for each treatment studied.
Sediment yields for IvSPR events ranged from 636–1419 kg/ha (Table 1). The CT plots had 2.2-fold more sediment than ST plots. Runoff (Fig. 2A) and sediment (Fig. 2B) curves for CT and ST plots had similar shapes as the IvSPR pattern. After 15 min of rainfall, runoff and sediment rates increased sharply until each reached its peak. Maximum 5-min runoff (Rmax) values for CT and ST plots were similar (Table 1), and were 14–18% of the maximum intensity (160 mm/h) for the IvSPR event. Maximum 5-min sediment (Emax) values and Rmax values occurred 5–8 min after the maximum intensity for the IvSPR event (20 min). Values of Emax for CT plots were 78% higher than those for ST plots. After reaching respective Rmax and Emax values, runoff curves declined at similar rates and sediment curves declined at different rates until 40 min. From 40 min until the end of the IvSPR event, runoff and sediment curves decreased at a much lower rate.
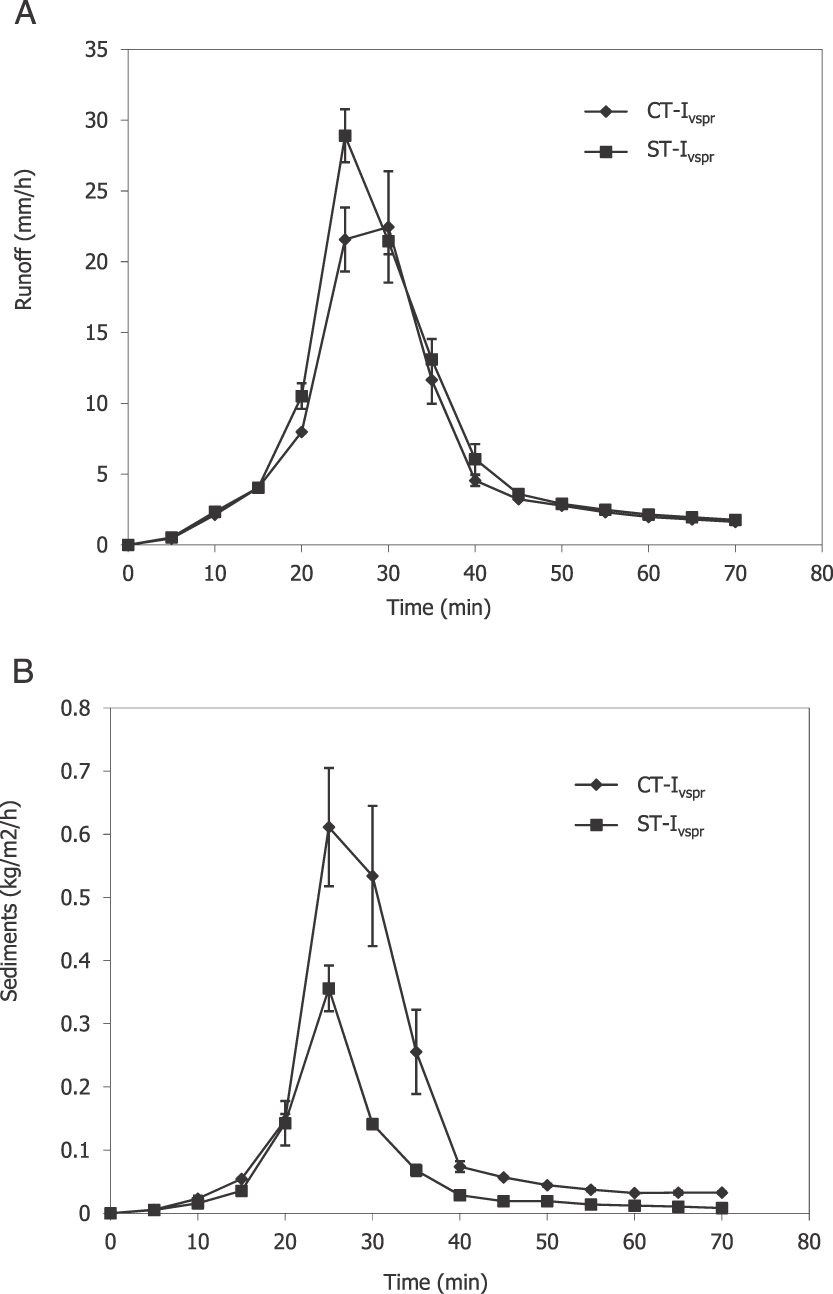
Runoff (A) and sediment yield (B) rates for the CT and ST treatments during the 70 min Ivspr simulated rainfall events (bars=standard error, S.E.).
Summer (IvSUM) event
Runoff and infiltration from CT and ST plots was 9–14% and 86–91% of the total rainfall applied, respectively (Table 1). Sediment yields from CT and ST plots ranged from 105–392 kg/ha. The CT plots had 54% more runoff and 3.7-fold more sediment than ST plots. Runoff (Fig. 3A) and sediment (Fig. 3B) curves for CT and ST plots had similar shapes as the IvSUM pattern. After 45 min of rainfall, runoff and sediment rates increased sharply until each reached its peak. Values of Rmax for CT and ST plots were 12–20% of maximum intensity (102 mm/h) for the IvSUM event; Rmax and Emax values for CT and ST plots occurred 3–4 min after the maximum intensity for the IvSUM event (47 min). Values of Rmax and Emax for CT plots were 64% and 5.6-fold higher than those for ST plots. After reaching respective Rmax and Emax values, runoff curves declined at similar rates and sediment curves declined at different rates until 60 min. Peanut canopy cover during the IvSUM event averaged 10% (∼30 days after planting), and influenced runoff and sediment losses, especially combined with surface residue cover on ST plots.
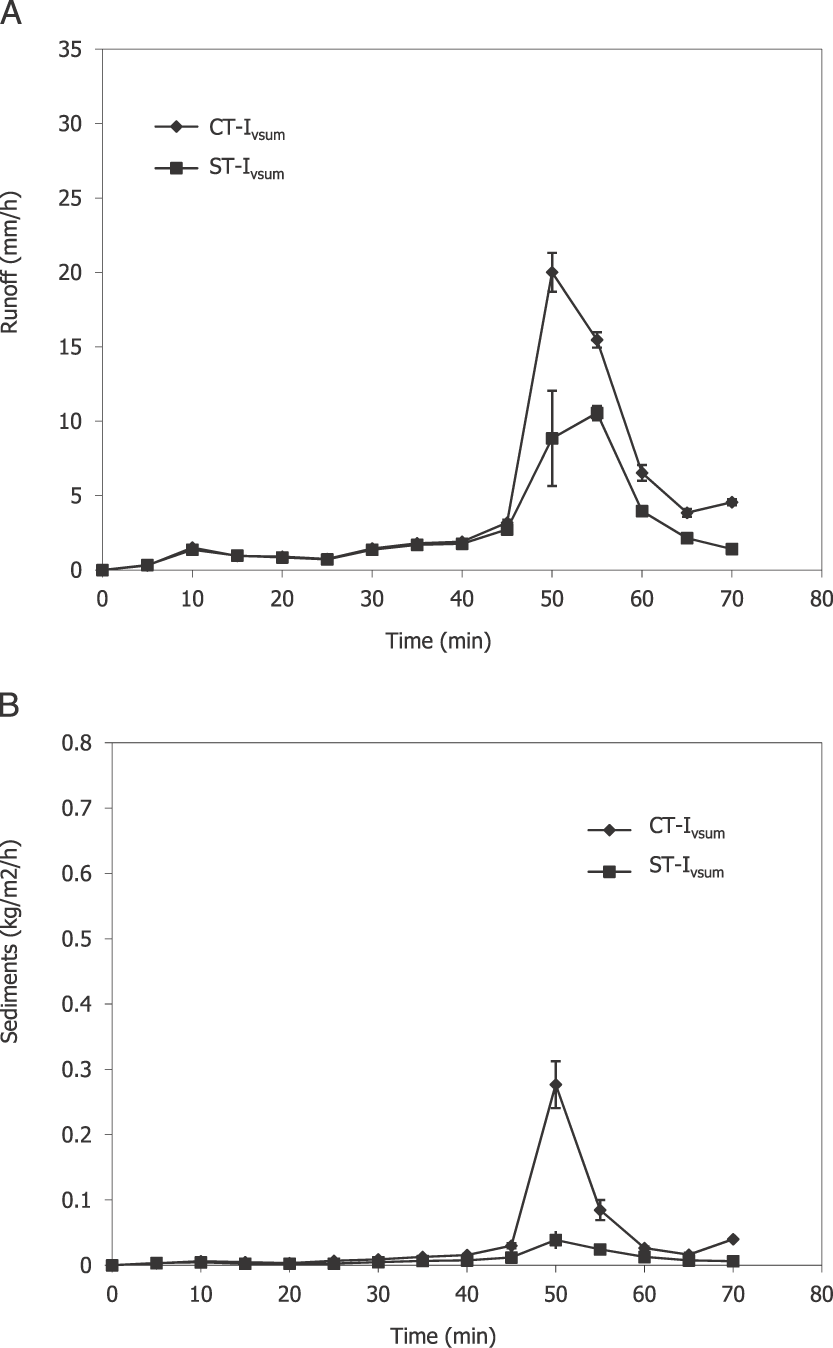
Runoff (A) and sediment yield (B) rates for the CT and ST treatments during the 70 min Ivsum simulated rainfall events (bars=standard error, S.E.).
Fall (IvFALL) event
Runoff and infiltration from CT and ST plots were 9–22% and 78–91% of the total rainfall applied, respectively (Table 1). Sediment yields from CT and ST plots ranged from 202–771 kg/ha. The CT plots had 2.4-fold more runoff and 3.8-fold more sediment than ST plots. Runoff (Fig. 4A) and sediment (Fig. 4B) curves had similar shapes as the IvFALL pattern. After 25 min of rainfall, runoff and sediment rates increased sharply until each reached its peak. Values of Rmax for CT and ST plots were 7–19% of maximum intensity (132 mm/h); Rmax and Emax values for CT and ST plots occurred 6–8 min after the IvFALL peak (27 min). Values of Rmax and Emax for CT plots were 2.7-fold and 3.9-fold higher than those for ST plots. After reaching respective Rmax and Emax values, runoff and sediment curves declined at different rates for the remaining IvFALL event duration (60 min). Runoff rates gradually declined never reaching a steady-state rate; Sediment rates from 40 to 60 min were low, like those for this 0–25 min time period.
Comparing events, the most runoff occurred from CT-IvFALL plots; the least from ST-IvSUM plots. Since each seasonal event had different rainfall volumes and/or durations, we compared runoff and sediment losses per unit of rainfall applied across all events. For runoff, maximum and minimum amounts occurring from CT-IvFALL and ST-IvSUM plots were the same whether comparing runoff with units of mm/h or expressed as a percentage of rainfall applied. The most sediment occurred from CT-IvSPR plots; the least from ST-IvSUM plots. When data were expressed as sediment loss per unit of rainfall applied, the greatest loss occurred from CT-IvFALL plots, despite having 1.8-fold less sediment than CT-IvSPR plots. Thus, CT-IvFALL plots yield the most runoff and sediment per unit of rainfall applied among treatment combinations evaluated.
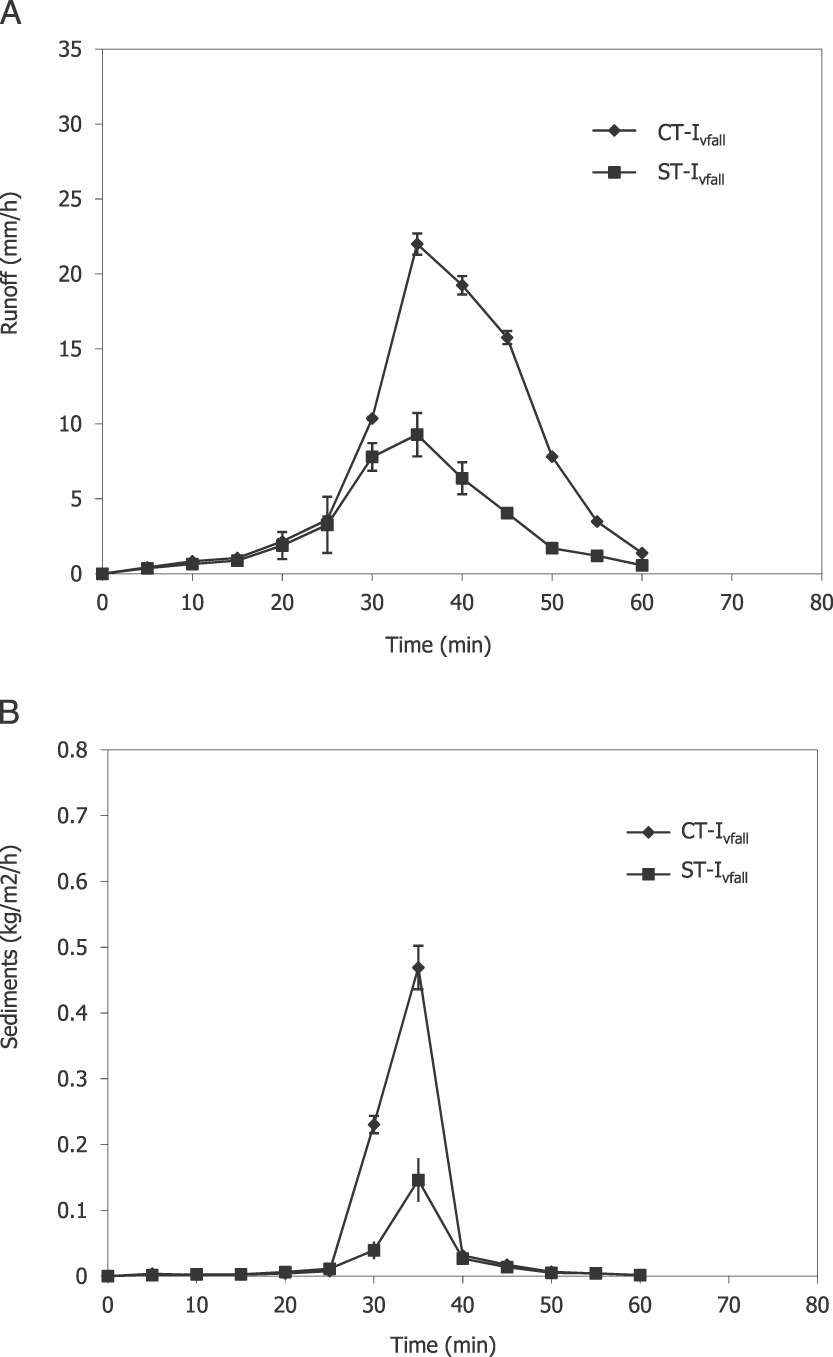
Runoff (A) and sediment yield (B) rates for the CT and ST treatments during the 60 min Ivfall simulated rainfall events (bars=standard error, S.E.).
Runoff and sediment yields for this study are compared to those of Truman and Williams (2001) to see if differences in runoff and sediment losses exist between constant and seasonal, variable intensity patterns during similar times during the peanut growing season (Table 2). Note all comparisons are for CT and single-row peanut treatments on a Tifton loamy sand; Truman and Williams used constant intensity (I = 63.5 mm/h) simulated rainfall, whereas the current study used variable intensity simulated rainfall representative of each season (spring, summer, fall). Runoff (% of rainfall applied) from Truman and Williams was 2.5–3.0 fold greater than the current study, except for fall in which runoff from both studies were similar. The highest runoff from the Truman and Williams study was from the summer season (26–30 days after planting); highest runoff for the current study was from the fall season (after harvest). For sediments, similar sediment yields are reported from both studies for the spring season. However, sediment yield from the Truman and Williams study was 11-fold greater for summer than the current study; yet the current study reports sediment yields that are 2.4-fold greater than those from Truman and Williams for the fall season. Data indicate that differences in runoff and sediment yield comparisons between the two studies were due to the respective rainfall intensity patterns used in each study. Truman et al. (2007) also found differences in runoff, sediment, and carbon transport between constant and variable intensity simulated rainfall, and reported the implications of their results on model predictions of runoff, sediment, and agrichemicals.
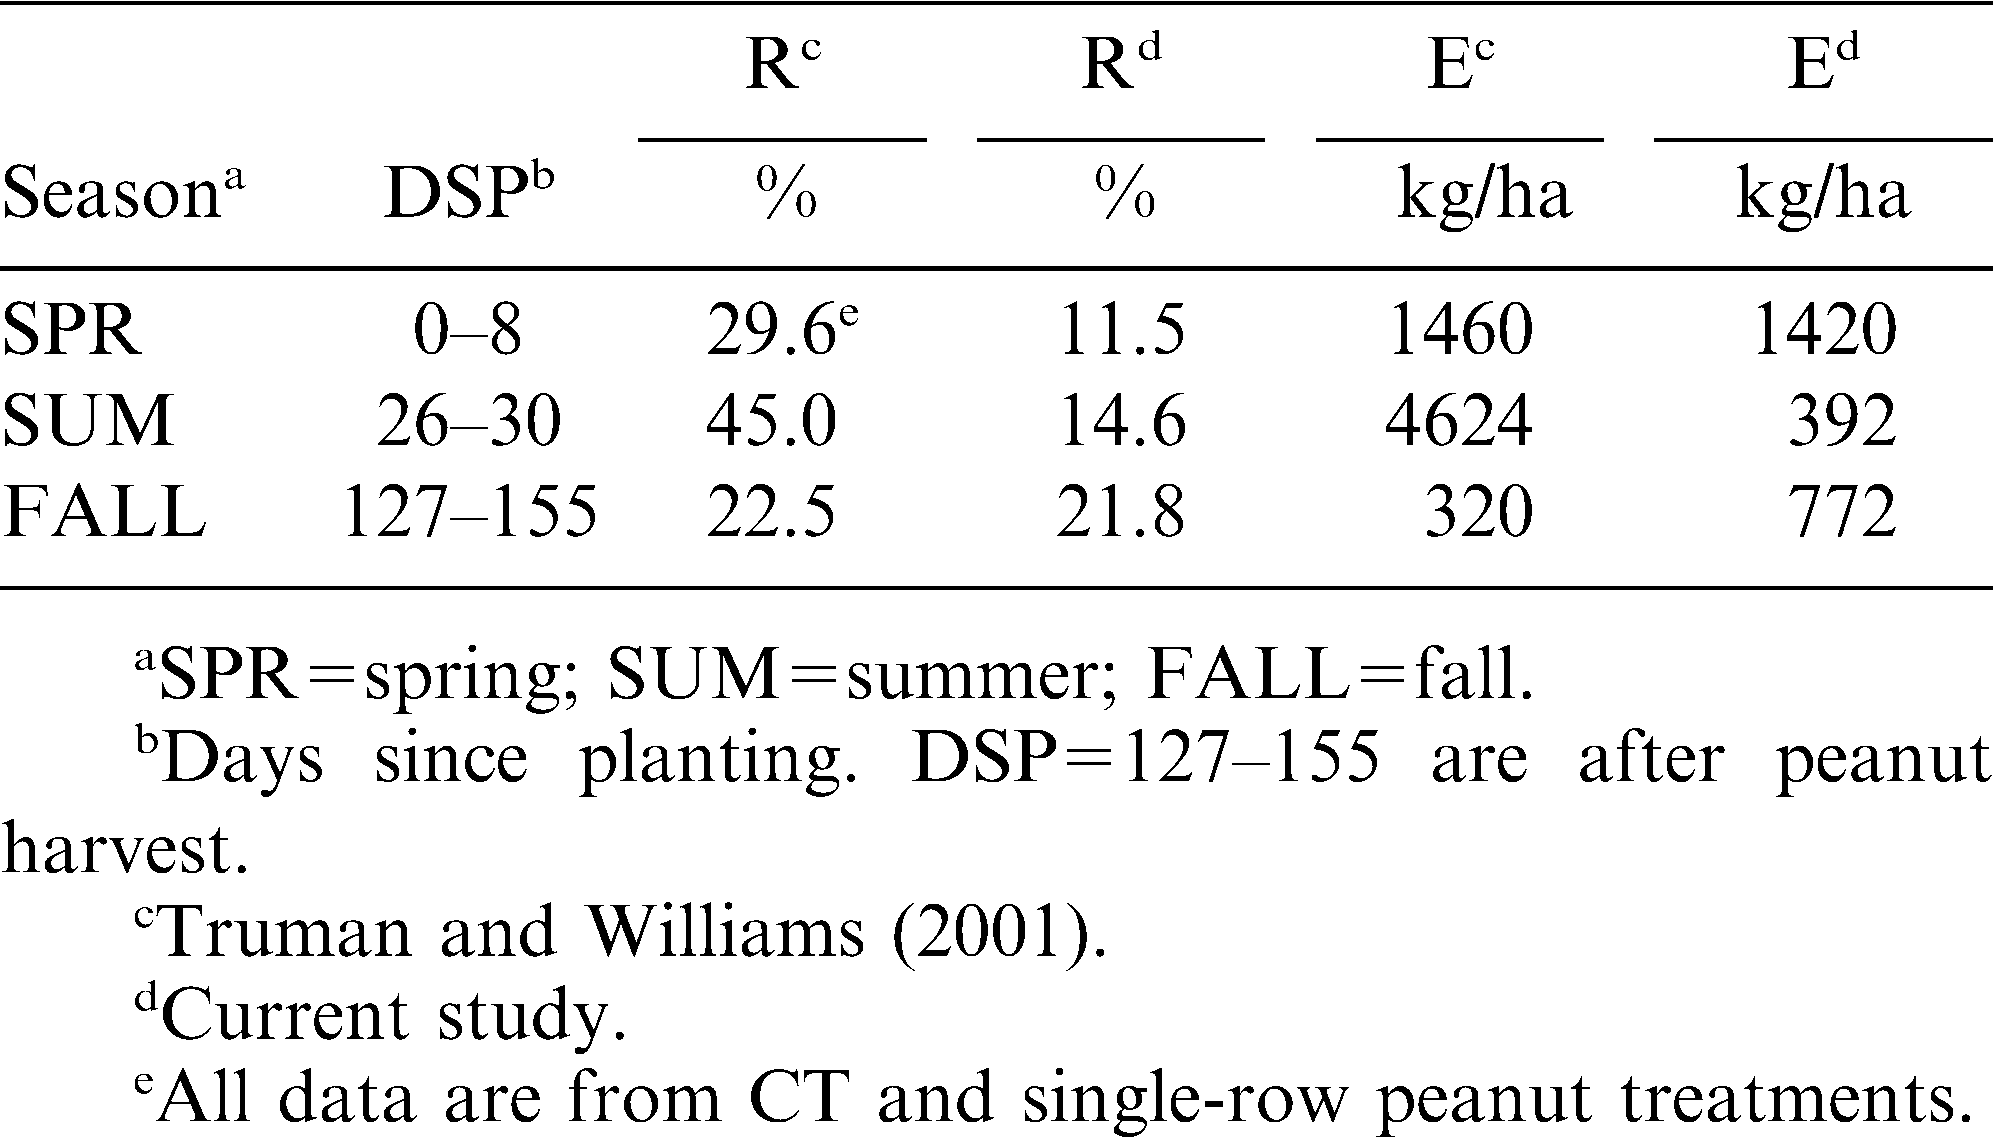
Runoff (R, % of rainfall applied) and sediment yield (E) comparisons.
For the Tifton loamy sand, transport relationships mostly determine measured sediment yields. Runoff curves had similar shapes as rainfall intensity patterns for all Iv patterns studied. Correlation values (r) for intensity vs. runoff from CT and ST plots for IvSPR, IvSUM, and IvFALL events were 0.91, 0.94, 0.93, 0.91, 0.73, and 0.95, respectively. Sediment from the Tifton loamy sand is susceptible to deposition due to transport-limiting conditions (large sediment sizes and/or low runoff transport capacity) during a rainfall event, which influences measured sediment. Correlation values (r) for runoff vs. sediment yield from CT and ST plots for IvSPR, IvSUM, and IvFALL events were 0.99, 0.94, 0.91, 0.92, 0.66, and 0.82, respectively. These r values decreased as w increased.
Tillage impacted runoff and sediment amounts and rates for IvSPR, IvSUM, and IvFALL events. Strip-tillage reduced runoff for IvSUM, and IvFALL events, and sediment losses for all three events. Over all events, CT plots (<1% residue cover) averaged 60% more runoff, 86% higher Rmax values, 3.3-fold more sediment, and 3.7-fold higher Emax values than ST plots (50% residue cover). Residue cover associated with ST effectively reduced surface sealing (Baumhardt et al., 1993; Alberts and Neibling, 1994; Potter et al., 1995; Baumhardt and Lascano, 1996). Values for dINF (INFmax-INFmin) relate to the degree of surface sealing (15, 18) with larger dINF values indicative of more surface sealing. For the IvSPR event, CT plots had dINF values (117.8) that were 6% greater than those for ST plots (110.9) (P = 0.026). Thus, CT plots experienced more surface sealing than ST plots, yet surface sealing did not significantly change rainfall partitioning characteristics. Values of dINF were not calculated for IvSUM events because of peanut canopy cover present (∼10%); they were calculated for IvFALL events, but no significant differences were found between CT and ST plots (86.0 vs. 87.8). Infiltration differences among CT and ST for IvSUM events (∼30 days after planting) are important to the peanut crop in terms of water availability during the summer months of the growing season when daily air temperatures routinely exceed 32°C (90°F) and rainfall can be sporadic. If one assumes that all infiltration from the IvSUM event for CT and ST plots is available for crop use and an evapotranspiration value of 6 mm/d, days of water for crop use can be calculated for CT and ST treatments. For the IvSUM event, CT and ST plots had 3.6 and 3.9 days of water for crop use (0.3 d or 8% difference; P = 0.008). The 1.4 mm of water or 0.3 days of water for crop use difference is for just this one event, and could make a difference in water stress levels and/or irrigation timing, and/or costs, especially given the porous surface horizon and low water holding capacity of the Tifton loamy sand.
Summary and Conclusions
We quantified runoff and sediment losses from a Tifton loamy sand managed under CT and ST systems and planted to peanut at three times during the peanut growing season (at planting, 30 days after planting, after harvest). Rainfall simulation events with variable rainfall intensities (Iv) representative of each time period (spring, IvSPR; summer, IvSUM; fall, IvFALL) were used. We found that over the three seasonal events, runoff and infiltration from CT and ST plots was 9–22% and 78–91% of the total rainfall applied, respectively. The most runoff occurred from CT-IvFALL plots; the least from ST-IvSUM plots. Sediment yields from CT and ST plots ranged from 105–1419 kg/ha. The most sediment occurred from CT-IvSPR plots; the least from ST-IvSUM plots. On a per unit rainfall applied basis, the most sediment occurred from CT-IvFALL plots. Thus, CT-IvFALL plots yield the most runoff and sediment per unit of rainfall applied among treatment combinations evaluated. Runoff and sediment curves for CT and ST plots had similar shapes as corresponding simulated rainfall patterns. Rainfall intensity and runoff from CT and ST plots for IvSPR, IvSUM, and IvFALL events were correlated (r = 0.73–0.95). Runoff and sediment yield from CT and ST plots for IvSPR, IvSUM, and IvFALL events were also correlated (r = 0.66–0.99). Values of Rmax for CT and ST plots were 14–18% of the maximum intensity (160 mm/h) for IvSPR events, 12–20% of the maximum intensity (102 mm/h) for IvSUM events, and 7–19% of maximum intensity (132 mm/h) for IvFALL events. Values of Rmax and Emax for CT and ST plots occurred 5–8 min after the maximum intensity for IvSPR events (20 min); 3–4 min after the maximum intensity for IvSUM events (47 min); and 6–8 min after IvFALL events (27 min).
Strip-tillage reduced runoff for IvSUM, and IvFALL events, and sediment losses for all three events. Over all events, CT plots averaged 60% more runoff, 86% higher Rmax values, 3.3-fold more sediment, and 3.7-fold higher Emax values than ST plots. Maximum difference between CT and ST plots for runoff (2.4-fold), Rmax (2.7-fold), and sediment (3.8-fold) was for fall events; maximum difference between CT and ST plots for Emax (5.6-fold) was for summer events.
Frequently occurring rainfall intensity patterns that occur during critical times (planting, first fungicide application ∼30 days after planting, immediately after harvest) during the peanut growing season influences infiltration, runoff, and sediment yields. Our results show the pronounced effect of the three rainfall intensity patterns and tillage on runoff and sediment losses from those periods during the peanut growing season. Understanding the magnitude of runoff and sediment losses help define “windows of risk” and how conservation tillage can reduce those losses and help producers manage natural resources and agrichemical losses from peanut cropping systems.
Literature Cited
Alberts E.E and Neibling W.H 1994 Influence of crop residues on water erosion 19 – 39 In Unger P.W (ed.) Managing agricultural residues Lewis Publ. , Chelsea, MI
Baumhardt R.L Keeling J.W and Wendt C.W 1993 Tillage and residue effects on infiltration into soils cropped to cotton Agron. J. 85 : 379 – 383 .
Baumhardt R.L and Lascano R.J 1996 Rain infiltration as affected by wheat residue amount and distribution in ridged tillage Soil Sci. Soc. Am. J. 60 : 1908 – 1913 .
Cassel D.K and Wagger M.G 1996 Residue management for irrigated maize grain and silage production Soil Till. Res. 39 : 101 – 114 .
Franklin D.H Truman C.C Potter T.L Bosch D.D Strickland T.C and Bednarz C.W 2007 Inorganic N & P runoff losses from variable and constant intensity rainfall simulations on a Loamy Sand under conventional and strip tillage systems J. Environ. Qual. 36 : 846 – 854 .
Gardner W.H 1986 Water content 493 – 594 In Klute A (ed.) Methods of Soil Analysis, Part 1. Physical and Mineralogical Methods. Agron. Monogr. 9 (2nd Edition) ASA and SSSA Madison , WI .
Georgia Peanut Commission. 2010 , www.gapeanuts.com. [verified: 12/07/2010].
Nearing M.A Jetten V Baffaut C Cerdan O Couturier A Hernandez M Le Bissonnais Y Nichols M.H Nunes J.P Renschler C.S Souchere V and van Oost K 2005 Modeling response of soil erosion and runoff to changes in precipitation and cover Catena 61 : 131 – 154 .
NeSmith D.S Radcliffe D.E Hargrove W.L Clark R.L and Tollner E.W 1987 Soil compaction in double-cropped wheat and soybeans on an Ultisol Soil Sci. Soc. Am. J. 51 : 183 – 186 .
Potter K.N Torbert H.A and Morrison J.E 1995 Tillage and residue effects on infiltration and sediment losses on vertisols Trans. Am. Soc. Ag. Eng. 38 : 1413 – 1419 .
Potter T.L Truman C.C Strickland T.C Bosch D.D and Webster T.M 2008 Herbicide incorporation by irrigation and tillage impact on runoff loss J. Environ. Qual. 37 : 839 – 847.
Potter T.L Gerstl Z White P.W Cutts G.S Webster T.M Truman C.C Strickland T.C and Bosch D.D 2010 Fate and efficacy of metolachlor granular and emulsifiable concentrate formulations in a conservation tillage system J. Agric. Food Chem. 58 : 10590 – 10596 .
Radcliffe D.E Tollner E.W Hargrove W.L Clark R.L and Golabi M.H 1988 Effect of tillage practices on infiltration and soil strength of a Typic Hapludult soil after ten years Soil Sci. Soc. Am. J. 52 : 798 – 804 .
Reeves D.W 1997 The role of organic matter in maintaining soil quality in continuous cropping systems Soil Till. Res. 43 : 131 – 167 .
Soileau J.M Touchton J.T Hajek F.F and Yoo K.H 1994 Sediment, nitrogen, and phosphorus runoff with conventional- and conservation-tillage cotton in a small watershed J. Soil Water Conserv. 49 : 82 – 89 .
Systat 2004 , SigmaStat. 3.1. Systat Software Point Richmond , CA .
Todd C.E Habor J.M and Yyner B 2006 Increasing magnitudes and frequencies of extreme precipitation events used for hydraulic analysis in the Midwest J. Soil Water Conserv. 61 : 179 – 185 .
Truman C.C and Williams R. G 2001 Effects of peanut cropping practices and canopy cover conditions on runoff and sediment yield J. Soil and Water Conserv. 56 : 152 – 159 .
Truman C.C and Nuti R.C 2010 Furrow diking in conservation tillage Agric. Water Manage. 97 : 835 – 840 .
Truman C.C Shaw J.N and Reeves D.W 2005 Tillage effects on rainfall partitioning and sediment yield from an Ultisol in central Alabama J. Soil Water Conserv. 60 : 89 – 98 .
Truman C.C Strickland T.C Potter T.L Franklin D.H and Bosch D.D 2007 Variable rainfall intensity and tillage effects on runoff, sediment, and carbon losses from a loamy sand under simulated rainfall J. Environ. Qual. 36 : 1495 – 1502 .
Truman C.C Potter T.L Nuti R.C Franklin D.H and Bosch D.D 2011 Antecedent water content effects on runoff and sediment yields from two Coastal Plain Ultisols Agric. Water Manage. 98 : 1189 – 1196 .
Notes
- Dr. Clint Truman is a Research Soil Scientist with USDA-ARS, Southeast Watershed Research Laboratory, Tifton, GA 31793; Dr. Thomas Potter is a Research Chemist with USDA-ARS, Southeast Watershed Research Laboratory, Tifton, GA 31793
- When research was conducted, Dr. Russell Nuti was a Research Agronomist with USDA-ARS, National Peanut Research Laboratory, Dawson, GA 39842. As of 25 July, 2011, Dr. Nuti is employed by Dow AgroSciences *Corresponding author email: Clint.Truman@ars.usda.gov
Author Affiliations