

Introduction
Peanut (Arachis hypogaea) growers in Nicaragua routinely use seeding rates much higher than the 19.7 seeds/m which are currently recommended in the southeast United States where seeding rate is an important component of an integrated pest management system to suppress epidemics of tomato spotted wilt virus (TSWV) (Brown et al., 2005; Culbreath et al., 2003). Peanut growers in the southeast United States used to plant less seed, but had to increase seeding rates in recent years to reduce risks of TSWV following observations of elevated disease incidence associated with poor stands (Black et al., 2001; Culbreath et al., 1999). The 2004 University of Georgia TSWV risk index for peanuts shows that corresponding final in-row plant population of less than 10 plants/m has TSWV risk index of 25 points while in-row plant populations greater than 13 plants/m has a lower risk of 5 points (Brown et al., 2005). Growers in Nicaragua do not have access to applied research specifically suited to their production systems and soils. Instead, they have relied on information from other parts of the world, such as the United States. However, TSWV has not been reported in Nicaragua, and the use of lower seeding rates could reduce planting costs and increase profits. The climate and soils of Nicaragua are also different from those in the United States, and optimum plant spacing for disease management and yield need to be determined on site in that country.
Seeding rates and the resulting plant densities have been associated with management strategies of other plant diseases as well. Burdon and Chilvers (1982) found 69 examples from the literature about the effect of plant density on disease incidence, and of those 57% provided evidence for a positive correlation between host density and disease incidence. They added that 85% of the positive correlations related to fungal diseases and, 54% of the negative correlations related to viral diseases. The same authors reported a curvilinear relationship between plant density of garden cress seedlings (Lepidium sativum) and primary foci of damping off caused by Pythium irregulare. Doubling host densities in the lower range of host density resulted in a two-fold increase in infection foci (Burdon and Chilvers, 1975). In tall fescue (Festuca arundinacea) turf, mycelia and necrosis by Rhizoctonia solani AG-1-IA were found to spread more rapidly from inoculation sites in high density canopies (Giesler et al., 1996). Host plants where positive relationships between plant density and the amount of disease have been shown include, but are not limited to, bush beans [Phaseolus vulgaris] (Crandell et al., 1971), potatoes [Solanum tuberosum] (Firman and Allen, 1995), carrot [Daucus carota] (Smith et al., 1988), sunflower [Helianthus annuus] (Schmidt and Da Silva, 1986), and strawberries [Arbutus unedo] (Williams, 1975).
In peanut, yield was negatively associated with an increase in the numbers of stem rot foci (Rodriguez-Kabana et al., 1975). More recently, Sconyers et al. (2005) found that as plant spacing of peanut decreased and plant population increased, incidence of stem rot increased. Extensive spread between plants occurs in other closely spaced crops, and relatively few initial stem rot foci can result in extensive disease and yield losses (Punja, 1985). Stem rot is one of the most important peanut diseases in Nicaragua, where infection by S. rolfsii usually coincides with peg and pod development when peanut branches spread rapidly across the soil. Disease development is favored by warm, moist environmental conditions (Punja and Rahe, 1992). These conditions are prevalent in the peanut production regions of Nicaragua, sometimes starting very early in the growing season.
Flutolanil, a benzanilide fungicide, is registered for use on peanut and one of the most effective fungicides against stem rot (Csinos, 1987). Flutolanil is typically applied twice per season at 0.56–1.20 kg a.i./ha as a foliar spray at approximately 60 days after planting and again 30 days later. However, flutolanil may also be applied as a four mid-season sprays on 14-day intervals (Kemerait et al., 2006). No literature is available on interaction of flutolanil and plant populations as a management strategy for stem rot.
Since there are currently no reports of optimum plant densities for peanut production in Nicaragua, there was a need to evaluate plant spacing and its interaction with stem rot development. The objectives of the study were to determine the effect of plant stand on stem rot incidence and yield, and the optimum plant stand to maximize economic returns to peanut growers with and without damaging levels of stem rot.
Materials and Methods
Location, experimental design, and treatments
Experiments were conducted at different locations in Nicaragua during the 2005 and 2006 growing seasons. All fields were naturally infested with stem rot. The fields had been monocultured with peanut for at least five years and had a history of stem rot incidence in previous peanut crops. All locations were in western Nicaragua with loamy-sand soils of volcanic origin (Joergensen and Castillo, 2001) and well adapted for peanut production. Locations were grouped by levels of stem rot incidence as high (more than 20% infestation at Sta. Cecilia), moderate (5 to 20% infestation at El Hormiguero), and low (less than 5% infestation at El Viejo, Rancheria, Aguas Calientes, San Patricio, and La Leona).
The selected fields were plowed and disk harrowed three times before planting. Georgia Green (Branch, 1996) is the standard peanut cultivar in Nicaragua and it was planted mechanically during the first two weeks of June each year at all locations. Each plot was a single bed with two twin rows. The row spacing was 1.09 m between the outside rows and 0.74 m between the inside rows. Plots were 10-m long and blocks were separated by a 3-m fallow alley. The experimental design was a split-plot and treatments were replicated five times. The whole-plot treatments were plant stands and the sub-plot treatments were fungicide sprays for stem rot control.
All plots were planted uniformly with a high seeding rate (of more than 30 seeds/m) in both rows in each pair of twin rows. About three weeks after planting, the number of plants per meter at each of ten arbitrarily chosen sites in the plot area was counted. Then, each plot was thinned by hand to the appropriate number of plants, leaving the maximum distance between remaining plants. Final plant stands ranged from 4 to 30 plants/m. Fungicide treatments were flutolanil (Moncut 70 WP, Nichino America, Inc., Wilmington, DE) at 1.2 kg a.i./ha and nonsprayed control. Flutolanil was applied at pegging (50 to 60 DAP) and pod development (80 to 90 DAP) with the CO2-pressurized backpack sprayer calibrated to apply 189 L/ha at 214 kPa. There were four flat-fan (XR Teejet) 11004 spray nozzles spaced 45.7 cm apart (Spraying Systems Co., Wheaton, IL).
All plots were established and maintained under uniform production practices, including broadcast sprays of chlorothalonil to control foliar diseases and prevent defoliation. Chlorothalonil has no activity on stem rot (Culbreath et al., 1995) while flutolanil has no activity on leaf spots (Culbreath et al., 1992) and has minimal effect on peanut rust (Hagan, 2002).
Stem rot assessment
Data for disease incidence were collected within a day after digging and inverting. Stem rot was assessed using the modified method of Rodriguez-Kabana et al. (1975) by counting the number of disease foci in a plot. A stem rot focus consisted of one or more consecutive affected plants in a 30-cm section, or less, of row. Distinctive symptoms and signs of infection included wilted and dead stems or entire plants, often with white fungal mycelium and light to dark brown sclerotia on the basal stems. Stem rot incidence for each plot was determined as:
Yield assessment
Plots were mechanically dug and inverted about 130 to 140 DAP. Windrows were mechanically harvested with a two-row combine approximately five days after digging. The final pod moisture content after air-drying was approximately 8%. Weight of pods was recorded after soil and foreign materials were removed.
Economics
Optimum plant stands were determined for disease control and yield, and maximum economic return by determining gross income adjusted for seed cost since all other costs would have been similar. The cost of each planting density was weighted against the crop value based on yield and price. The gross income adjusted for seed cost was employed as criteria to determine the optimum plant stands for each growing season and at each location. The gross income adjusted for seed cost was determined as the difference between crop value and seed cost. Baldwin (2005) has described the determination of seeding rates for runner peanuts such as the cultivar Georgia Green planted in these experiments as follows:
The average seed count per pound of Georgia Green is 825 based upon sound mature kernels. The row length required for one acre with the row spacing used in this experiment was 14520 feet (Baldwin, 2005). After unit measure conversions, gross income adjusted for seed cost for each plant stand was determined as:
Statistical analysis
All data were tested for normality and homogeneity of variance prior to analysis of variance. The Mixed Procedure (PROC MIXED) of the Statistical Analysis Systems (SAS Institute, version 9.1, Cary, NC) was then used to analyze variation of stem rot incidence, yield, and gross income adjusted for seed cost in response to plant stand and fungicide effects. The PROC MIXED was used to provide the correct error terms for the plant stand, fungicide, and interaction of the two treatments in the split-plot design. The SATTERTH option in the MODEL statement was included to calculate degree of freedom by the Satterthwaite procedure. The Protected LSD (P ≤ 0.05) was used for mean separations among treatments. Different regression (i.e. polynomial and sigmoidal) models were used to fit data on stem rot incidence, yield, and gross income adjusted for seed cost over plant stand with or without flutolanil application in locations with high, moderate, or low disease prevalence. The best fitted regression models for yield and gross income adjusted for seed cost were then used to determine the plant stands giving maximum yield and economic return in fields with low, moderate or high incidence of stem rot.
Results
The interactions of year × location × plant stand × fungicide (P = 0.0091) and location × plant stand × fungicide (P < 0.0001) on stem rot were significant. However, the year × plant stand × fungicide interaction was not significant (P = 0.0937) for stem rot incidence. At locations with low disease levels, there was no effect of flutolanil on yield, so yield and gross income adjusted for seed cost were combined for both flutolanil-treated and non-treated plots for each plant stand.
Locations with high stem rot incidence
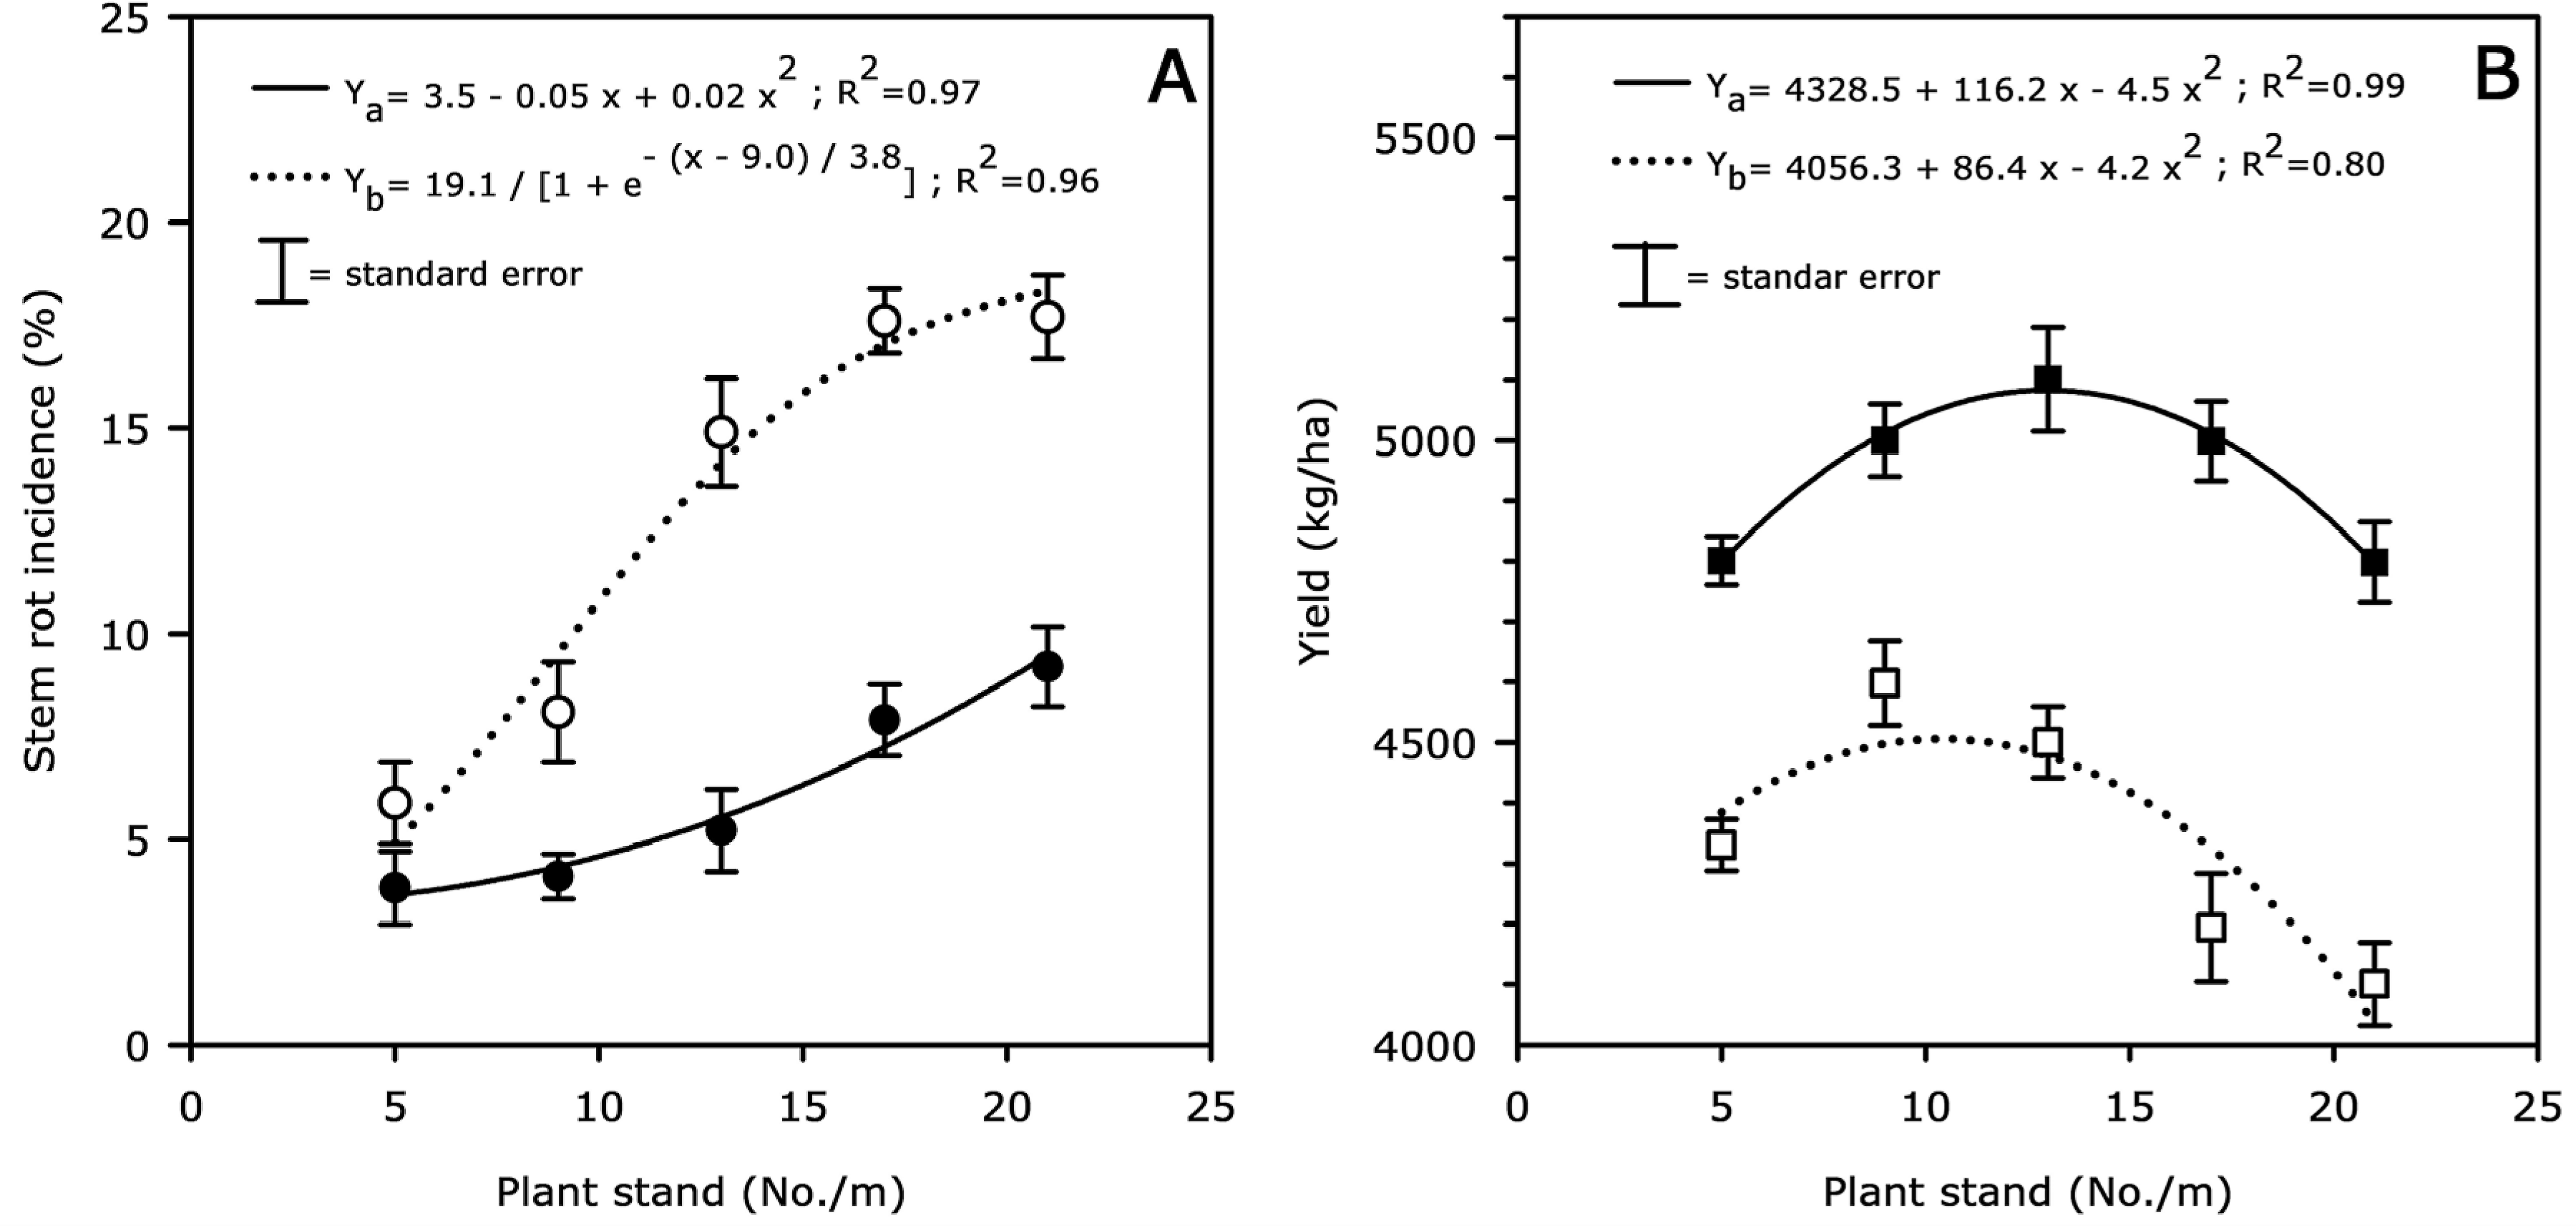
At Sta. Cecilia (Chinandega, Nicaragua), stem rot incidence over plant stand was best fit to a sigmoidal model (R2 = 0.92) in non-treated plots and to a quadratic model (R2 = 0.96) in flutolanil-treated plots (Fig. 1, A ). Stem rot incidence increased with increasing plant stand (from 5 to 17 plants/m) for both flutolanil-treated and non-treated plots. Average disease incidence was three times less in plots sprayed with flutolanil than in plots not sprayed with flutolanil. Non-treated plots had 15% and 38% stem rot incidence at in-row populations of 5 and 17 plants/m, respectively, whereas plots sprayed with flutolanil had only 2% and 17%, respectively.
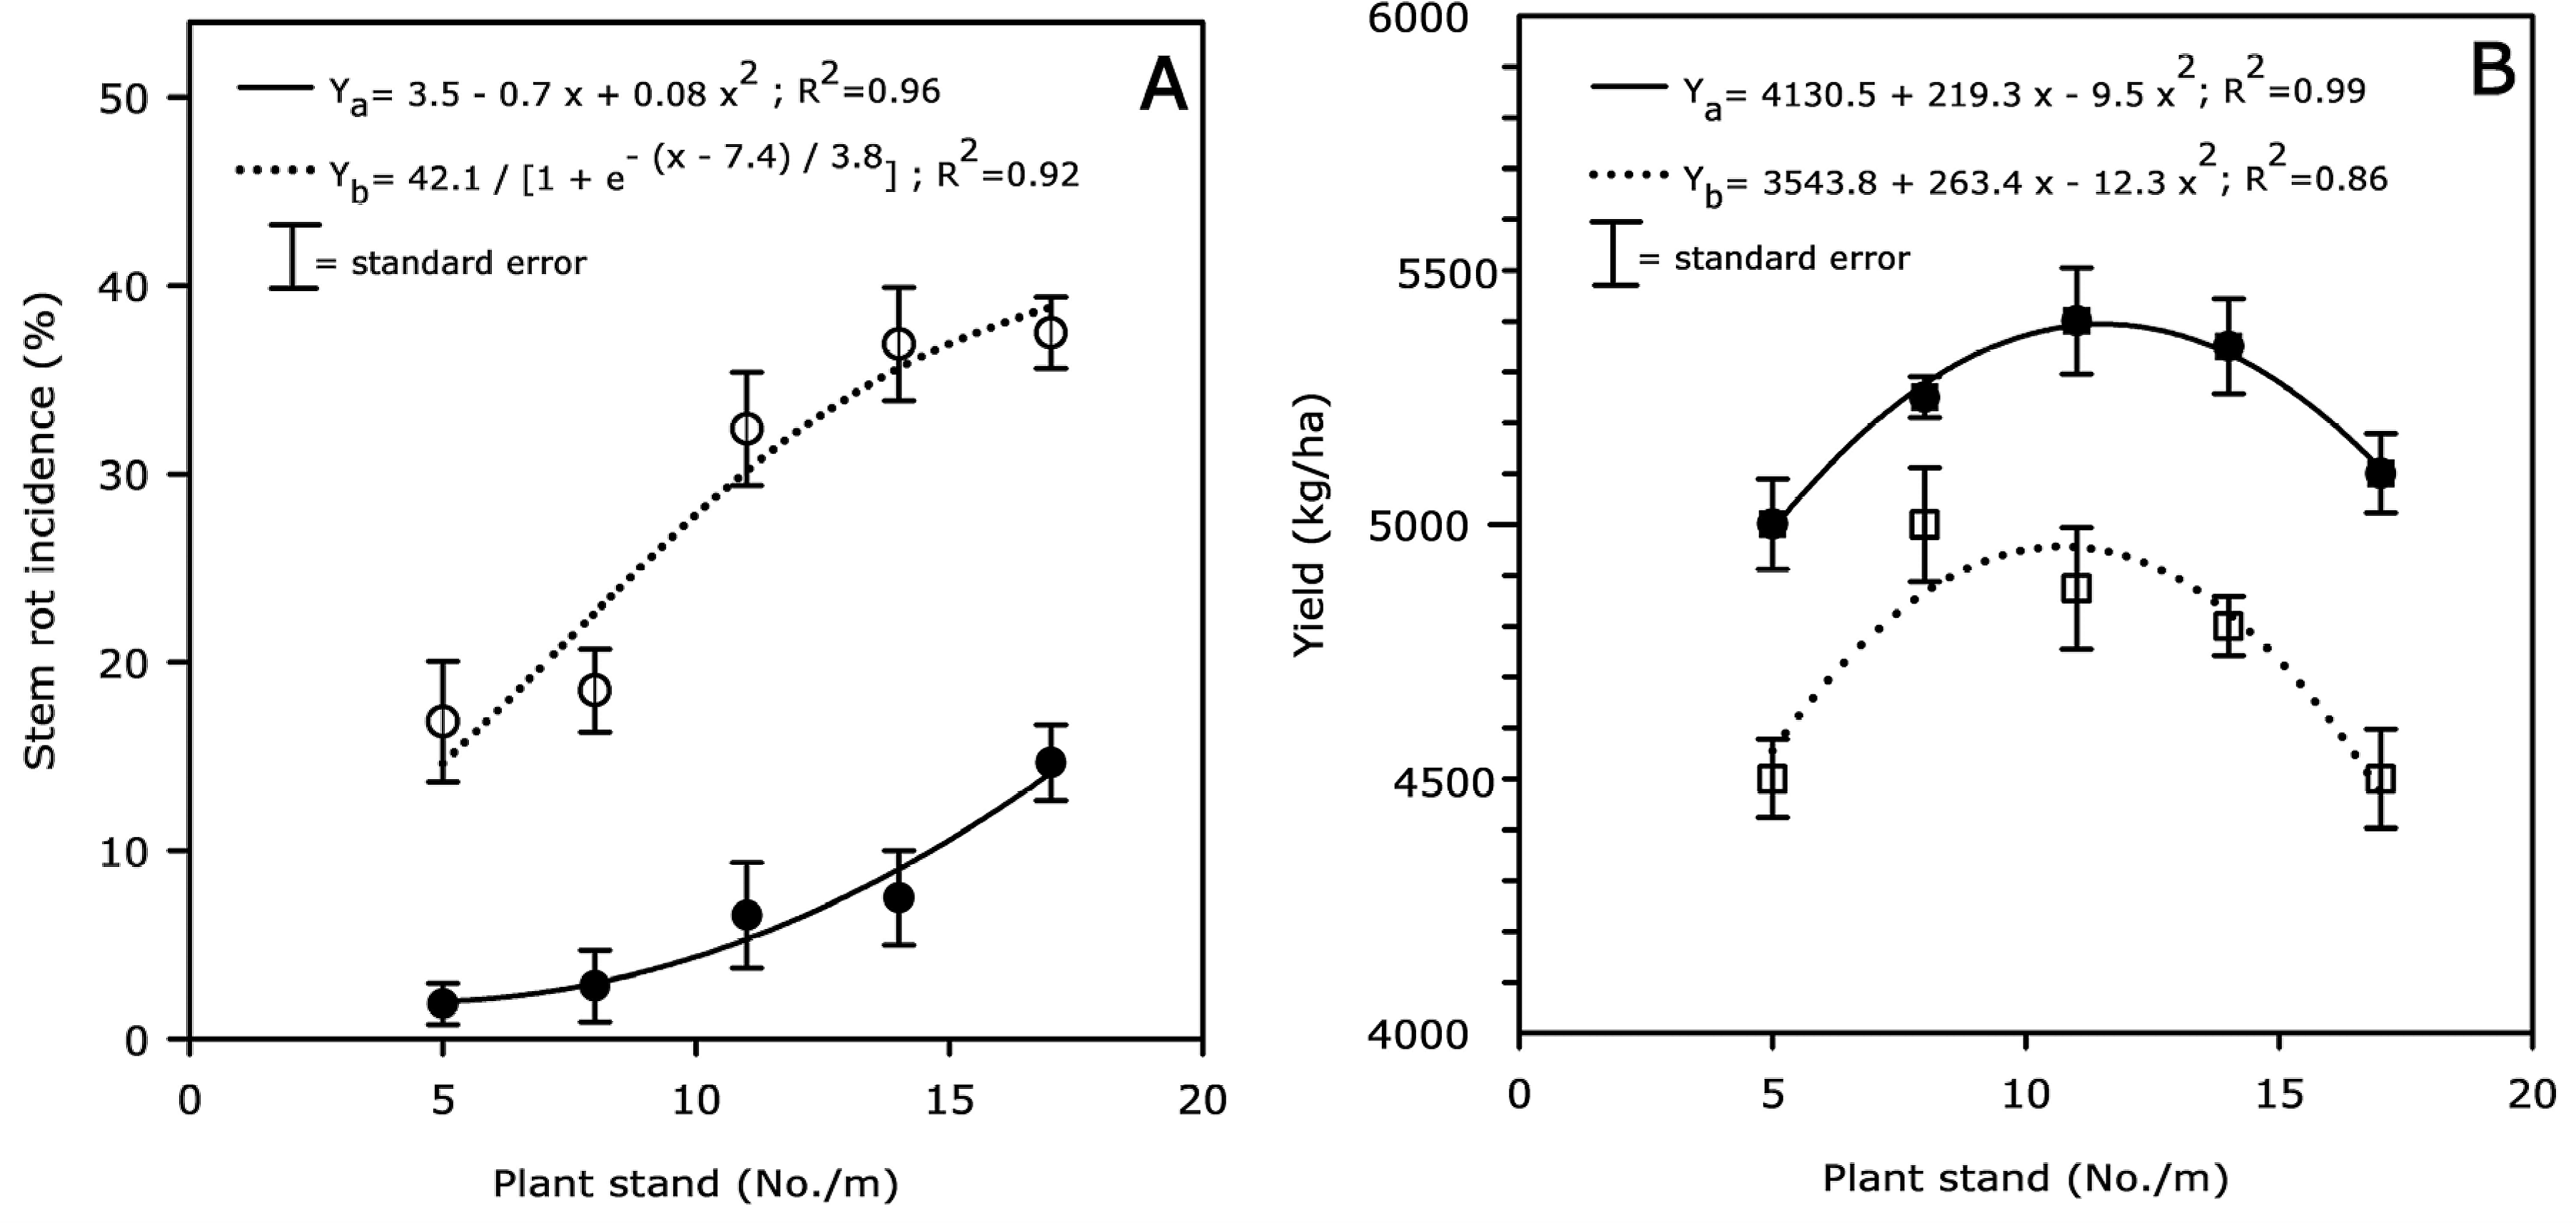
Effect of plant stand (x) on stem rot incidence (A) and peanut yield (B) in fields with high level of stem rot infestation at Sta. Cecilia (Chinandega, Nicaragua). All plots were treated for foliar diseases, and some were sprayed (•–• stem rot; ▪–▪ yield) or not sprayed (○…○ stem rot; □…□ yield) with flutolanil (1.2 kg a.i./ha at 60 and 90 days after planting) to control stem rot. Data points are averages over replication and year (N = 10). Stem rot incidence versus plant stand was best fit to quadratic and sigmoidal models in flutolanil-treated (Ya) and non-treated (Yb) plots, respectively. Yield over plant stand was best fit to a quadratic model for both flutolanil-treated (Ya) and non-treated (Yb) plots.
Peanut yield over plant stand was best fit to a quadratic model for both non-treated (R2 = 0.86) and flutolanil-treated (R2 = 0.99) plots (Fig. 1, B ). Maximum yields were obtained at in-row populations of 12 and 11 plants/m when treated or not treated with flutolanil, respectively. Yields declined sharply when plant populations exceeded these levels regardless of flutolanil application (Fig. 1, A and B ).
Gross income adjusted for seed cost versus plant stand for both flutolanil-treated and non-treated plots was best fit to a quadratic model (R2 = 0.99 and R2 = 0.88, respectively). Maximum gross income adjusted for seed cost was attained at an in-row population of 11 plants/m ($1889/ha) in plots receiving flutolanil for stem rot control and at an in-row population of 10 plants/m ($1735/ha) in plots not treated with flutolanil (Fig. 2).
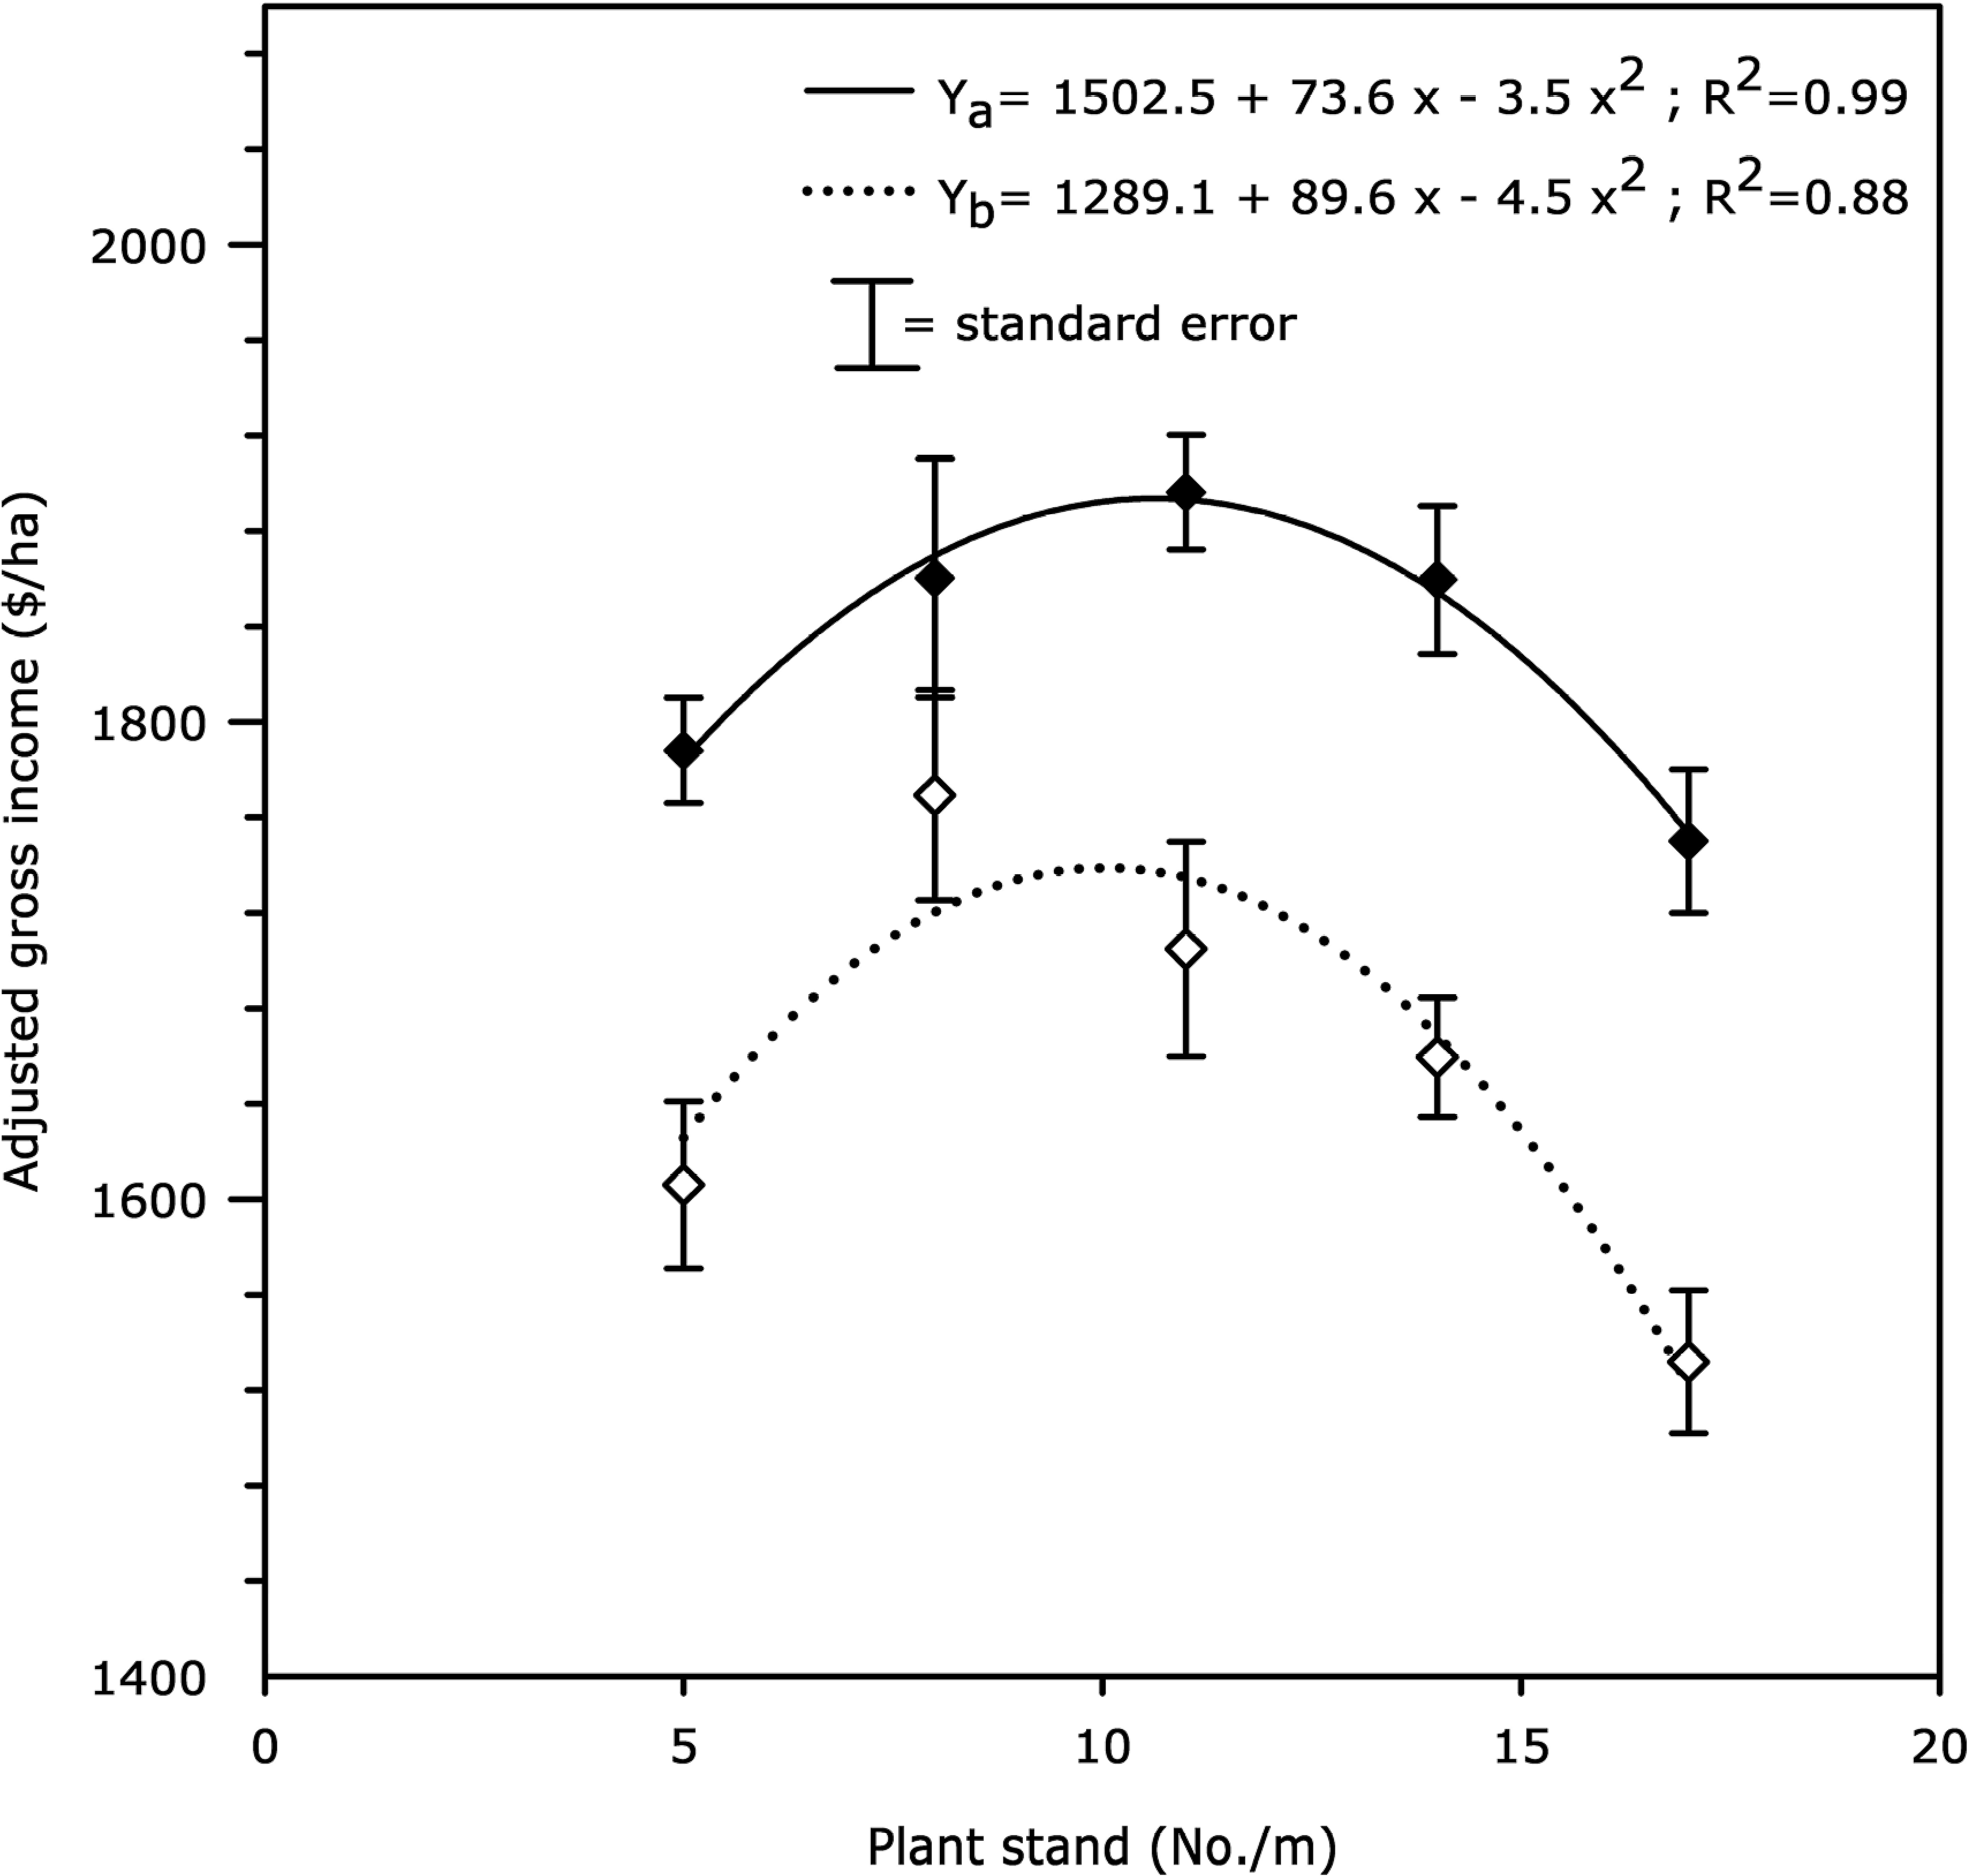
Effect of plant stand (x) on gross income adjusted for seed cost for plots either sprayed (♦–♦) or not sprayed (◊…◊) with flutolanil (1.2 kg a.i./ha at 60 and 90 days after planting) in fields with a high level of stem rot infestation at Sta. Cecilia (Chinandega, Nicaragua) during 2005–2006 seasons. Data points are averages over replication and year (N = 10). Gross income adjusted for seed cost versus plant stand was best fit to a quadratic model for both flutolanil-treated (Ya) and non-treated (Yb) plots.
Locations with moderate stem rot incidence
At El Hermiguero (Leon, Nicaragua), stem rot incidence over plant stand was best fit to sigmoidal (R2 = 0.96) and quadratic (R2 = 0.97) models in non-treated and flutolanil-treated plots, respectively (Fig. 3, A ). Stem rot incidence was 6% at in-row population of 5 plants/m and 18% at in-row population of 21 plants/m in plots not treated with flutolanil. In flutolanil-treated plots, the lowest stem rot incidence was 4% (at in-row population of 5 plants/m) and the highest was 9% (at in-row population of 21 plants/m). In both flutolanil-treated and non-treated plots, there was increased stem rot incidence with increasing plant stand density.
Effect of plant stand (x) on stem rot incidence (A) and yield (B) in fields with moderate level of stem rot infestation at El Hormiguero (Leon, Nicaragua). Plots were either sprayed (•–• stem rot; ▪–▪ yield) or not sprayed (○…○ stem rot; □…□ yield) with flutolanil (1.2 kg a.i./ha at 60 and 90 days after planting) to control stem rot. Data points are averages over replication and year (N = 10). Stem rot incidence over plant stand was best fit to quadratic and sigmoidal models in flutolanil-treated (Ya) and non-treated (Yb) plots, respectively. Yield over plant stand was best fit to a quadratic model for both flutolanil-treated (Ya) and non-treated (Yb) plots.
Yield over plant stand was best fit to a quadratic model for both flutolanil-treated (R2 = 0.99) and non-treated (R2 = 0.80) plots (Fig. 3, B ). Maximum yields were obtained at 13 and 10 plants/m in these plots when treated or not treated with flutolanil, respectively. Yields declined sharply when plant populations exceeded these levels, especially in the non-treated plots (Fig. 3, A and B ).
Data on gross income adjusted for seed cost versus plant stand best fit a quadratic model for both flutolanil-treated (R2 = 0.99) and non-treated plots (R2 = 0.93). The gross income adjusted for seed cost was maximized at in-row population of 11 plants/m ($1778/ha) in flutolanil-treated plots, and at in-row population of 8 plants/m ($1585/ha) in plots not receiving flutolanil (Fig. 4).
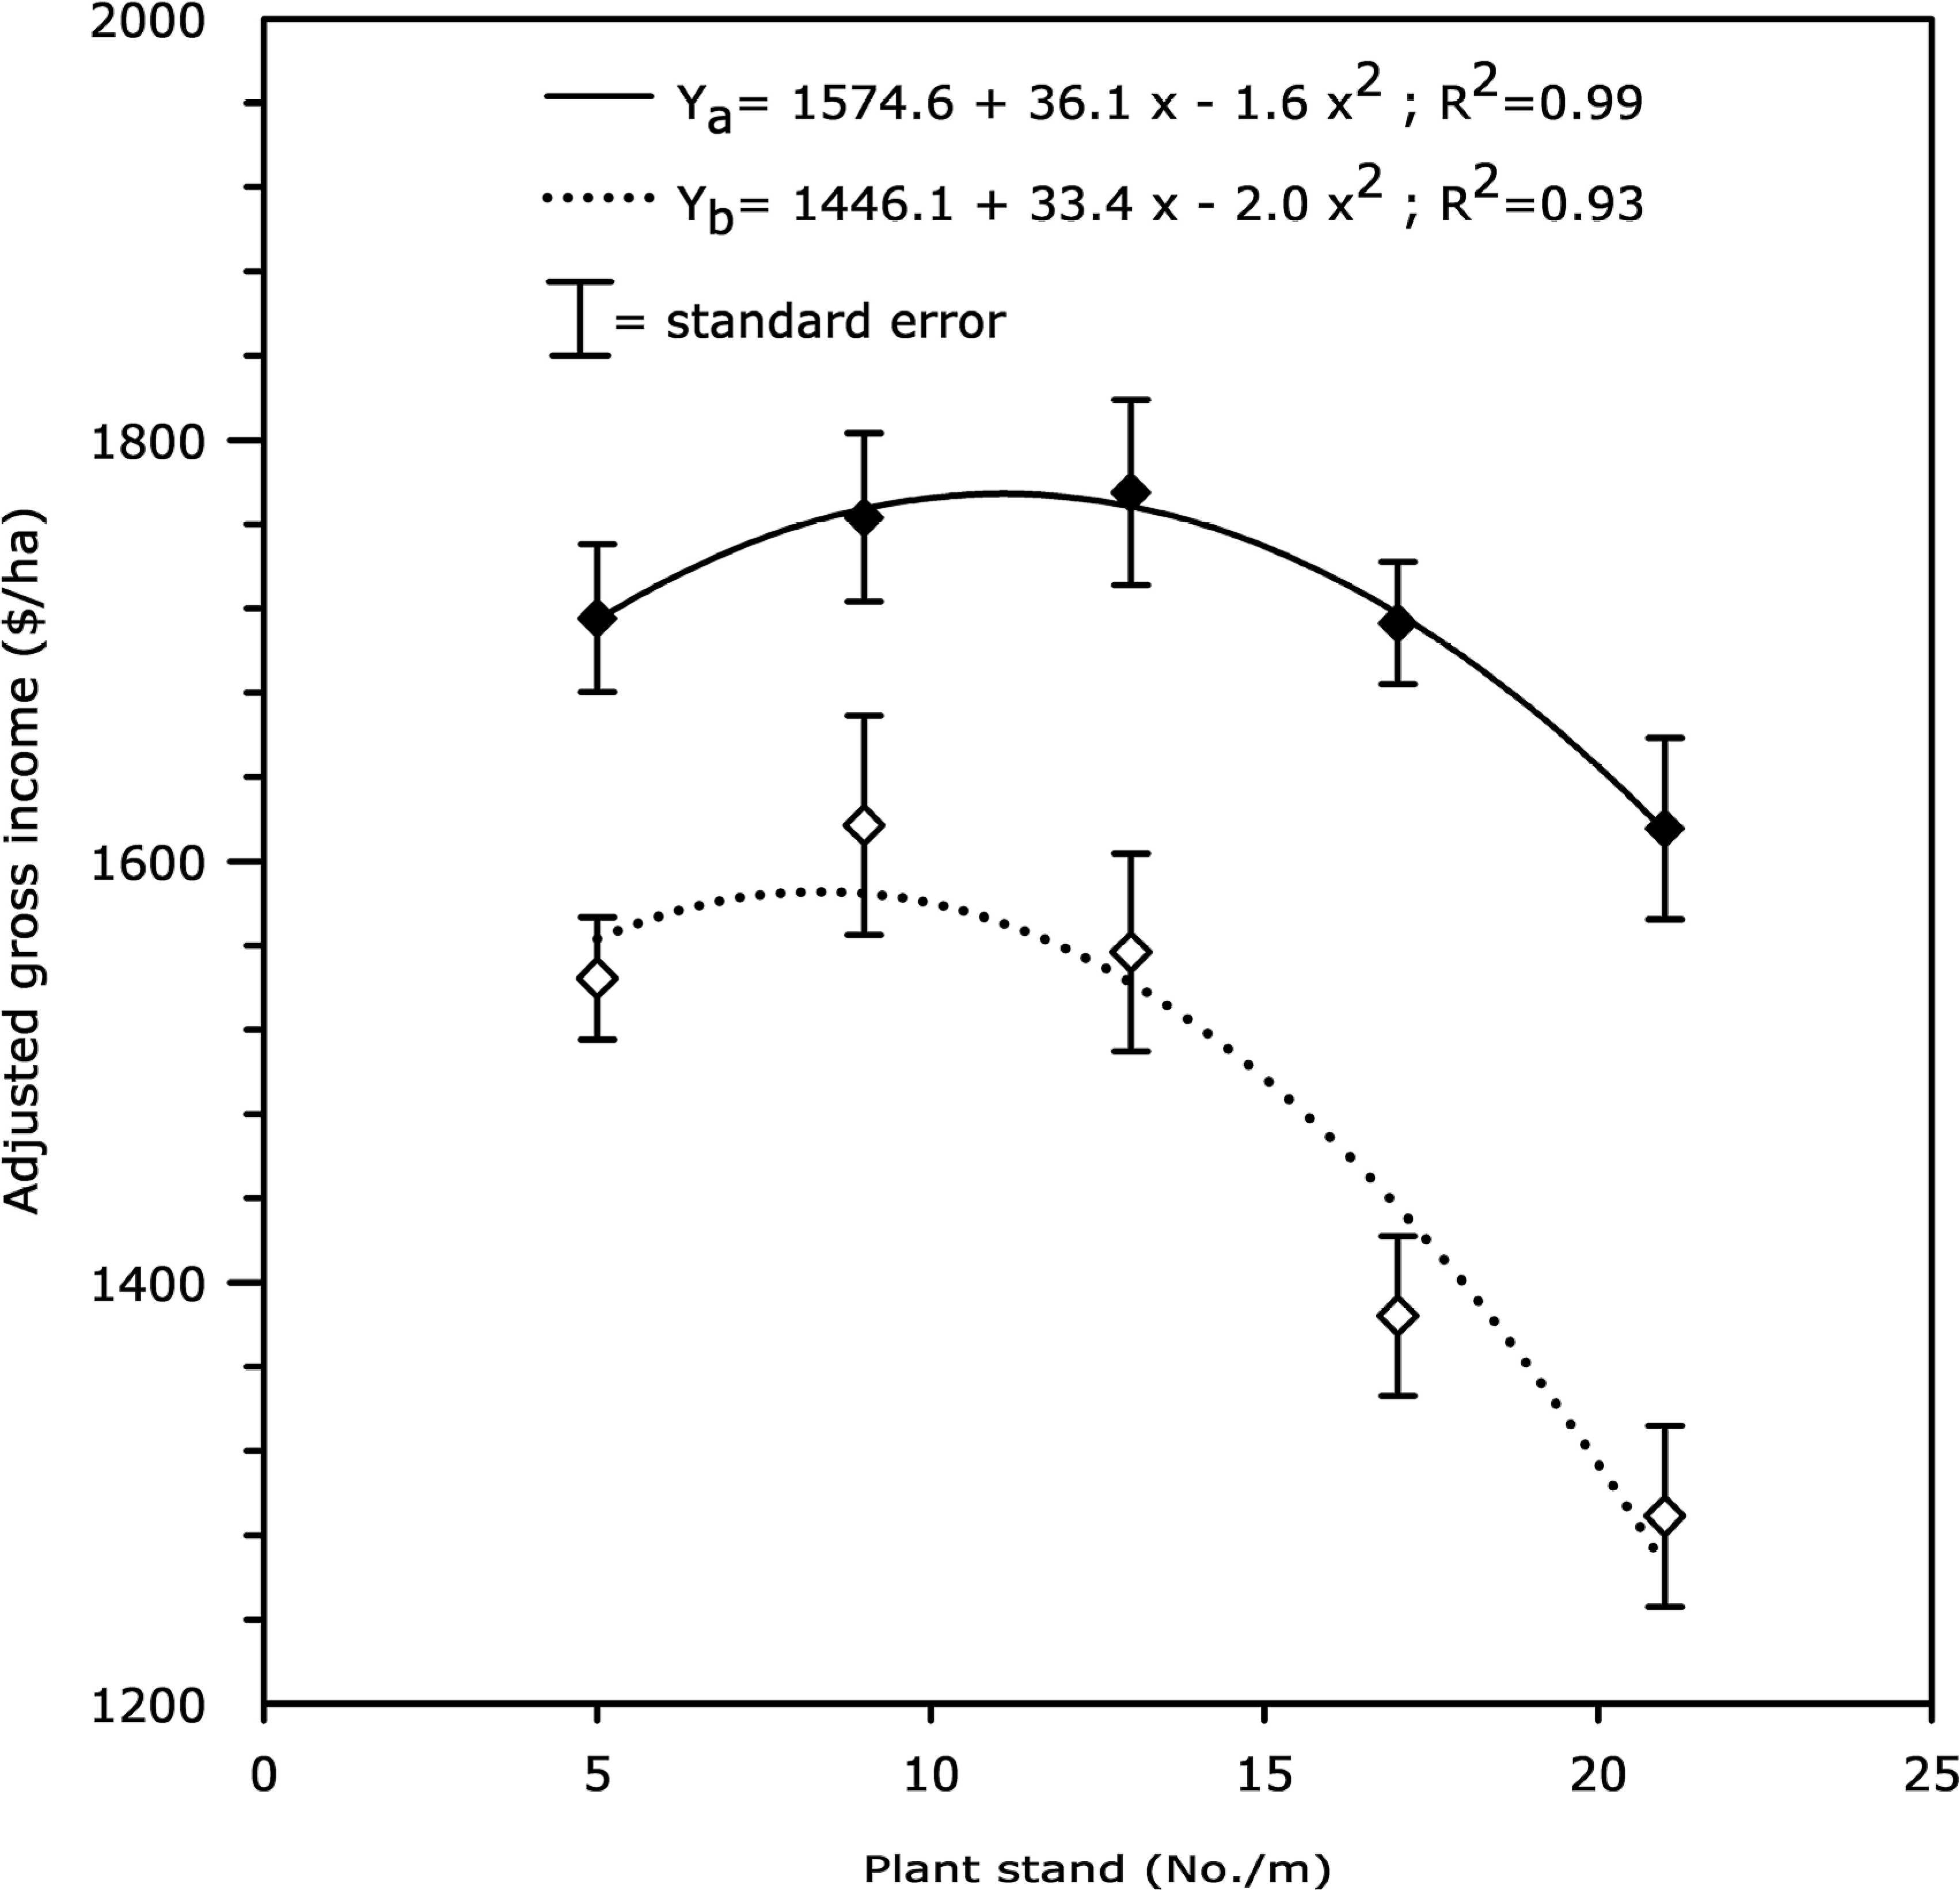
Effect of plant stand (x) on gross income adjusted for seed cost for plots either sprayed (♦–♦) or not sprayed (◊…◊) with flutolanil (1.2 kg a.i./ha at 60 and 90 days after planting) in fields with moderate level of stem rot infestation at El Hormiguero (Leon, Nicaragua) during 2005–2006 seasons. Data points are averages over replication and year (N = 10). Gross income adjusted for seed cost versus plant stand was best fit to a quadratic model for both flutolanil-treated (Ya) and non-treated (Yb) plots.
Locations with low stem rot incidence
In Rancheria, El Viejo and Aguas Calientes (Chinandega), and La Leona and San Patricio (Leon), the level of stem rot incidence was low (3% average) even in plots not sprayed with flutolanil. Data across locations and years and, in plots treated or not treated with flutolanil were combined for assessing the effects of plant stand on yield and gross income adjusted for seed cost. Data on yield and gross income adjusted for seed cost versus plant stand both fit quadratic models (R2 = 0.79 and R2 = 0.82, respectively). The maximum yield (5195 kg/ha) and gross income adjusted for seed cost ($1811/ha) were obtained at in-row populations of 13 and 12 plants/m, respectively (Fig. 5).
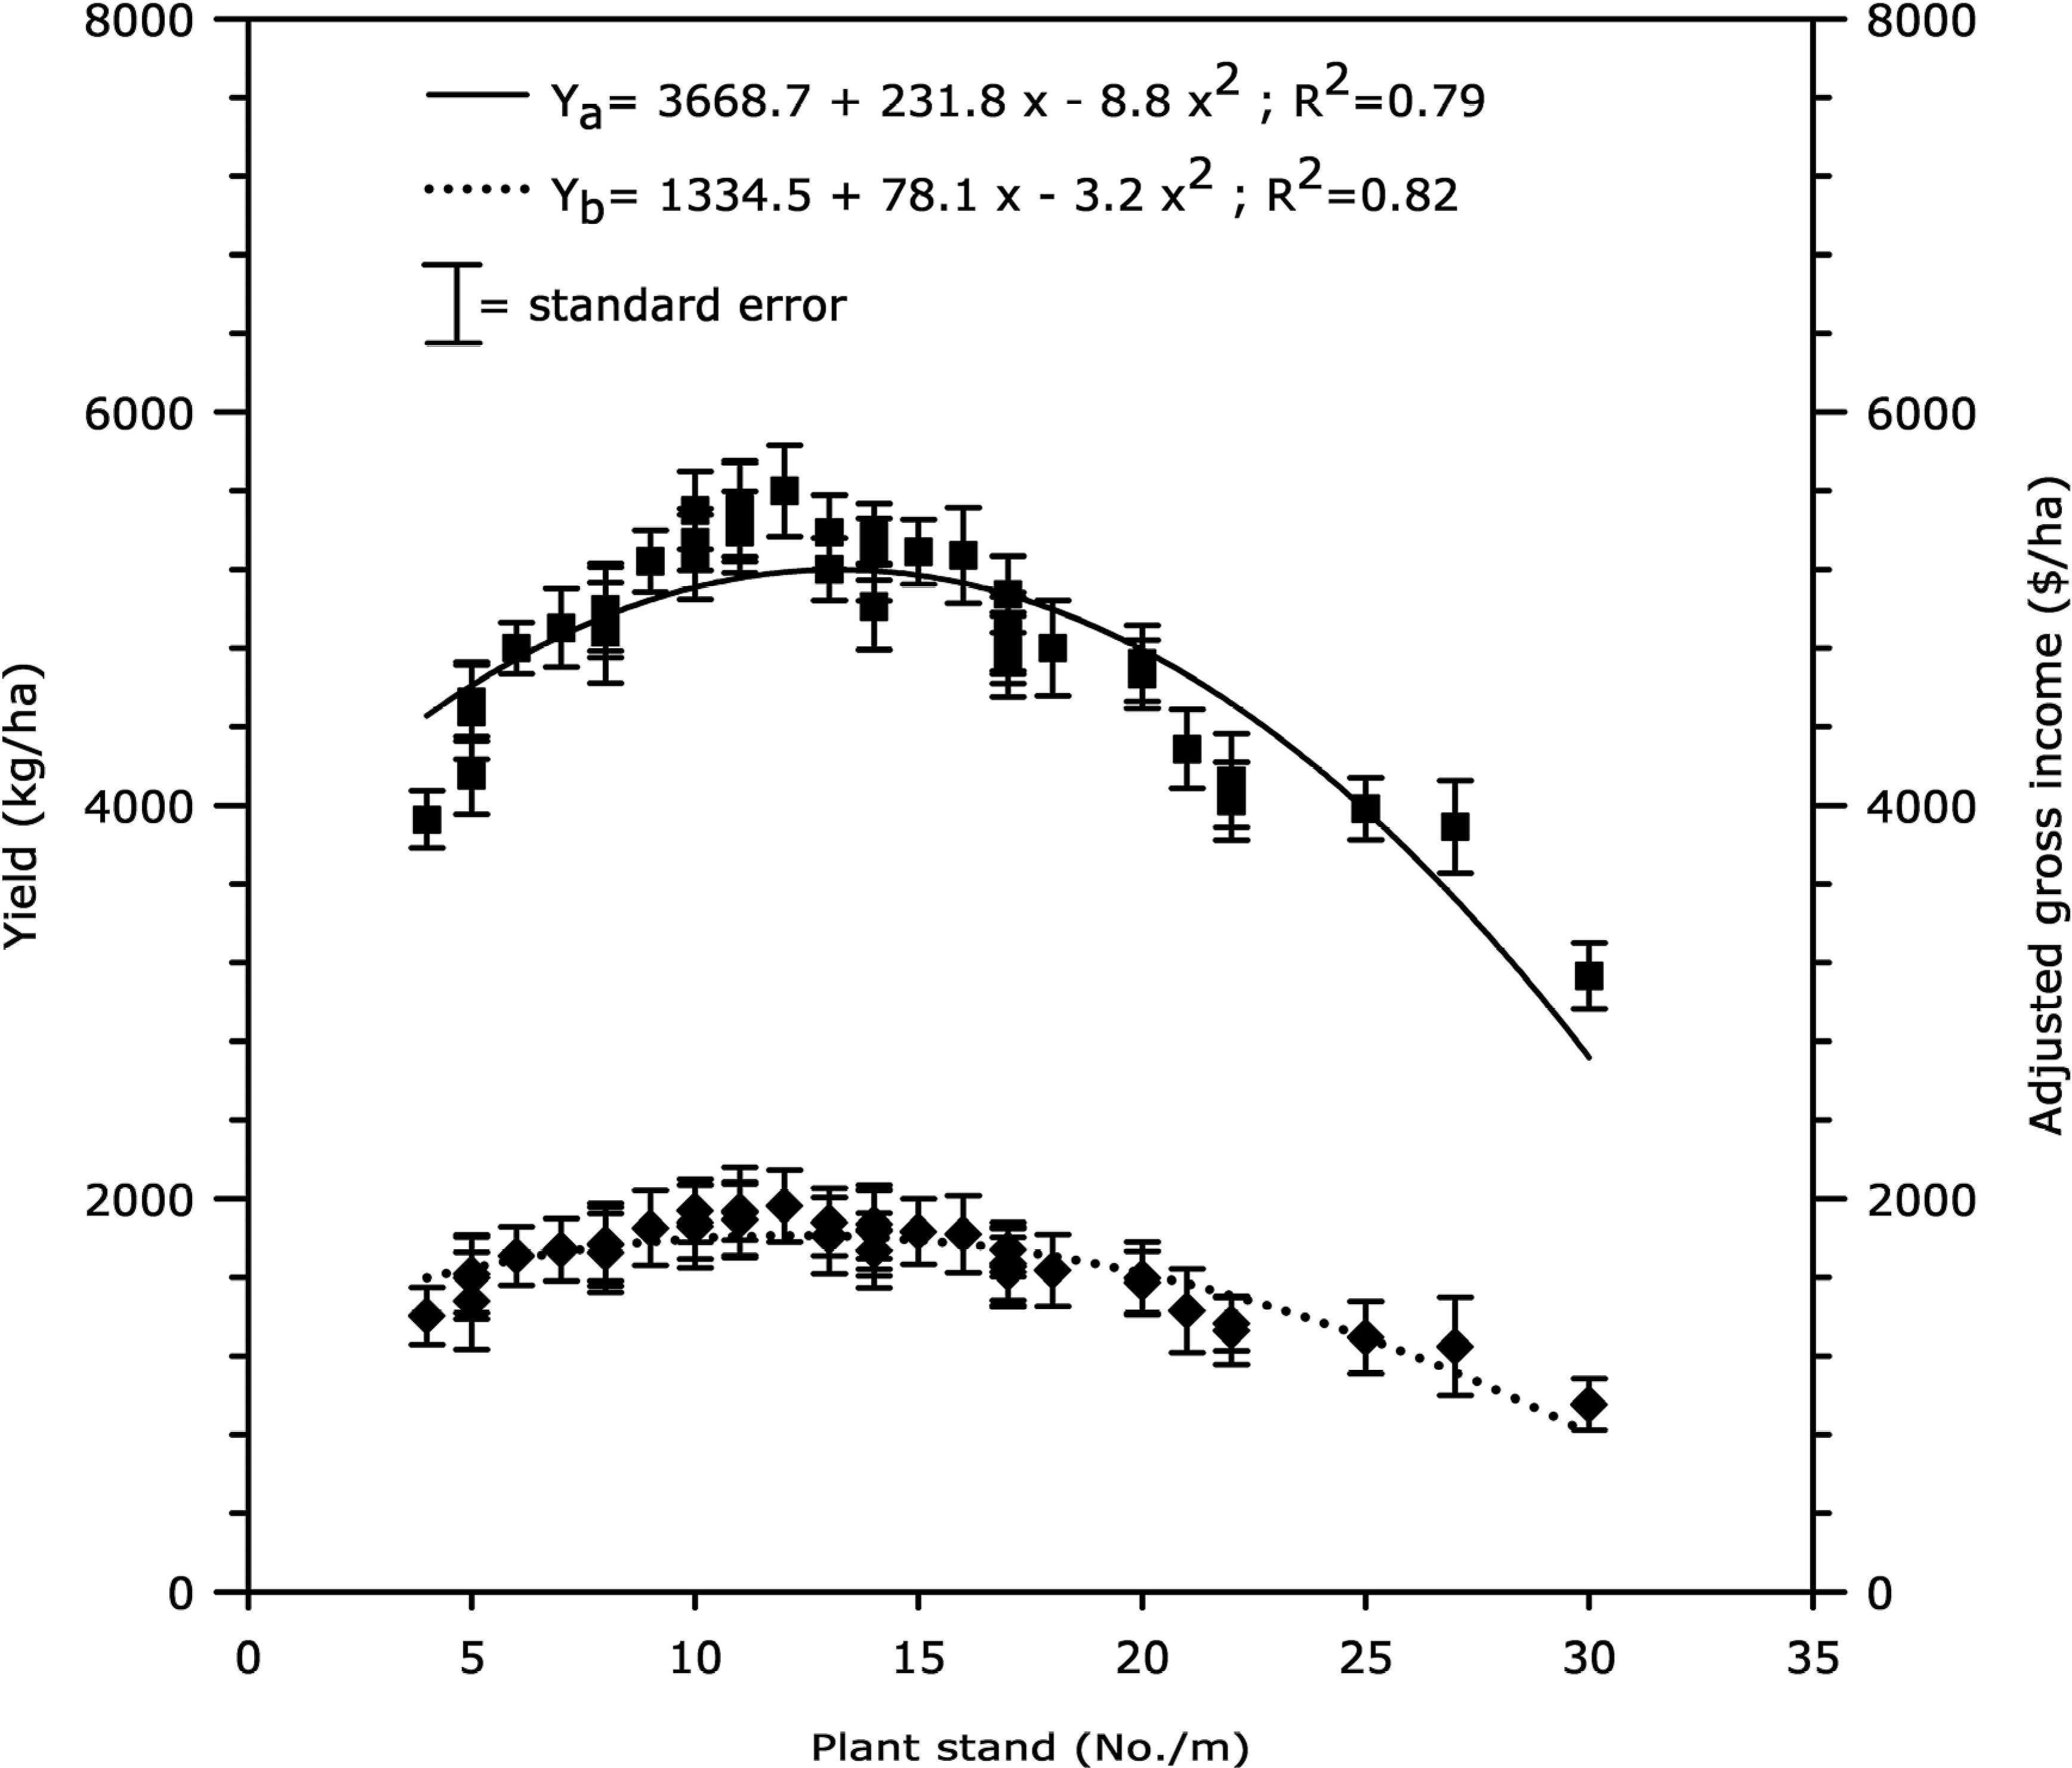
Effect of plant stand (x) on peanut yield (▪–▪) and gross income adjusted for seed cost (♦…♦) in seven fields with low level of stem rot infestation during 2005–2006 seasons. Data points are averages over location, flutolanil-treated and non-treated plots, replication and year (N = 40). Yield (Ya) and gross income adjusted for seed cost (Yb) versus plant stand were best fit to a quadratic model.
Discussion
The diverse peanut production areas of Nicaragua provided an opportunity to evaluate the effect of plant stand on disease control, yield, and gross income adjusted for seed cost in locations where stem rot prevalence was either high, moderate, or low. Stem rot levels were defined based on their potential impact on yield. Rodriguez-Kabana et al. (1975) found a negative correlation of stem rot incidence (foci/33m row) and peanut yield. However, the slope varied across locations and years and was influenced by cultural practices and rainfall. In Nicaragua, there was no clear separation of fields with different levels of stem rot infestation based upon agroclimatic conditions or history of cultural practices. Two or more fields with different levels of stem rot infestation were within the same location range of precipitation pattern and level or soil type (Augusto et al., 2010). In addition, all fields had been monocultured with peanuts for at least five years.
In locations with either high or moderate levels of stem rot, disease incidence clearly increased with increasing plant stand in plots either not treated or treated with flutolanil. Sconyers et al. (2005) found a similar positive correlation between stem rot incidence and plant stand densities in peanut, and attributed this to increased plant-to-plant mycelial spread occurring irrespective of the number of inoculum sources within the row. Our observations support that theory.
Yield initially increased with increasing plant stand and then decreased at higher plant stand. Bell et al. (1991) found that Virginia-type cultivars showed no responses to increased density above 88,000 plants/ha, while maximum yield of a spanish-type cultivar was recorded at 352,000 plants/ha. With runner peanuts in Georgia, growers often plant 19.7 seeds/m seeking to obtain a final density of 13 plants/m or 142,500 plants/ha to reduce risk of TSWV (Baldwin, 2005). Sconyers et al. (2005) found that a within row population of 13 plants/m had extensive spread of stem rot on the Georgia Green cultivar in microplot experiments. Stands of 3 plants/m had negligible disease spread while 5 to 10 plants/m were intermediate. In our experiments, yield and gross income adjusted for seed cost were clearly affected by the incidence of stem rot. In fields where disease incidence was naturally low or the disease was controlled by flutolanil, the maximum yields were obtained at within row populations of 12 to 13 plants/m (128,250 to 138,938 plants/m), and maximum gross income adjusted for seed cost was attained at within row populations of 11 to 12 plants/m (117,563 to 128,250 plants/ha). However, in fields with moderate to high stem rot incidence where flutolanil was not used, the maximum yield and gross income adjusted for seed cost were obtained at lower plant stand densities of 10 to 11 plants/m (106,875 to 117,563 plants/ha) and 8 to 10 plants/m (85,500 to 106,875 plants/ha), respectively. These results suggest that the presence of damaging levels of stem rot can influence the plant densities needed to obtain maximize economic returns. In fields with moderate or high stem rot incidence, the optimum gross income adjusted for seed cost is attained at reduced plant stands since less disease occurs and less cost is incurred due to lower seeding rates. Conversely, in fields with low stem rot prevalence, the optimum gross income adjusted for seed cost is obtained from somewhat higher plant stands, even though more seed are required. In either case, plant stands producing the optimum gross income adjusted for seed cost in this study were lower than those currently used by Nicaraguan peanut growers (often planting more than 20 seeds/m), and usually lower than the 13 plants/m (planted at 19.7 seeds/m) currently recommended to peanut growers in Georgia (Baldwin, 2005).
Overall results from this study suggest that growers in Nicaragua can increase their gross income by using lower seeding rates. One problem is that the quality of peanut seed used in Nicaragua is often low, so growers often seed at higher rates to insure adequate stand establishment. Access to better quality seed, and therefore more predictable stands, would enable them to better utilize these findings. Another problem is the lack of rotation with other crops and therefore high levels of soilborne diseases in some fields. Those situations will require use of additional fungicides, and if stem rot cannot be adequately controlled, use of lower planting densities could compromise yield. It should also be noted these conclusions apply specifically to the cultivar Georgia Green. As other cultivars are introduced, the relationship between plant stand and disease incidence, yield, or adjusted gross income could change based on differences in disease resistance or growth habit. Therefore, it is important for growers in Nicaragua to know field history relative to stem rot prevalence as well as characteristics of each cultivar grown, and then plan seeding rates and fungicide programs accordingly.
Acknowledgements
The authors would like to thank Diego Jerez and Mario Hurtado for maintaining field plots. Funding for the research was provided by the Association of Peanut Growers of Nicaragua.
Literature Cited
Augusto J. , Brenneman T. B. , and Csinos A. S. 2010 Etiology of peanut pod rot in Nicaragua: II. The role of Pythium myriotylum as defined by applications of gypsum and fungicides. Online. Plant Health Progress doi:10.1094/PHP-2010-0215-02-RS.
Baldwin J. 2005 Seeding rate, row patterns and planting dates. pp. 6 – 9 in: 2005 peanut update, Prostko E. (ed.) Coop. Ext. Serv University of Georgia Athens .
Bell M. J. , Harch G. , and Wright G. C. 1991 Plant population studies on peanut (Arachis hypogaea L.) in subtropical Australia 1. Growth under fully irrigated conditions. Aus. J. Exper. Agric 31 : 535 – 543 .
Black M. C. , Tewolde H. , Fernandez C. J. , and Schubert A. M. 2001 Seeding rate, irrigation, and cultivar effects on tomato spotted wilt, rust, and southern blight diseases of peanut. Peanut Sci 28 : 1 – 4 .
Branch W. D. 1996 Registration of ‘Georgia Green’ peanut. Crop Sci 36 : 806 .
Brown S. L. , Culbreath A. K. , Todd J. W. , Gorbet D. W. , Baldwin J. A. , and Beasley J. P. 2005 Development of a method of risk assessment to facilitate integrated management of spotted wilt of peanut. Plant Dis 89 : 348 – 356 .
Burdon J. J. and Chilvers G. A. 1975 A comparison between host density and inoculum density effects on the frequency of primary infection foci in Pythium-induced damping-off disease. Aust. J. Bot 23 : 899 – 904 .
Burdon J. J. and Chilvers G. A. 1982 Host density as a factor in plant disease ecology. Ann. Rev. Phytopathol 20 : 143 – 166 .
Crandell P. C. , Jensen M. C. , Chamberlin J. D. , and James L. G. 1971 Effect of row width and direction and mist irrigation on the microclimate of bush beans. HortScience 6 : 345 – 347 .
Csinos A. S. 1987 Control of southern stem rot and Rhizoctonia limb rot of peanut with flutolanil. Peanut Sci 14 : 55 – 58 .
Culbreath A. K. , Brenneman T. B. , Bondari K. , Reynolds K. L. , and McLean H. S. 1995 Late leaf spot, southern stem rot, and peanut yield responses to rates of cyproconazole and chlorothalonil applied alone and in combination. Plant Dis 79 : 1121 – 1125 .
Culbreath A. K. , Minton N. A. , Brenneman T. B. , and Mullinix B. G. 1992 Response of Florunner and Southern Runner peanut cultivars to chemical treatments for management of late leaf spot, southern stem rot, and nematodes. Plant Dis 76 : 1199 – 1203 .
Culbreath A. K. , Todd J. W. , and Brown S. L. 2003 Epidemiology and management of tomato spotted wilt in peanut. Annu. Rev. Phytopathol 41 : 53 – 75 .
Culbreath A. K. , Todd J. W. , Brown S. L. , Baldwin J. A. , and Pappu H. 1999 A genetic and cultural “package” for management of tomato spotted wilt virus in peanut. Biological and Cultural Tests 14 : 1 – 8 .
Firman D. M. and Allen E. J. 1995 Effects of seed size, planting density and planting pattern on the severity of silver scurf (Helminthosporium solani) and black scurf (Rhizoctonia solani) diseases of potatoes. Ann. Appl. Biol 127 : 73 – 85 .
Giesler L. J. , Yuen G. Y. , and Horst G. L. 1996 The microclimate in tall fescue turf as affected by canopy density and its influence on brown patch disease. Plant Dis 80 : 389 – 394 .
Hagan A. 2002 Peanut update for spring 2002. Alabama Coop. Ext. Syst PP-529, Auburn University, Alabama.
Joergensen R. G. and Castillo X. 2001 Interrelationships between microbial and soil properties in young volcanic ash soils of Nicaragua. Soil Biol. Biochem 33 : 1581 – 1589 .
Kemerait B. , Brenneman T. , and Culbreath A. 2006 Peanut disease control. pp. 126 – 127 in: 2006 Georgia Pest Management Handbook. Special Bull. 28. Guillebeau P. (ed.) University of Georgia Coop. Ext. College of Agric. Environ. Sci University of Georgia .
Punja Z. K. 1985 The biology, ecology, and control of Sclerotium rolfsii. Ann. Rev. Phytopathol 23 : 97 – 127 .
Punja Z. K. and Rahe J. E. 1992 Sclerotium. pp. 166 – 170 in: Methods for research on soilborne phytopathogenic fungi Singleton L. L. , Mihail J. D. , and Rush C. M. (eds.) APS Press St. Paul, Minnesota .
Rodriguez-Kabana R. , Backman P. A. , and Williams J. C. 1975 Determination of yield losses to Sclerotium rolfsii in peanut fields. Plant Dis. Rep 59 : 855 – 858 .
Schmidt E. and Da Silva P. R. F. 1986 Effects of density and arrangement of plants of sunflower. 2. Agronomic characteristics and interception of solar radiation. Pesq. Agropec. Bras 21 : 853 – 863 .
Sconyers L. E. , Brenneman T. B. , Stevenson K. L. , and Mullinix B. G. 2005 Effect of plant spacing, inoculation date, and peanut cultivar on epidemics of peanut stem rot and tomato spotted wilt. Plant Dis 89 : 969 – 974 .
Smith V. L. , Campbell C. L. , Jenkins S. F. , and Benson D. M. 1988 Effects of host density and number of disease foci on epidemics of southern blight of processing carrot. Phytopathology 78 : 595 – 600 .
Williams H. 1975 The effect on Verticillium wilt of strawberries of plant spacing, fertilizer application and defoliation. Plant Pathol 24 : 45 – 47 .
Notes
- Former Graduate Research Assistant and Professor, respectively, Department of Plant Pathology, The University of Georgia, Coastal Plain Experiment Station, P. O. Box 748, Tifton, Georgia 31793-0748. [^]
- Professor Emeritus, Department of Agronomy, University of Florida, 304 Newell Hall, P. O. Box 110500, Gainesville, Florida 32611-0500. [^]
- Associate Professor and Extension Economist, Department of Agricultural and Applied Economics, The University of Georgia, Rural Development Center, P. O. Box 1209, Tifton, Georgia 31793-0748. [^] *Corresponding author email: jaugusto@uga.edu
Author Affiliations