

Introduction
United States peanuts are among the highest quality peanuts in the world. Ensuring that quality is maintained during the entire production and marketing chain is a process that begins with sound agronomic production practices followed by curing, storage, processing, and manufacturing processes that maintain or improve quality through the final consumer product. In most commodities, including peanuts, quality is generally quantified by an established grading system designed to make markets work more efficiently by providing information on product quality. The mechanism for improving quality is the series of monetary premiums and discounts assigned for specific grade factors. Grade factors are defined at various points in the U.S. during the marketing channel designed to reflect the quality of the peanuts at the next step of the marketing channel (16,20).
In peanuts, incoming farmer stock is the first point of the grading system and is based on percentages of foreign material, loose shelled kernels, sound mature kernels, sound splits, damaged kernels, other kernels, kernel moisture content, and visual detection of Aspergillus flavus, the fungus that produces aflatoxin. In a study addressing the effect of sample size on grade factors (8), it was shown that 98% of the value of a load is determined by the percentage of sound mature kernels plus sound splits (SMKSS). Shelled stock grades for runner-type peanuts are generally divided into five categories based primarily on kernel size consisting of jumbos, mediums, number 1s, US splits, and oil stock.
Aflatoxin is also an important quality factor for shelled stock peanuts because of the strict aflatoxin tolerances permitted for the sale of peanuts in edible markets. The potential for aflatoxin contamination imposes considerable economic cost to the U.S. peanut industry. A 4-yr study from 1993 to1996 was conducted to estimate the net cost due to aflatoxin to the farmer, buying point, and sheller segments of the peanut industry in the southeast U.S. The farmer segment net cost due to Segregation III lots (visible Aspergillus flavus found during farmer stock grading) averaged $2,595,000 per year. Buying point losses from handling Segregation III lots averaged $532,585 annually. The yearly average net cost to the southeast sheller segment over the 4 yr period was $22,697,737 per year. In the 4 yrs studied, Segregation III lots and aflatoxin cost the farmer, buying point, and sheller segments of the southeast U.S. peanut industry an average of $25,825,259 annually (15).
Important requirements for successful peanut production include proper soil and climatic conditions, crop rotation, land preparation and planting conditions, fertilization, variety selection, weed and pest control, growth regulation, and adequate rainfall or irrigation (3,7,9,10,11,22). Supplemental irrigation is essential to maintaining crop yield, quality and income during most years in peanut producing regions. Producers realized the importance of irrigation as irrigated acreage in Georgia has increased from 175,000 acres in 1970 to 1,655,000 in 2006 (1). However, demand for water resources due to urban expansion and interstate litigation coupled with repeated drought are collectively threatening irrigation water supplies in peanut producing regions of the Southeast U.S. Reductions in water availability for irrigation can negatively impact peanut yield and quality in the all U.S. peanut producing regions (11,13,14,17).
An 8-yr study in the southeastern peanut producing region concluded that irrigated peanut yield and quality parameters were significantly improved (P = 0.05) compared to non-irrigated. Irrigated peanut yield was 569 kg ha−1 higher than non-irrigated yields. The irrigation-associated increases in farmer stock grade (SMKSS), jumbos, and seed germination were significant (P = 0.05) at 2.3, 2.0, and 6.0%, respectively. Aflatoxin in the non-edible oil stock category was significantly (P = 0.05) reduced by 140 ppb in the irrigated fields (14). The objective of this research was to evaluate the effects of irrigation amount on quality factors of farmer and shelled stock peanuts.
Materials and Methods
Experiments were conducted during the 2002–2007 crop years at the USDA-ARS Multi-crop Irrigation Research Farm in Shellman, Georgia (84° 36′ W, 30° 44′ N). The soil was a Greenville fine sandy loam (fine, kaolinitic, thermic Rhodic Kandiudults) with 0–2% slope. Conventional tillage practices were followed on all treatments and generally consisted of disking twice, subsoiling once, moldboard plow once, field cultivating once, and rototilling to establish seed beds and planting. The fungicide program for disease control included chlorothalonil for the first two sprays, tebuconazole for the next four applications, and chlorothalonil on the final application. The peanut cultivar was Georgia Green planted at 23 seeds m−1. Plots consisted of 18, 30.5-m-long rows spaced 0.91 m apart.
Depending on soil moisture, planting dates were during the first two weeks of May each year. A split-plot design with crop rotations randomized within irrigation blocks was used to compare three amounts of sprinkler irrigation with a non-irrigated control. Irrigation was the main plot factor and crop rotations were randomly assigned to sub-plots within irrigation rate. A specially designed, 3-span, linear-move sprinkler irrigation system was installed and specific pressure regulation and nozzle placement provide irrigation amounts of 100, 66, and 33 percent (of 100 percent sufficiency) under the respective spans. Irrigation scheduling (timing and amount) in peanuts was managed by the Irrigator Pro for Peanuts expert system based on the 100 percent sufficiency treatment (6,13).
Five crop rotation sequences that included peanut, cotton, and corn were used. Three replications of each rotation sequence were included in the study consisting of: 1) continuous peanut; 2) cotton peanut alternating; 3) corn peanut alternating; 4) cotton, cotton, peanut; and 5) cotton, corn, peanut. Harvest date was determined by the peanut hull scrape method (21). Peanuts were dug with a standard 2-row peanut inverter, allowed to windrow dry for approximately three days and harvested using a 2-row combine with a bagging attachment. Yield was taken from the two middle rows of each plot. After harvest, peanuts were cured to the marketable kernel moisture content between 7 and 10 percent. The yield sample was then riffle divided to obtain a 4500-g subsample for post-harvest evaluations. The peanut quality parameters measured included SMKSS, commercial shelling outturn (jumbos, mediums, No. 1s, U.S. splits, and oil stock), germination, and aflatoxin. Standard Federal-State Inspection Service grading procedures were followed to obtain SMKSS (23). Total kernels (TK) were also obtained from the farmer stock grade as defined by SMKSS plus loose shelled kernels plus other kernels. Commercial shelling outturn was obtained using various screen sizes (Table 1).
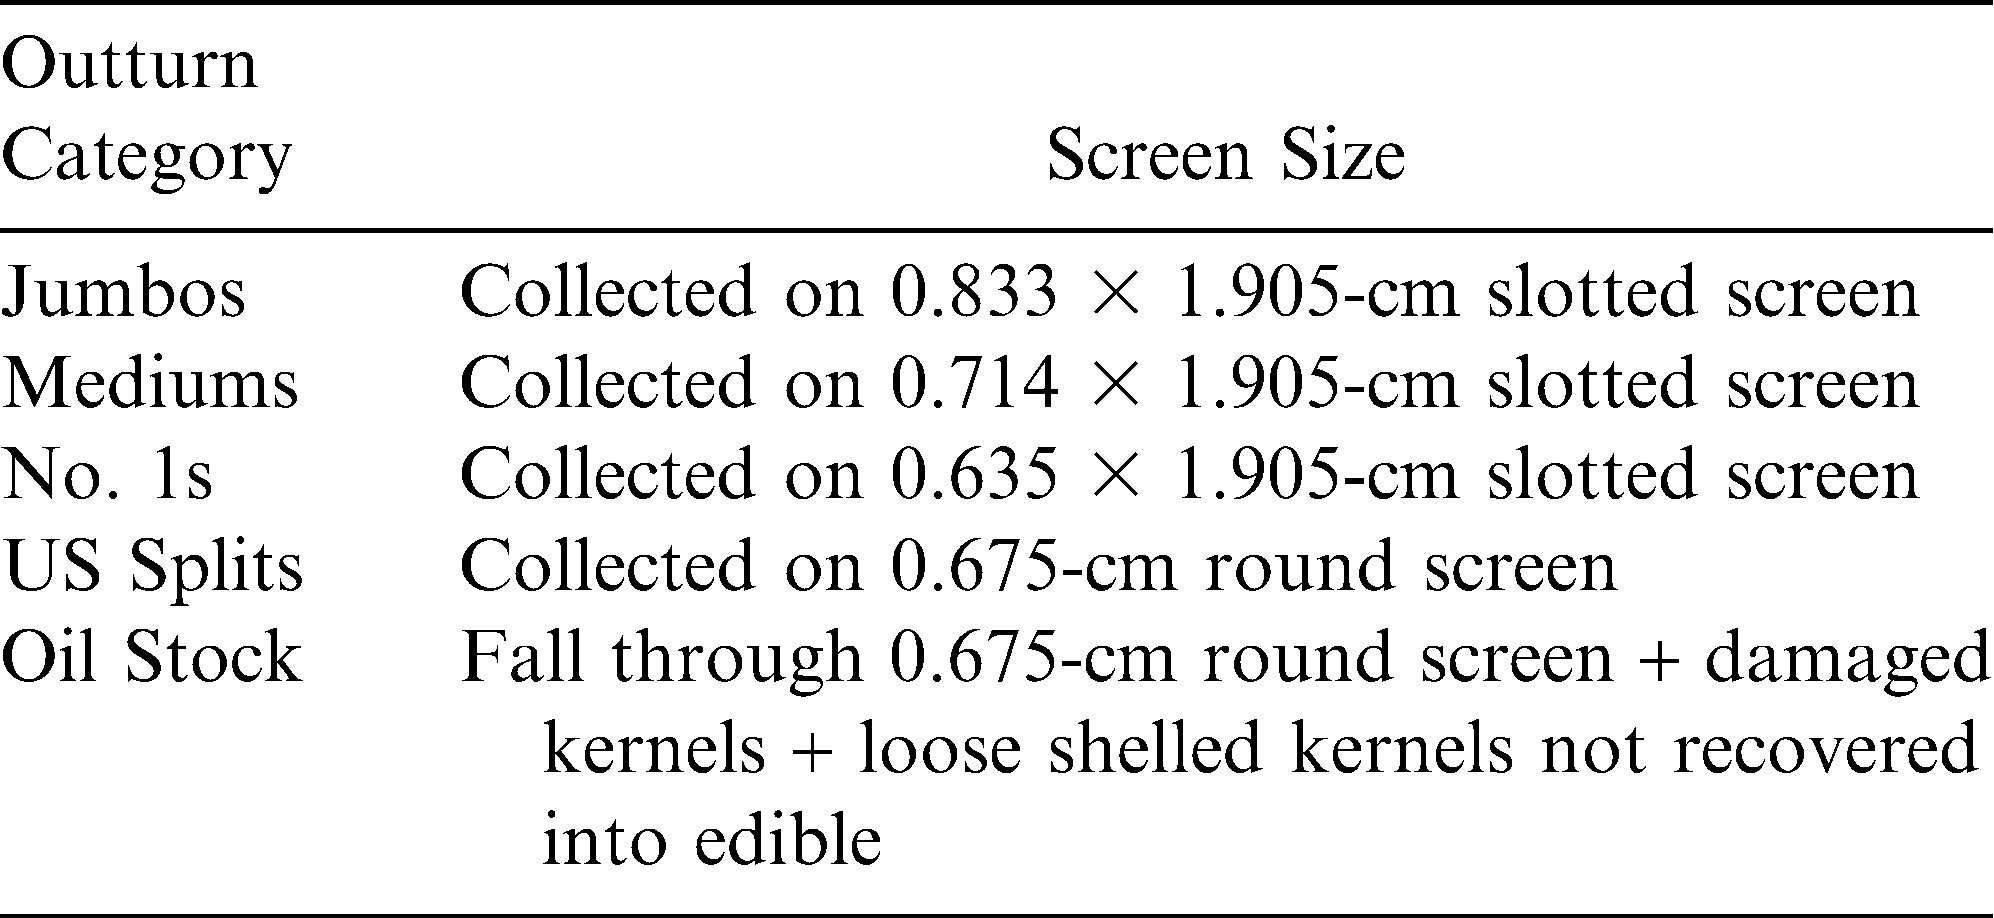
Commercial shelling outturns for runner-type peanuts.
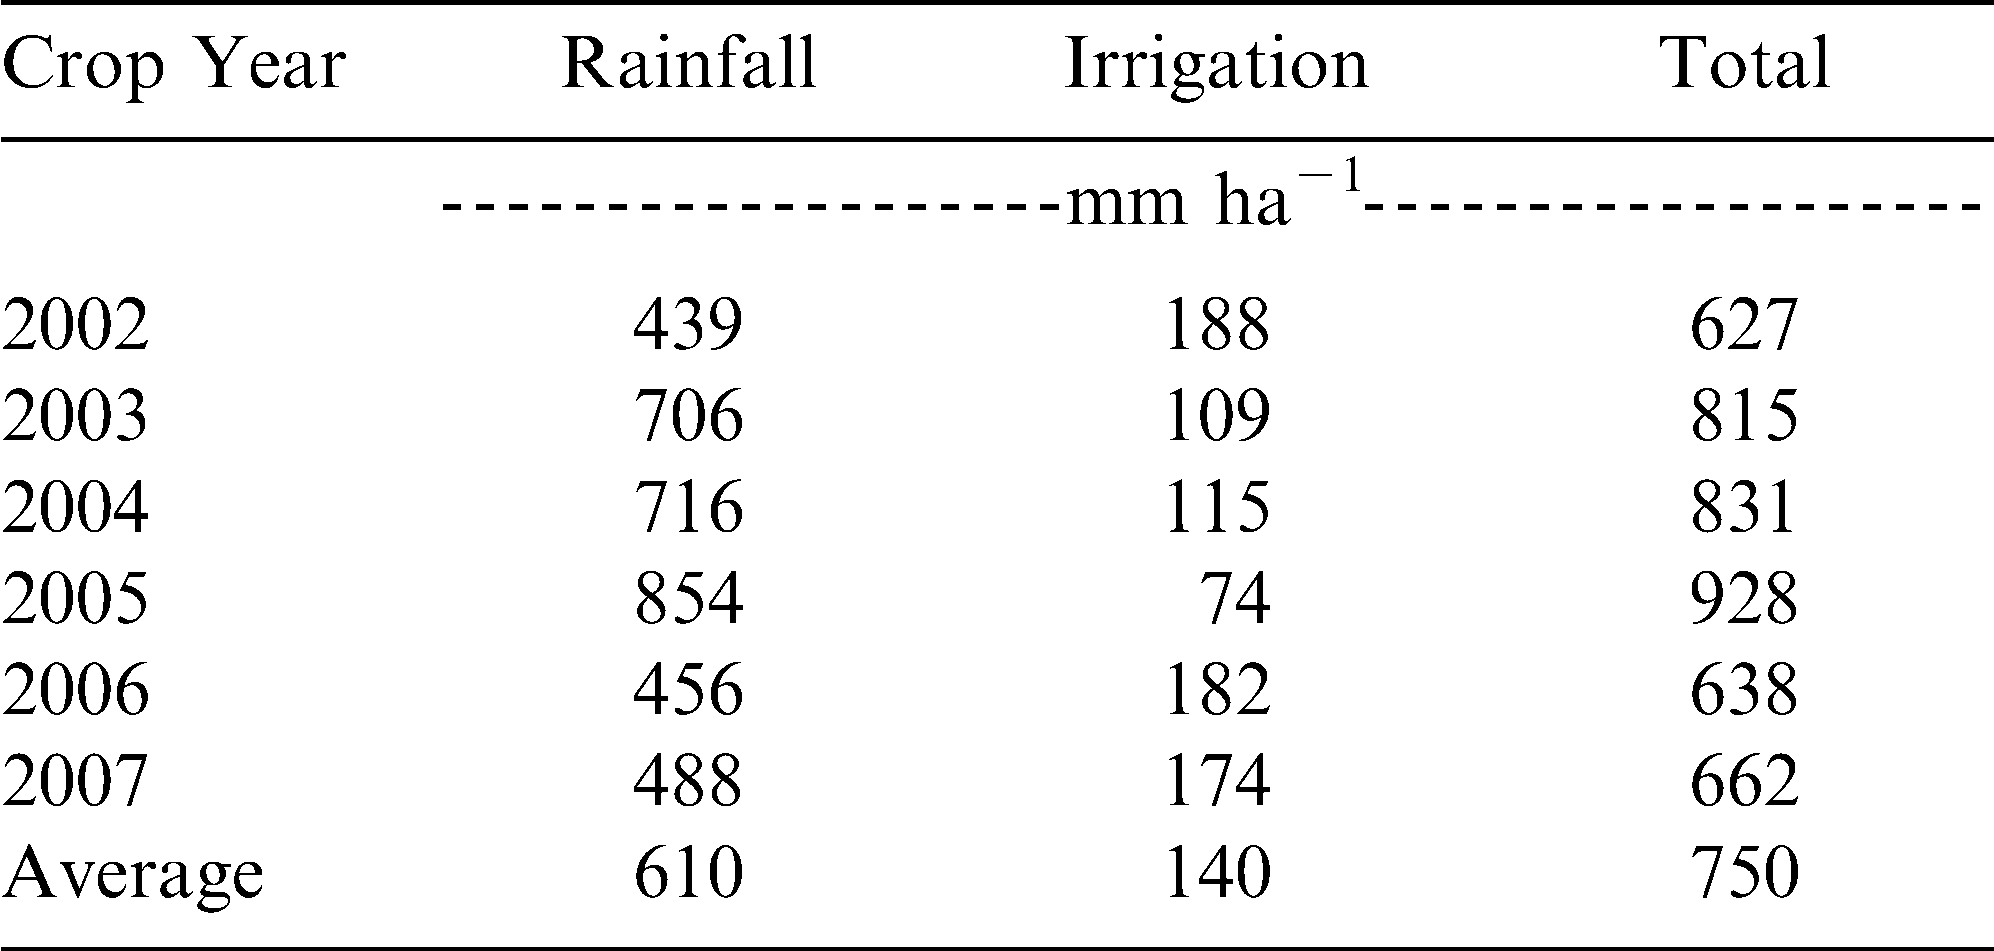
Precipitation and irrigation amounts for the 100% sufficiency irrigation treatment during the 2002–2007 cropping seasons at the Multi-crop Irrigation Research Farm, Shellman, GA.
After shelling, samples were sorted using an electronic color sorter (Satake Scanmaster EMS RM 200S, Houston, TX) using standard industry settings. Electronic color sorting segregated the shelled stock lots into accepts and rejects within each shelled outturn category. Total edibles are defined as the sum of accept jumbos, mediums, No. 1s, and US splits; and total rejects are defined as the sum of reject jumbos, mediums, No. 1s, and US splits. A 250-g sample of whole kernels collected on the 0.635 × 1.905-cm slotted screen was obtained and sent to the Georgia Seed Laboratory in Tifton, GA for seed germination testing.
Peanut quality factors were subjected to analysis of variance using a general linear model procedure of SAS (version 9.2, Statistical Analysis Systems, Cary, NC) and significant differences among means for year and irrigation amount were determined using Fisher's Protected Least Significant Difference test at P≤0.05. The effect of cropping rotation sequence was not significant and was removed from the statistical model to allow greater replication. Unless otherwise stated, all differences described below are significant at P = 0.05.
Results and Discussion
Precipitation and irrigation applied during the 2002–2007 growing seasons for peanut is provided in Table 2. The 20-yr average precipitation during the growing season for the region is 566 mm per year. Precipitation on peanut during the 2002–2007 growing seasons averaged 609 mm, with 3 years (2002, 2006, and 2007) receiving less than average precipitation and 2003, 2004, and 2005 receiving more than average precipitation. Irrigation amounts were approximately the same in 2002, 2006, and 2007 at 174 to 188 mm ha−1. Less irrigation was applied from 2003 to 2005 at 74 to 115 mm ha−1. In the three yrs with less than average precipitation, 1.8 times more irrigation was applied than in years with more than average precipitation.
Analysis of the data over the 2002–2007 crop years indicated no significant differences in peanut quality parameters associated with the crop rotation sequences. Thus, the rotation sequences were pooled and the data analyzed for peanut quality differences associated with different amounts of irrigation. The ANOVA results varied for the Year (Y) and Irrigation (I) main effects and the Y × I interaction effect for the peanut quality variables (Table 3). Year had a significant influence on SMKSS, TK, TR, germination, oil stock, and jumbo accept kernels. Irrigation amount significantly influenced TK, total edible kernels, oil stock, jumbo accept kernels, medium accept kernels, number one accept kernels. The Y × I interaction had a significant influence on SMKSS, TK, TR, total edible kernels, germination, oil stock, and jumbo accept kernels.
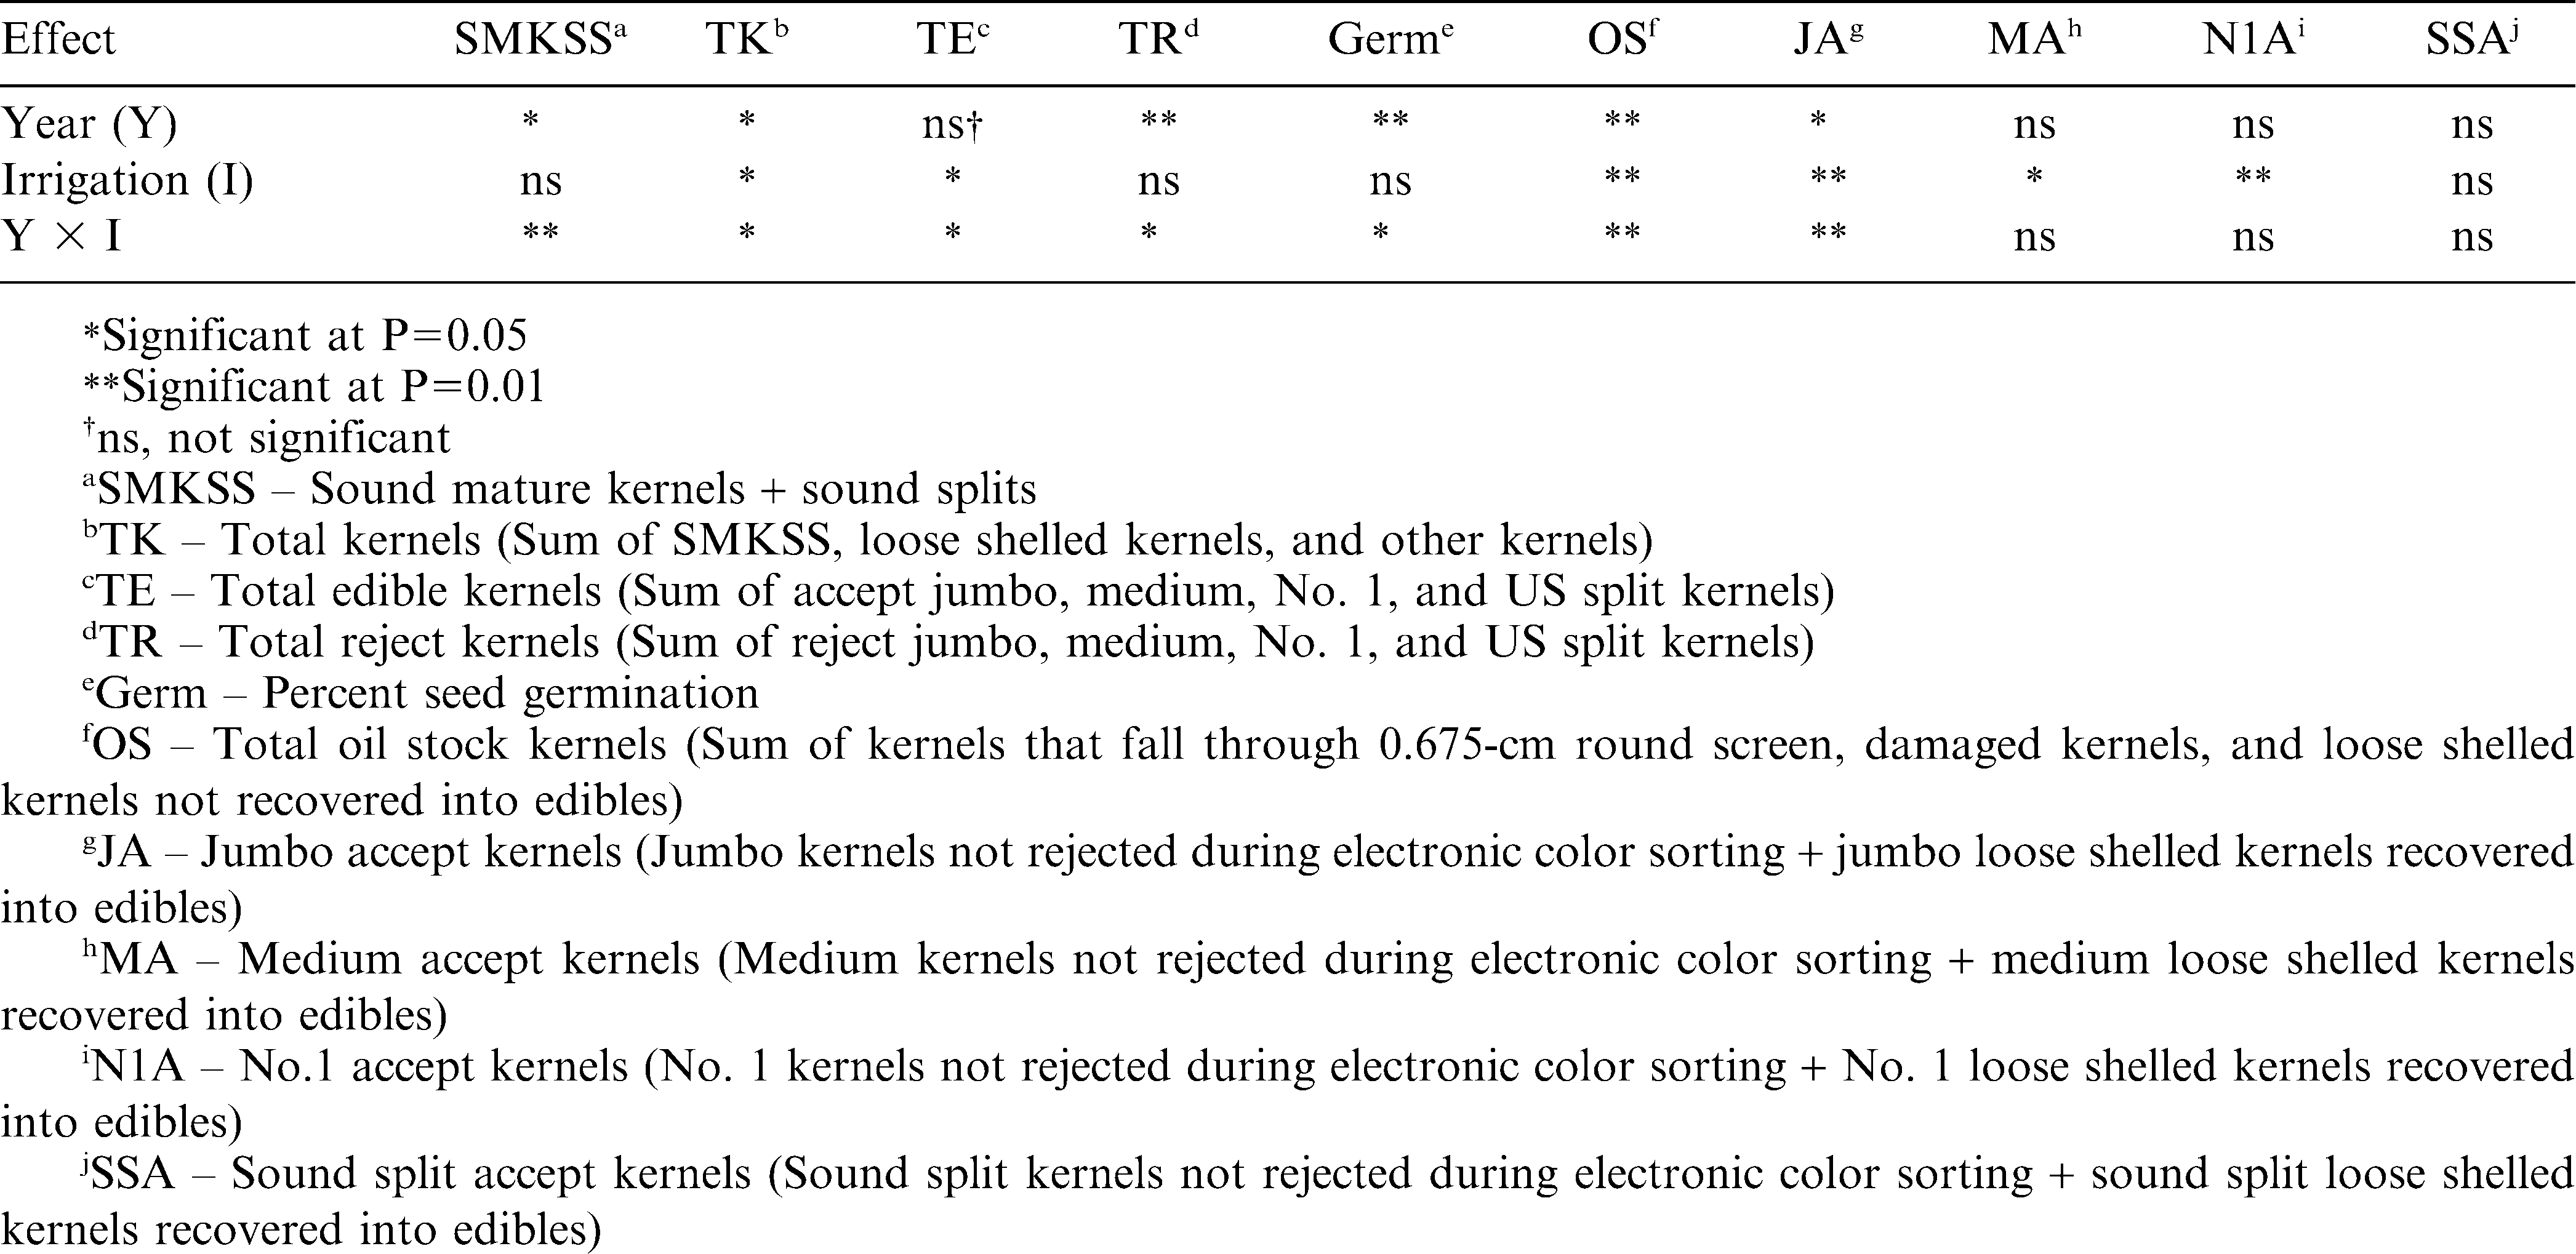
Analysis of variance for year and irrigation amount effects on peanut quality factors.
For all irrigation treatments, SMKSS were higher than the non-irrigated control in all years except for 2005 (Table 4). The difference in SMKSS between the 100% treatment and the non-irrigated control was 6.1% which at the current loan rate for runner-type peanuts equates to $26.50 Mg−1 higher value. This difference, although higher, is consistent with previous results obtained from farm survey data taken across a large geographic cross section of the southeast U.S. peanut belt that showed that SMKSS in irrigated peanut was higher than in non-irrigated peanut (14). No differences in SMKSS resulted in the 100%, 66%, and 33% treatments during the 2002, 2003, and 2005 years. However, differences in SMKSS between irrigation rates were observed in 2004, 2006, and 2007 years, resulting in a reduction mainly at the 33% rate compared to the higher rates (Table 4).
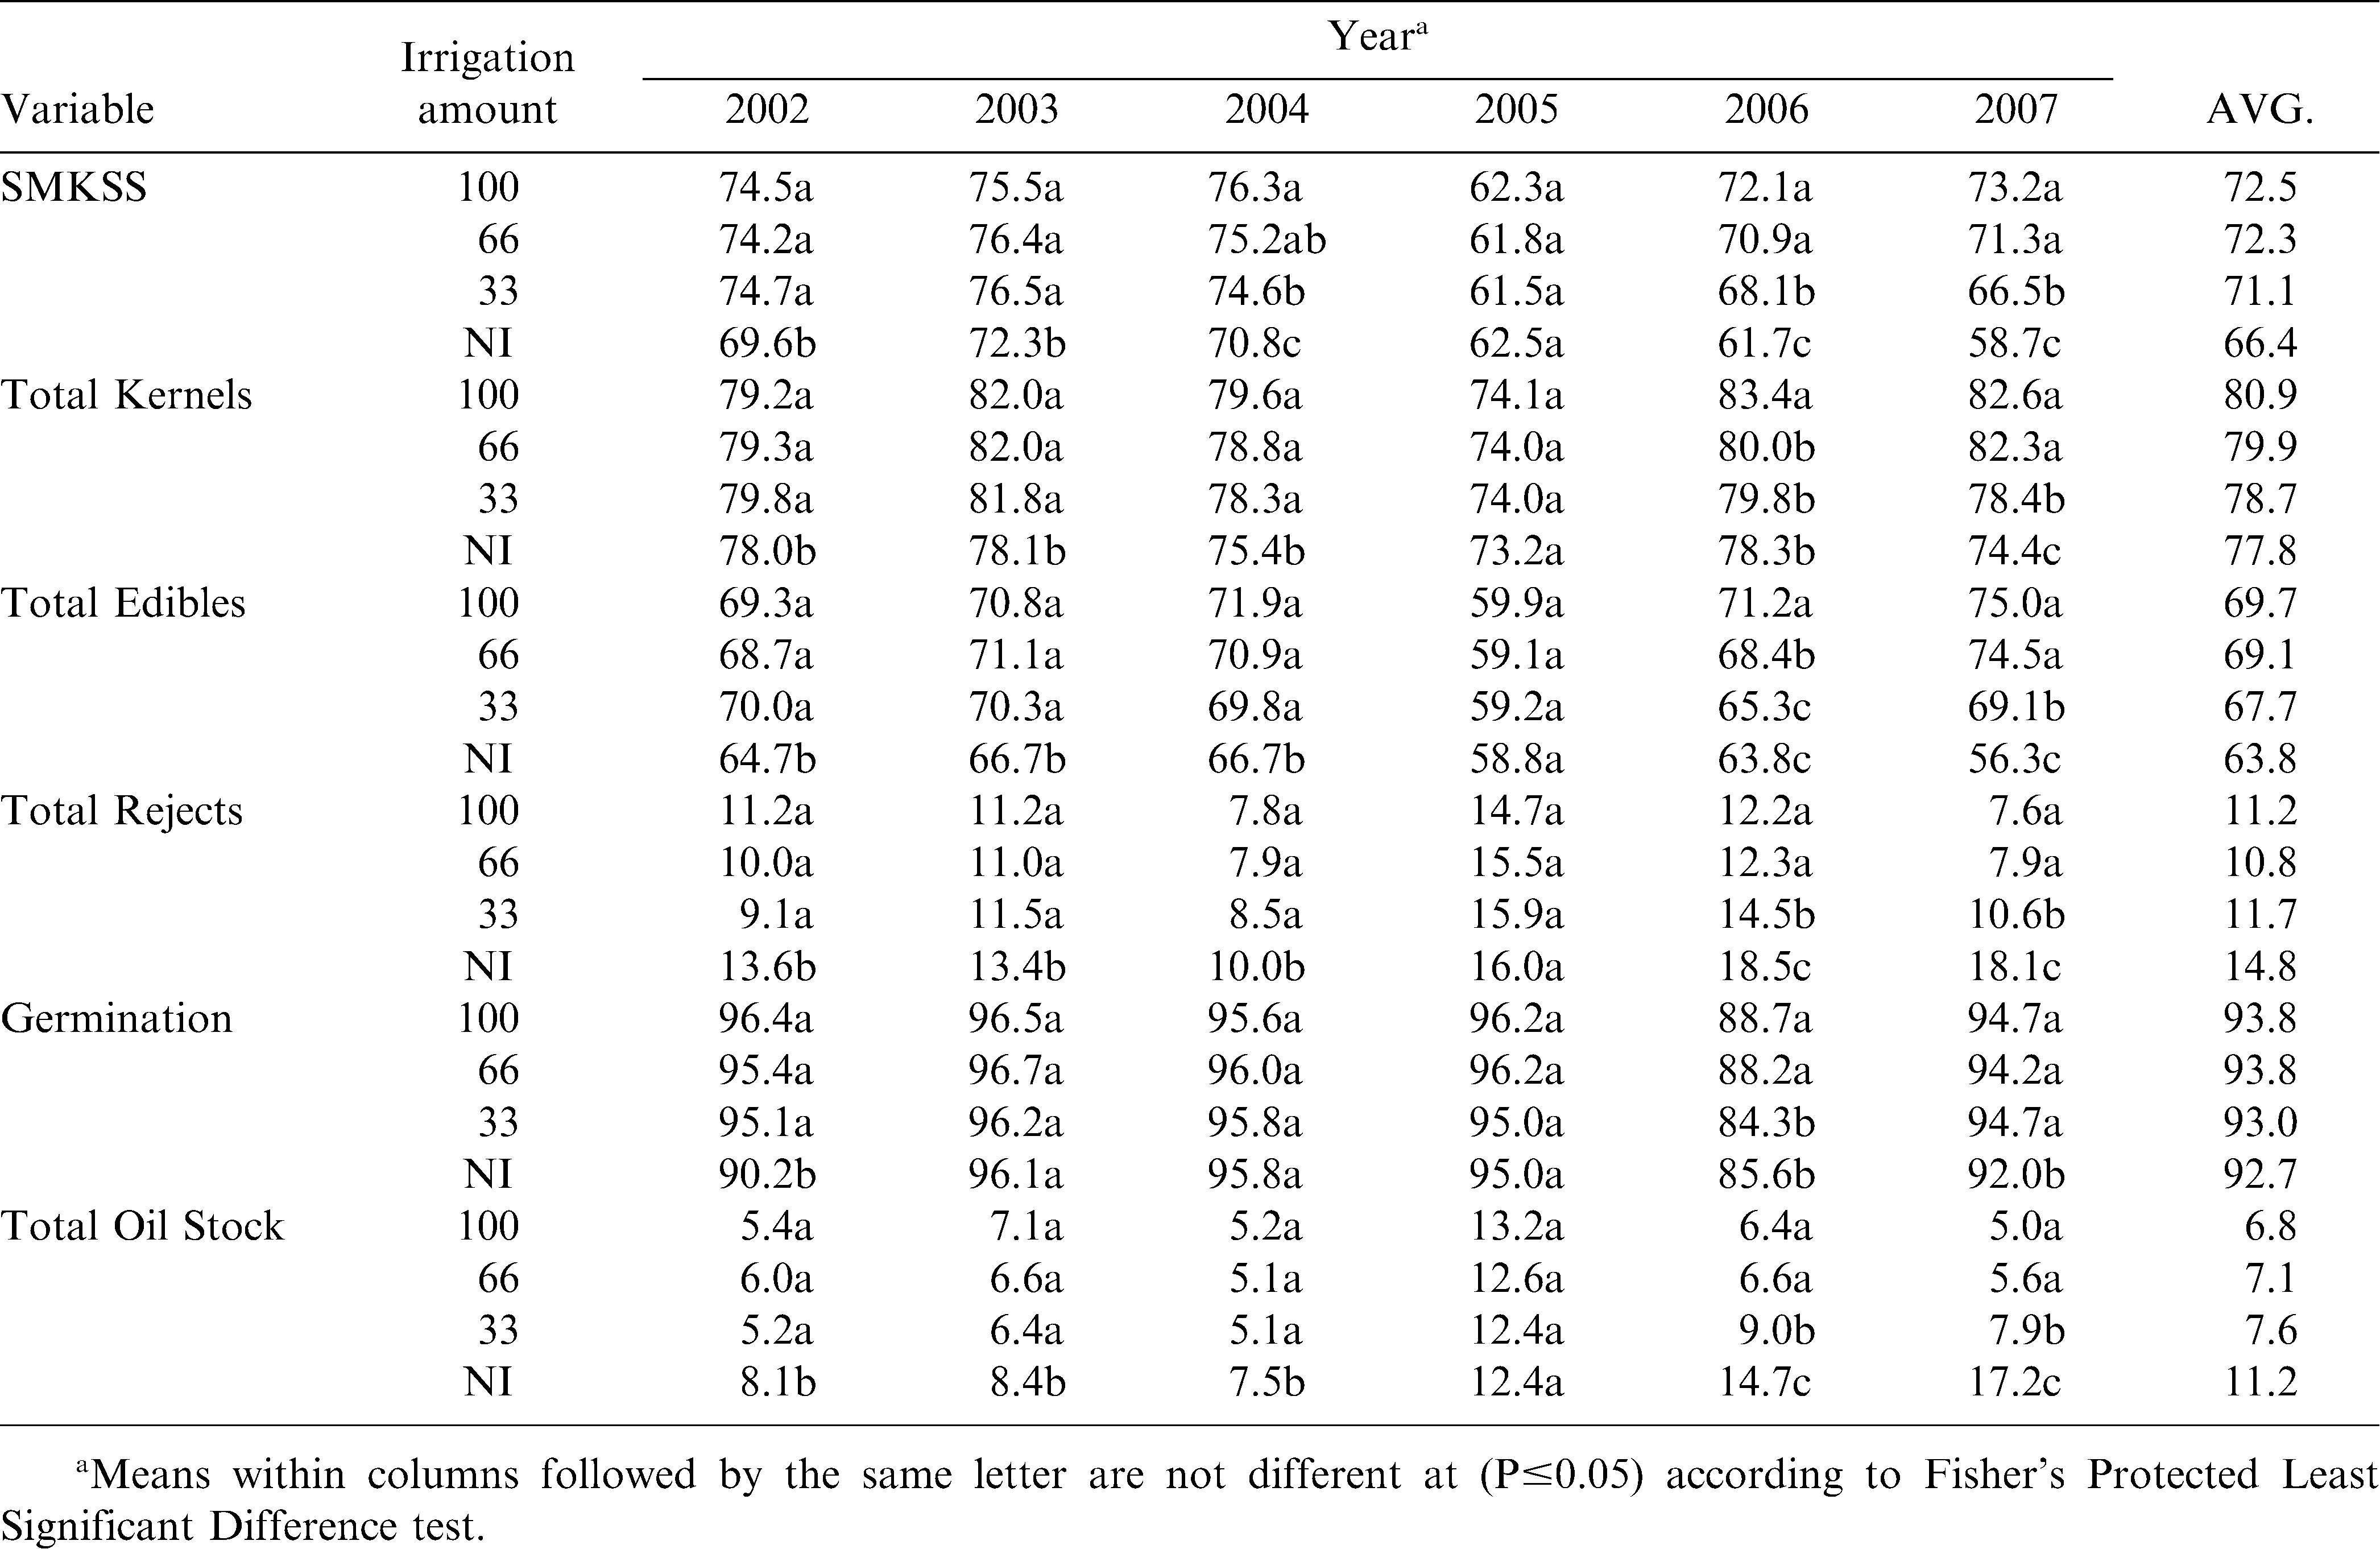
Effect of irrigation amount on peanut quality variables during 2002–2007.
On average over the 6-yr period, TK were significantly higher in the 100% and 66% sufficiency treatments compared to the non-irrigated control (Table 4). No differences resulted between the 66% and 33% or between the 33% and non-irrigated treatments. Total kernels in the 100%, 66%, and 33% sufficiency treatments were higher than the non-irrigated control in all years except for 2005. No differences in TK resulted between the irrigated treatments during the 2002–2005 crop years. In 2006, TK for the 100% irrigation treatment were higher than for the 66%, 33%, and non-irrigated control treatments. In 2007, TK in the 100% and 66% irrigation treatments were higher than for the 33% treatment.
Total edibles in each of the irrigation amounts were higher than total edibles in the non-irrigated when averaged over the 6-yr period (Table 4). Reduction in amount of total edibles has a significant impact on the profitability of peanut processors (16). No differences resulted between the 100% and 66% irrigation treatments and between the 66% and 33% irrigation treatments. No differences in total edibles resulted between the irrigated treatments during the 2002–2005 crop years. In 2006, total edibles for the 66% sufficiency treatment were intermediate between the 100% irrigation treatment and the 33% and non-irrigated treatments. In 2007 total edibles in the 100% and 66% treatment were higher than the 33% treatment and the non-irrigated control (Table 3).
On average over the 6-yr period, total rejects were higher in the non-irrigated treatment compared to all of the irrigated treatments (Table 4). No differences in total rejects resulted between the irrigated treatments during the 2002–2005 crop years. Total rejects in the 100%, 66%, and 33% irrigation treatments were lower than the non-irrigated control in all years except for 2005. No differences in total rejects resulted between the irrigated treatments during the 2002–2005 crop years. In 2006 and 2007, no differences in total rejects resulted in the 100% and 66% treatments while total rejects in both of these treatments in each year were lower than the 33% treatment.
No differences resulted for seed germination when averaged across the 6-yr period. This result was unexpected and not consistent with prior research that showed a significant difference in seed germination from samples gathered at harvest from a large geographic cross section of the southeast U.S. peanut belt (14). A possible explanation for the lack of response to irrigation is that the research plots had Ca levels of 1,258 kg ha−1 which is 2.4 times higher than the 525 kg ha−1 recommended soil test level. The amount of Ca taken up by the plant is dependent on concentration levels in the soil and the amount of available water (18). In the years when rainfall was below normal (2002, 2006, 2007), seed germination was higher in the irrigated treatments compared to the non-irrigated treatment (Table 4). No differences in seed germination in the irrigated amounts resulted except in 2006 where the 100% and 66% treatments were higher than the 33% treatment.
Averaged over the 6-yr period, no significant differences resulted among the irrigation amounts for total oil stock while all were lower than the non-irrigated control (Table 4). Total oil stock in the 100%, 66%, and 33% treatments was lower than the non-irrigated control in all years except for 2005. Oil stock prices are approximately 40% lower than edible peanut prices and thus the increased output of oil stock in non-irrigated peanuts has a negative impact on the profitability of peanut processors (16). No differences in total oil stock resulted between the irrigated treatments during the 2002–2005 crop years. In 2006 and 2007, total oil stock in the 33% irrigation treatment was higher than the 100% and 66% treatments.
Irrigation amount had significant impacts on post harvest processing through effects on shelling outturns and total shelled stock value per ton (Table 5). The data provided in Table 5 are the percentage of accepts and rejects for each commercial runner-type outturn category on a net shelled stock ton basis averaged across the 6-yr study period. Jumbo accepts in the irrigation treatments were higher than the non-irrigated control. No differences resulted between the 100% and 66% treatments or the 66% and 33% treatments, and the 100% treatment was higher in jumbos than the 33% treatment. Within the jumbo outturn, the 100% irrigation treatment had less rejected jumbos than the non-irrigated control. No differences resulted between the 66%, 33%, and non-irrigated treatments. The trends in the medium accepts outturn category were similar to the jumbo accepts category. Rejects in the mediums were higher in the non-irrigated control and no differences in medium rejects resulted in the irrigated amounts. In the No. 1s accepts category, the non-irrigated control had more No. 1s than any of the irrigation amounts. No differences resulted in No. 1 accepts for the irrigated amounts. The rejects in No.1s were higher in the non-irrigated control and no differences resulted in No. 1 rejects in the irrigation amounts. No differences resulted for sound split accepts. However, sound splits are generally functions of handling and kernel moisture during processing instead of irrigation amount (3,5). Sound split rejects were higher in non-irrigated control compared to the irrigation amounts, and no differences resulted between the irrigation amounts.
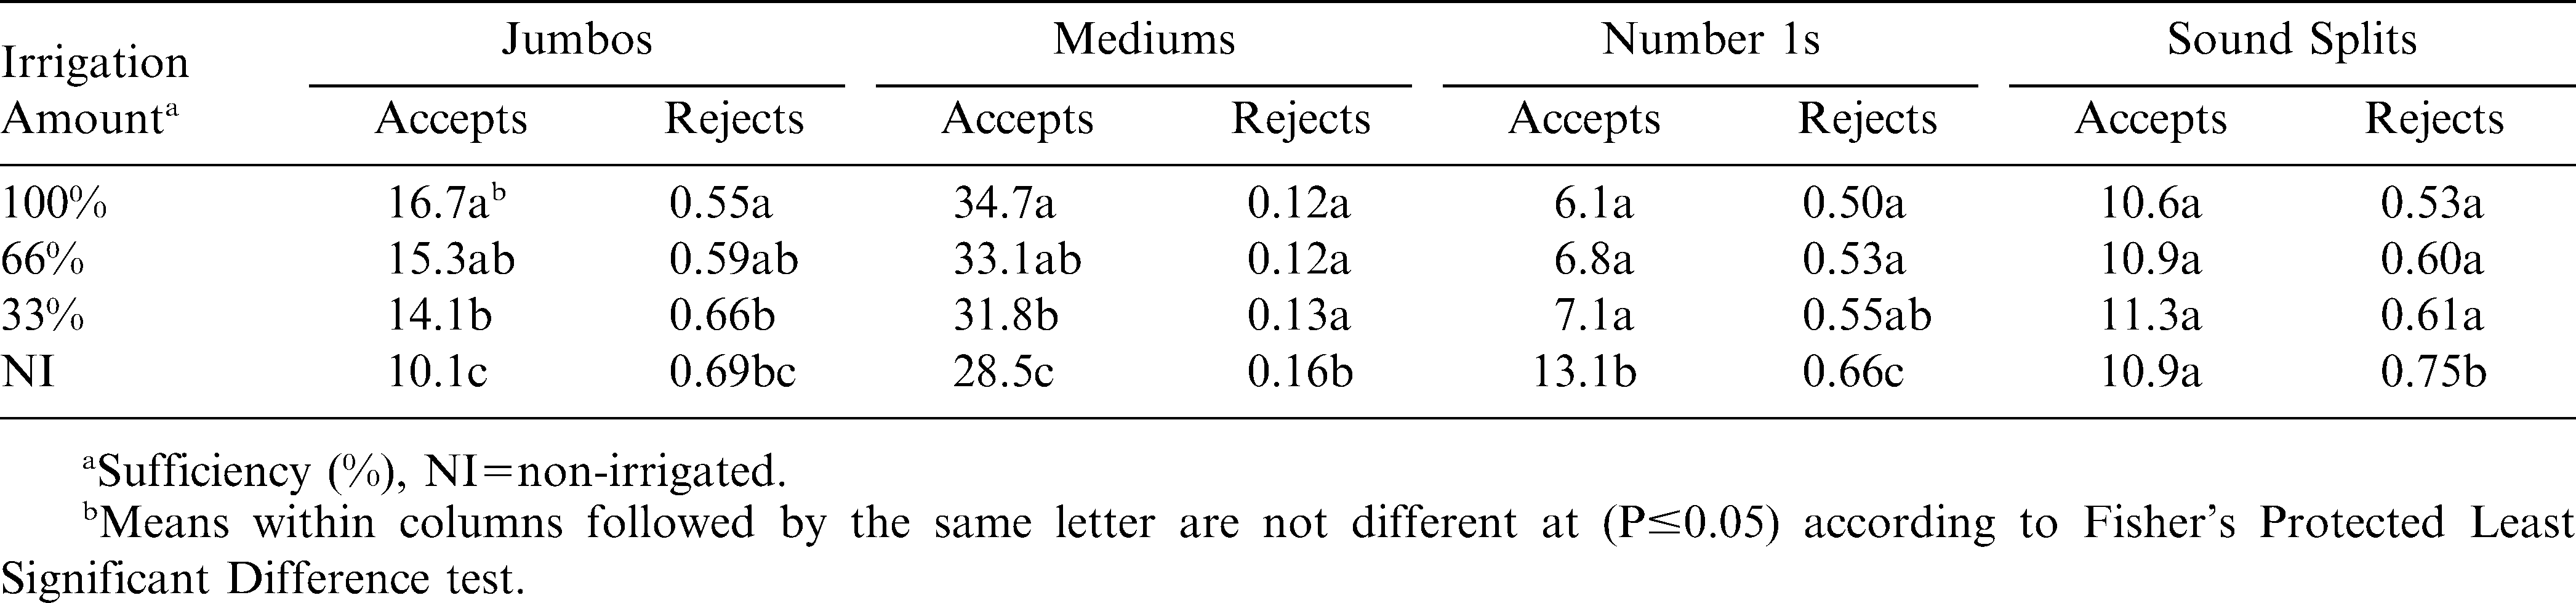
Effect of irrigation amount on shelling outturns for runner-type peanuts over years from 2002 to 2007.
Aflatoxin analyses were conducted separately for the accept and reject samples. Due to variability associated with aflatoxin, the samples for jumbos, mediums, no. 1s, and sound splits were combined and quantified using liquid chromatography (19). No aflatoxin was detected in either the accepts or rejects from any of the irrigated treatments. In the non-irrigated control, aflatoxin was detected in the accepts in 2002 at 10.2 parts per billion. Aflatoxin was detected in the non-irrigated rejects in 4 yr, however, the only significant level was 17.4 ppb found in 2002. While 3 yrs of the study received less than average precipitation, drought stress apparently was not sufficient for significant contamination levels to occur (4).
Summary and Conclusions
The data indicate the importance of peanut irrigation in Georgia on peanut quality factors. Significant differences resulted in all quality factors, except seed germination, for the 100% irrigation amounts versus non-irrigated control over the study period (2002–2007). Shelling outturn of higher value kernel categories (jumbos and mediums) were significantly higher in the 100% irrigation amounts than resulted in the 33% irrigation amount and the non-irrigated control. Results of this research show the importance of irrigation on peanut quality beyond the farm gate impacting the post-harvest processing sector of the peanut industry.
Literature Cited
Anon 2006 Irrigation survey reflects steady growth. Irrigation Jour., Jan./Feb., pp. 24 – 39 .
Beasley E. O. and Dickens J. W. 1963 Engineering research in peanut curing. North Carolina Agric. Exp. Stn. Tech. Bull. No. 155.
Beasley J. P. 1990 Producing quality peanuts. Univ. of Georgia Coop. Ext. Serv. Bull 1036 : 5 – 10 .
Blankenship P. D. , Cole R. J. , Sanders T. H. , and Hill R. A. 1984 Effect of geocarposphere temperature on pre-harvest colonization of drought-stressed peanut Aspergillus flavus and subsequent aflatoxin contamination. Mycopathologia 85 : 69 – 74 .
Davidson J. I. , Whitaker T. B. , and Dickens J. W. 1982 Grading, cleaning, storage, shelling, and marketing of peanuts in the United States. pp. 571 – 623 In Pattee H. E. and Young C. T. (eds.) Peanut Science and Technology Amer. Peanut Res. Educ. Asso., Yoakum, TX .
Davidson J. I. , Butts C. L. , Parker S. , and Jones C. A. 1990 EXNUT: An expert system for peanut production. ASAE Paper No. 90-7557 Amer. Soc. Agric. Eng St. Joseph, MI .
Davidson J. I. , Blankenship P. D. , Henning R. J. , Guerke W. R. , Smith R. D. , and Cole R. J. 1991 Geocarposphere temperature as it related to Florunner peanut production and irrigation patterns and soil temperature. Peanut Sci 18 : 79 – 85 .
Dowell F. E. 1992 Sample size effects on measuring grade and dollar value of farmers' stock peanuts. Peanut Sci 19 : 121 – 126 .
Henning R. J. , McGill J. F. , Samples L. E. , Swann C. , Thompson S. S. , and Womack H. 1979 Growing Peanuts in Georgia: A Package Approach. Univ. of Georgia Coop. Ext. Serv. Bull. 640, 488 pp.
Henning R. J. , Allison A. H. , and Tripp L. D. 1982 Cultural practices. pp. 123 – 127 In Pattee H. E. and Young C. T. (eds.) Peanut Science and Technology, Am. Peanut Res. and Ed. Soc, Inc Yoakum, TX .
Johnson C. 1987 Georgia peanut production guide. SB23. The Univ. of Georgia College of Agriculture Extension Service.
Jordan D. L. , Bailey J. E. , Barnes J. S. , Bogle C. R. , Bullen S. G. , Brown A. B. , Edmisten K. L. , Dunphy E. J. , and Johnson P. D. 2002 Yield and economic return of ten peanut-based cropping systems. Agron. J 94 : 1289 – 1294 .
Lamb M. C. , Davidson J. I. , and Butts C. L. 1993 Peanut yield decline in the Southeast and economically feasible solutions. Peanut Sci 20 : 36 – 40 .
Lamb M. C. , Davidson J. I. , Childre J. W. , and Martin N. R. 1997 Comparison of peanut yield, quality, and net returns between non-irrigated and irrigated production. Peanut Sci 245 : 97 – 101 .
Lamb M. C. and Sternitzke D. A. 2001 Cost of aflatoxin to the farmer, buying point, and sheller segments of the southeast United States peanut industry. Peanut Sci 28 : 59 – 63 .
Lamb M. C. , Blankenship P. D. , Whitaker T. B. , and Dorner J. W. 2003 Processing costs and derived demand for screened versus unscreened farmer stock peanuts. Peanut Sci 30 : 60 – 63 .
Lamb M. C. , Masters M. H. , Rowland D. , Sorensen R. B. , Zhu H. , Blankenship P. D. , and Butts C. L. 2004 Impact of sprinkler irrigation amount and rotation on peanut yield. Peanut Sci 31 : 108 – 113 .
Mengel K. and Kirkby E. A. 1982 Principles of plant nutrition Int. Potash Inst Berne, Switzerland .
Sobolev V. S. and Dorner J. W. 2001 Cleanup procedure for determination of aflatoxin in major agricultural commodities by liquid chromatography. J. AOAC 85 (3) : 642 – 645 .
Tomek W. G. and Robinson K. L. 1981 Price differences associated with quality. Agricultural Product Prices 2 : 140 – 149 .
Williams E. J. and Drexler J. S. 1981 A non-destructive method for determining peanut pod maturity. Peanut Sci 8 : 134 – 141 .
Womack H. , French J. C. , Johnson F. A. , Thompson S. S. , and Swann C. W. 1981 Peanut pest management in the southeast. Univ. of Georgia Coop. Ext. Serv. Bull 850 : 7 – 20 .
USDA, Agricultural Marketing Service 1991 Farmers Stock Peanuts, Inspection Instructions U.S. Gov. Print. Office Washington, DC .
Notes
- 1Research Food Technologist, 2Agronomist, 3Plant Physiologist, 4Agricultural Engineer, 5Microbiologist, U.S.DA, ARS, National Peanut Research Laboratory, 1011 Forrester Drive, S.E., Dawson, GA 39842. [^] *Corresponding author email: marshall.lamb@ars.usda.gov
Author Affiliations