

Introduction
Cultivated peanut (Arachis hypogaea L.) production in the U. S. has become dependant upon numerous types of fungicides, herbicides, insecticides, miticides, and nematicides (Warren et al., 1995). Annually, pesticides and irrigation contribute the largest variable input costs to U.S. peanut growers (Smith, 2006).
Current pesticides used in the U.S. are very effective but expensive. Likewise, irrigation is needed to increase yield and market grades in peanut production. However, the maximum yield and grade may not be the most economical. Possibly, growers could utilize minimum inputs and still achieve the highest dollar value return above variable cost. However in previous studies without any fungicides and insecticides, pod yield performance was found to be relatively low (Branch and Fletcher, 2001; Branch and Culbreath, 2008). So, an integrated disease management approach with resistant cultivars, reduced fungicides, and no irrigation could substantially lower production variable cost, and still result in high economical returns.
In the southeast U.S., tomato spotted wilt disease caused by Tomato spotted wilt virus (TSWV) has been found to be more severe with planting dates early in April (Beasley, 2008; Tillman et al., 2007). However, later planting dates result in increased early and late leafspot disease pressure caused by Cercospora arachidcola Hori and Cercosporidium personatum (Bert. & Curt.) Deighton, respectively (Culbreath et al., 2009). Consequently, increasing fungicide cost with these later planting dates.
The objective of this study was thus two-fold a) to evaluate the agronomic performance among several peanut genotypes when planted early for TSWV disease incidence, pod yield, and dollar values and b) to perform an economic analysis between genotype and Max vs. Min combinations for the greatest dollar return above variable cost.
Material and Methods
During 2004, 24 different peanut cultivars (runner-and virginia-types) and advanced breeding lines developed by the University of Georgia Peanut Breeding Program were evaluated for TSWV and total disease incidence, pod yield, and dollar value in separate Max and Min input production tests at Tifton and Plains, GA. Similarly, during 2005 and 2006 the numbers of peanut genotypes evaluated were 26 and 30, respectively. Max and Min field trials were conducted on a Tifton loamy soil (fine-loamy, siliceous, thermic Plinthic Kandiudults) at the Gibbs Research Farm near the Coastal Plain Experiment Station in Tifton and on a Greenville sandy clay loam soil (clayey, kaolinitic, thermic Rhodic Kandiudults) at the Southwest Georgia Research and Education Center near Plains. Plots consisted of two rows spaced 1.8 m apart by 6.1 m long. At Tifton, planting dates were 14 April 2004, 13 April 2005, and 14 April 2006. At Plains, planting dates were 21 April 2004, 18 April 2005, and 18 April 2006. The Max tests included all recommended production practices of seeding rate, fertilization, irrigation, and pesticides. The Min tests excluded irrigation and insecticides and only three fungicides sprays were included during the growing season beginning 30 d after planting and then applied at 28 d intervals.
During 2004, 2005, and 2006 at Tifton, the number of times and amount of irrigation applied totaled (7×) 127.00, (4×) 99.06, and (8×) 267.97 mm respectively; whereas, during 2004, 2005, and 2006 at Plains, the number and amount of irrigation applied totaled (6×) 116.84, (4×) 66.04, and (6×) 127.00 mm, respectively. These field trials were in a three-year rotation following cotton (Gossypium sp.L.) and corn (Zea mays L.). Individual entries were dug near optimum maturity based upon hull-scrape determined from adjacent border rows (Williams and Drexler, 1981).
Incidence of Tomato spotted wilt virus (TSWV) was first assessed at approximately 70 d after planting, when TSWV is usually the only disease occurring at this time during the season. Percentages of total disease were also scored prior to digging, which included primarily TSWV and any soilborne disease. A disease hit equaled one or more diseased plants in a 30.5-cm section of row.
After digging and threshing, pods were dried with forced warm air to 6% moisture. Pod samples were then hand-cleaned over a screen table before weighing for yield determinations. Market grades were determined according to federal state inspection service procedures for runner and virginia-type peanut, respectively (USDA-AMS, 1998).
Gross dollar values were calculated from yield and grade based upon USDA-Farm Service Agency (FSA) peanut loan schedules for each crop year. Economic analyses were performed on each of the Max and Min tests by year and location. Variable cost estimates were calculated based upon the current 2009 UGA extension service budget (Smith and Smith, 2008) for line item inputs less seed, fungicide, insecticide, and irrigation in which prices were based upon actual pesticide and rates used for each test. Each genotype was grouped into either large virginia, virginia, large runner, runner, and small runner seed size categories to better estimate the total variable cost. The 2009 variable cost for seed to plant six seed per 30.5 cm of row equaled $176/ha for small runner, $201/ha for runner, $232/ha for large runner, $289/ha for virginia, and $355/ha for large virginia.
The experimental design was a randomized complete block with six replications. Data from each individual test was subjected to analysis of variances. Waller-Duncan's T-test (k-ratio = 100) was used for mean separation of significant differences (P ≤ 0.05).
Results and Discussion
Each year, different cultivars and advanced Georgia breeding lines were evaluated in both the Max and Min field tests at Tifton and Plains, GA. Combined years and location comparisons were not possible because of significant (P ≤ 0.05) interaction between genotypes, years, and locations across Max and Min tests.
As seen in Table 1, the three year rainfall distribution during the peanut growing season was variable across years and locations which influenced plant growth and development. In general, plant growth and development in the nonirrigated Min tests were smaller and slower due to early-season drought stress (April and May) as compared to the irrigated Max tests in each year. Since no systemic insecticides were used at planting, plants in the Min tests exhibited uniformly severe insect damage from tobacco thrips (Frankliniella fusca, Hinds) feeding injury early each year but plants seemingly recovered by midseason. Tomato spotted wilt caused by TSWV was the most noticeable disease problem each year and progressively increased from midseason until digging (Tables 2– 7).
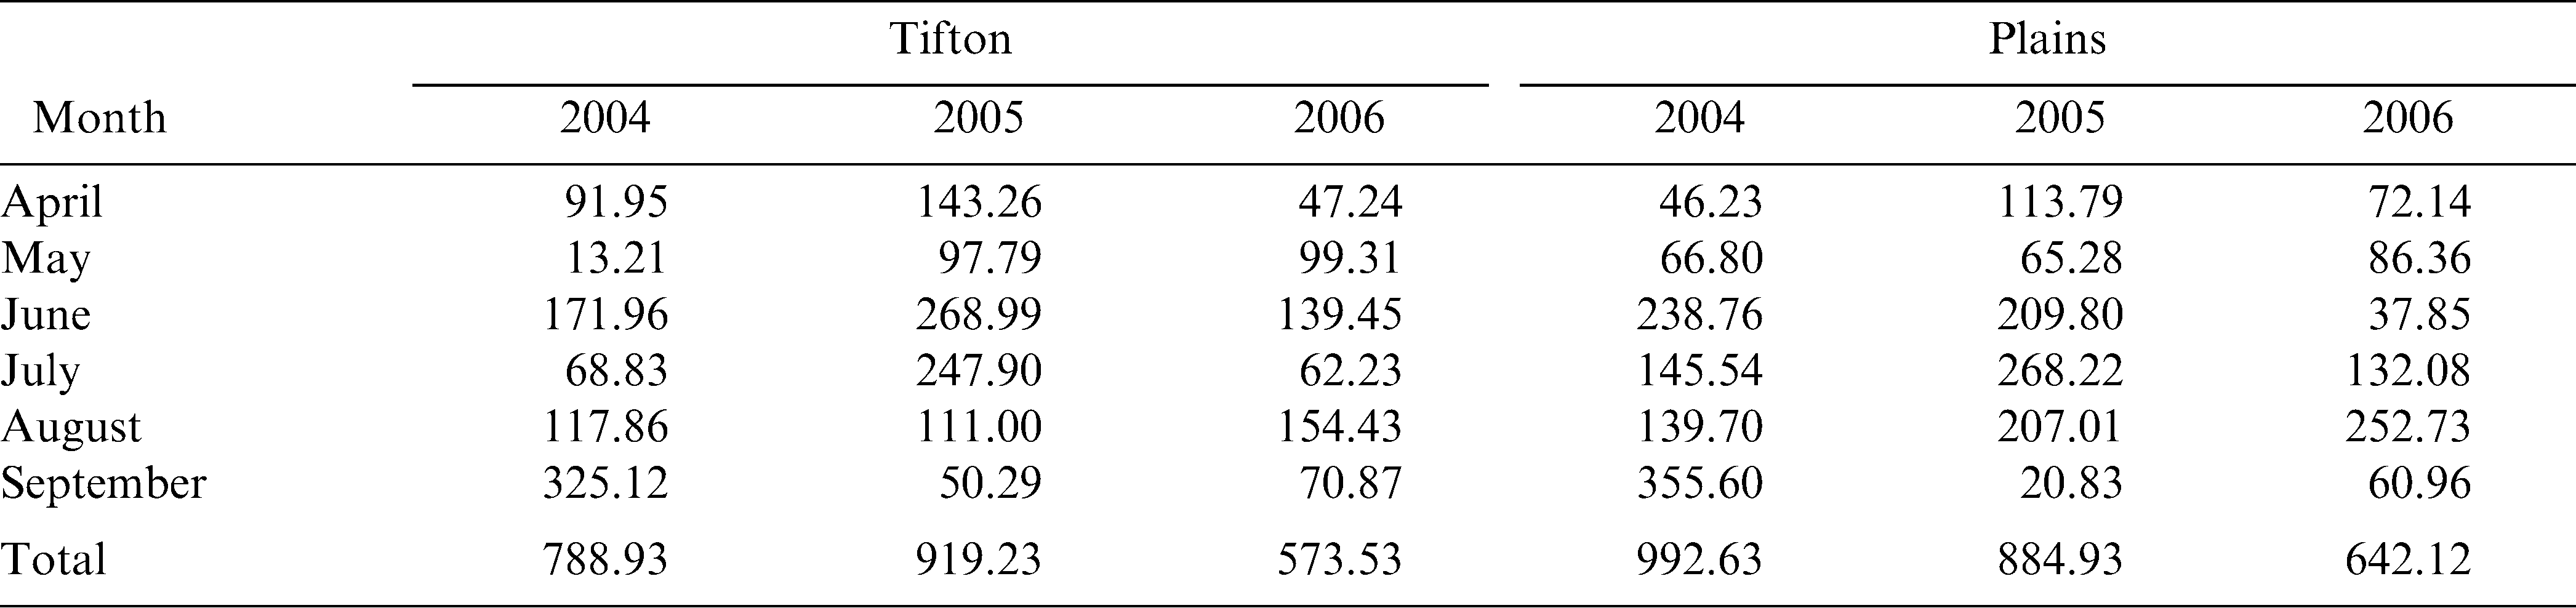
Three-year rainfall distribution (mm) during the peanut growing season for the maximum and minimum field tests at two Georgia locations, 2004–06.
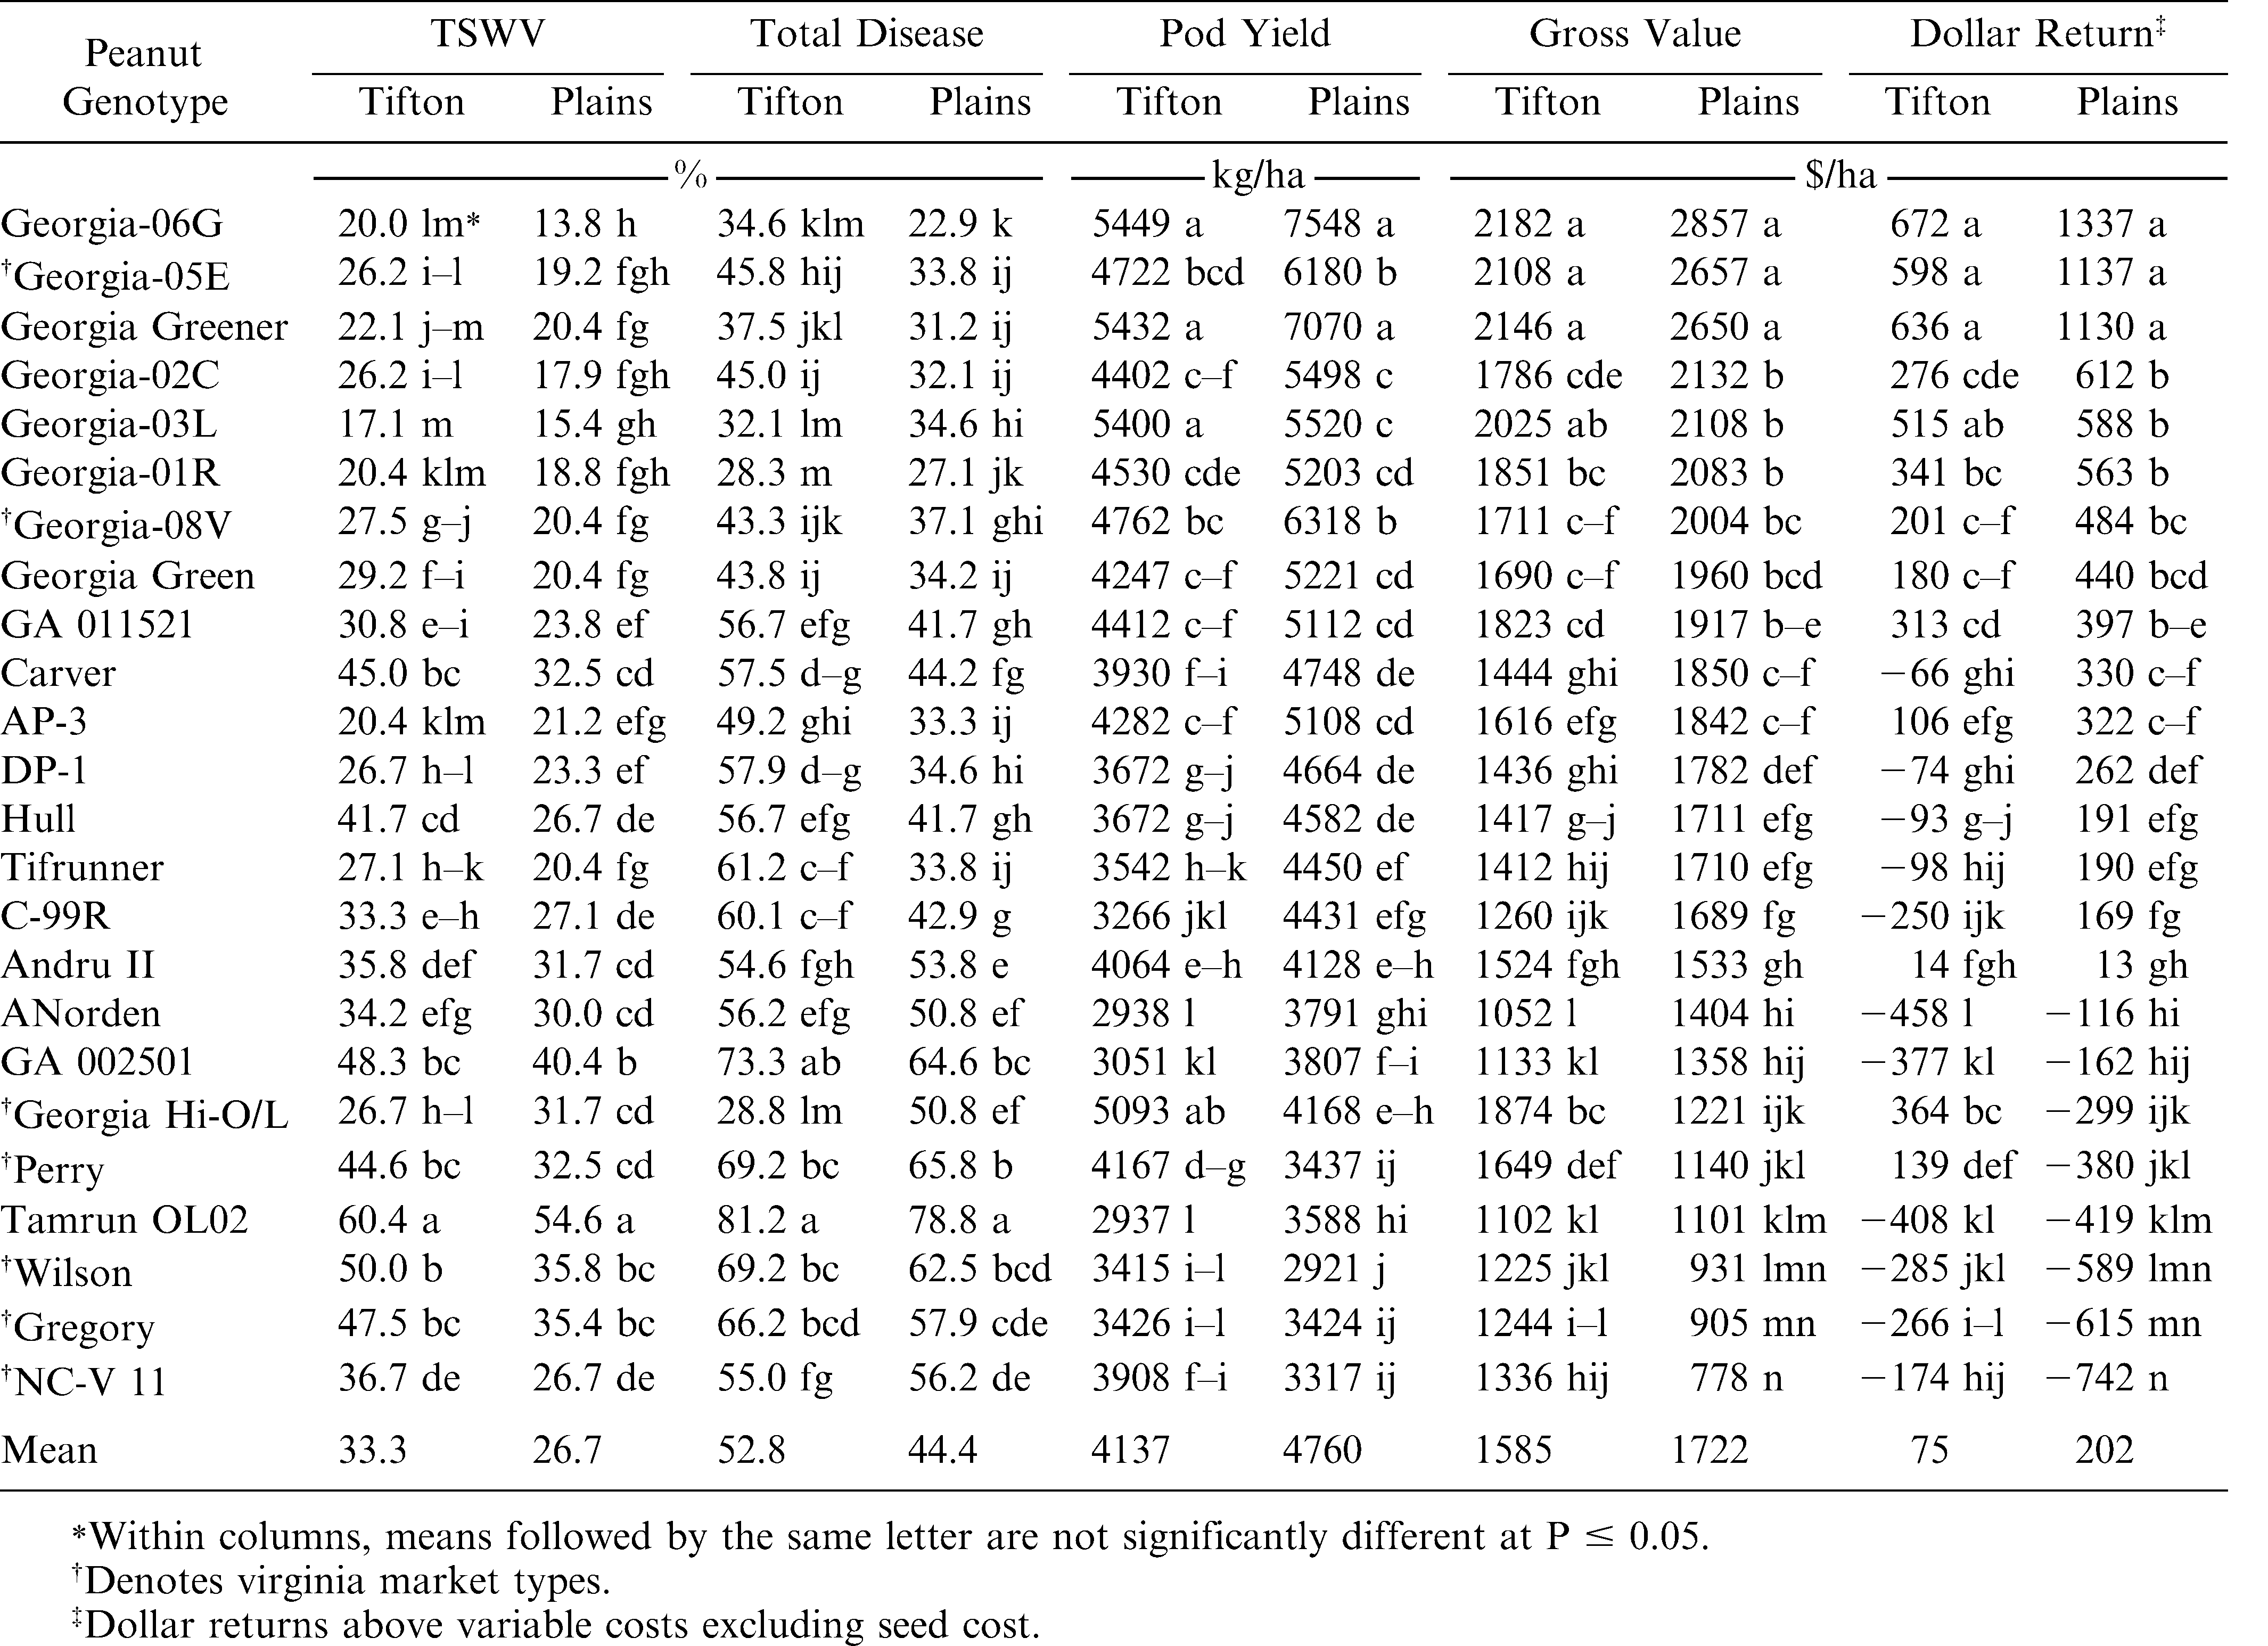
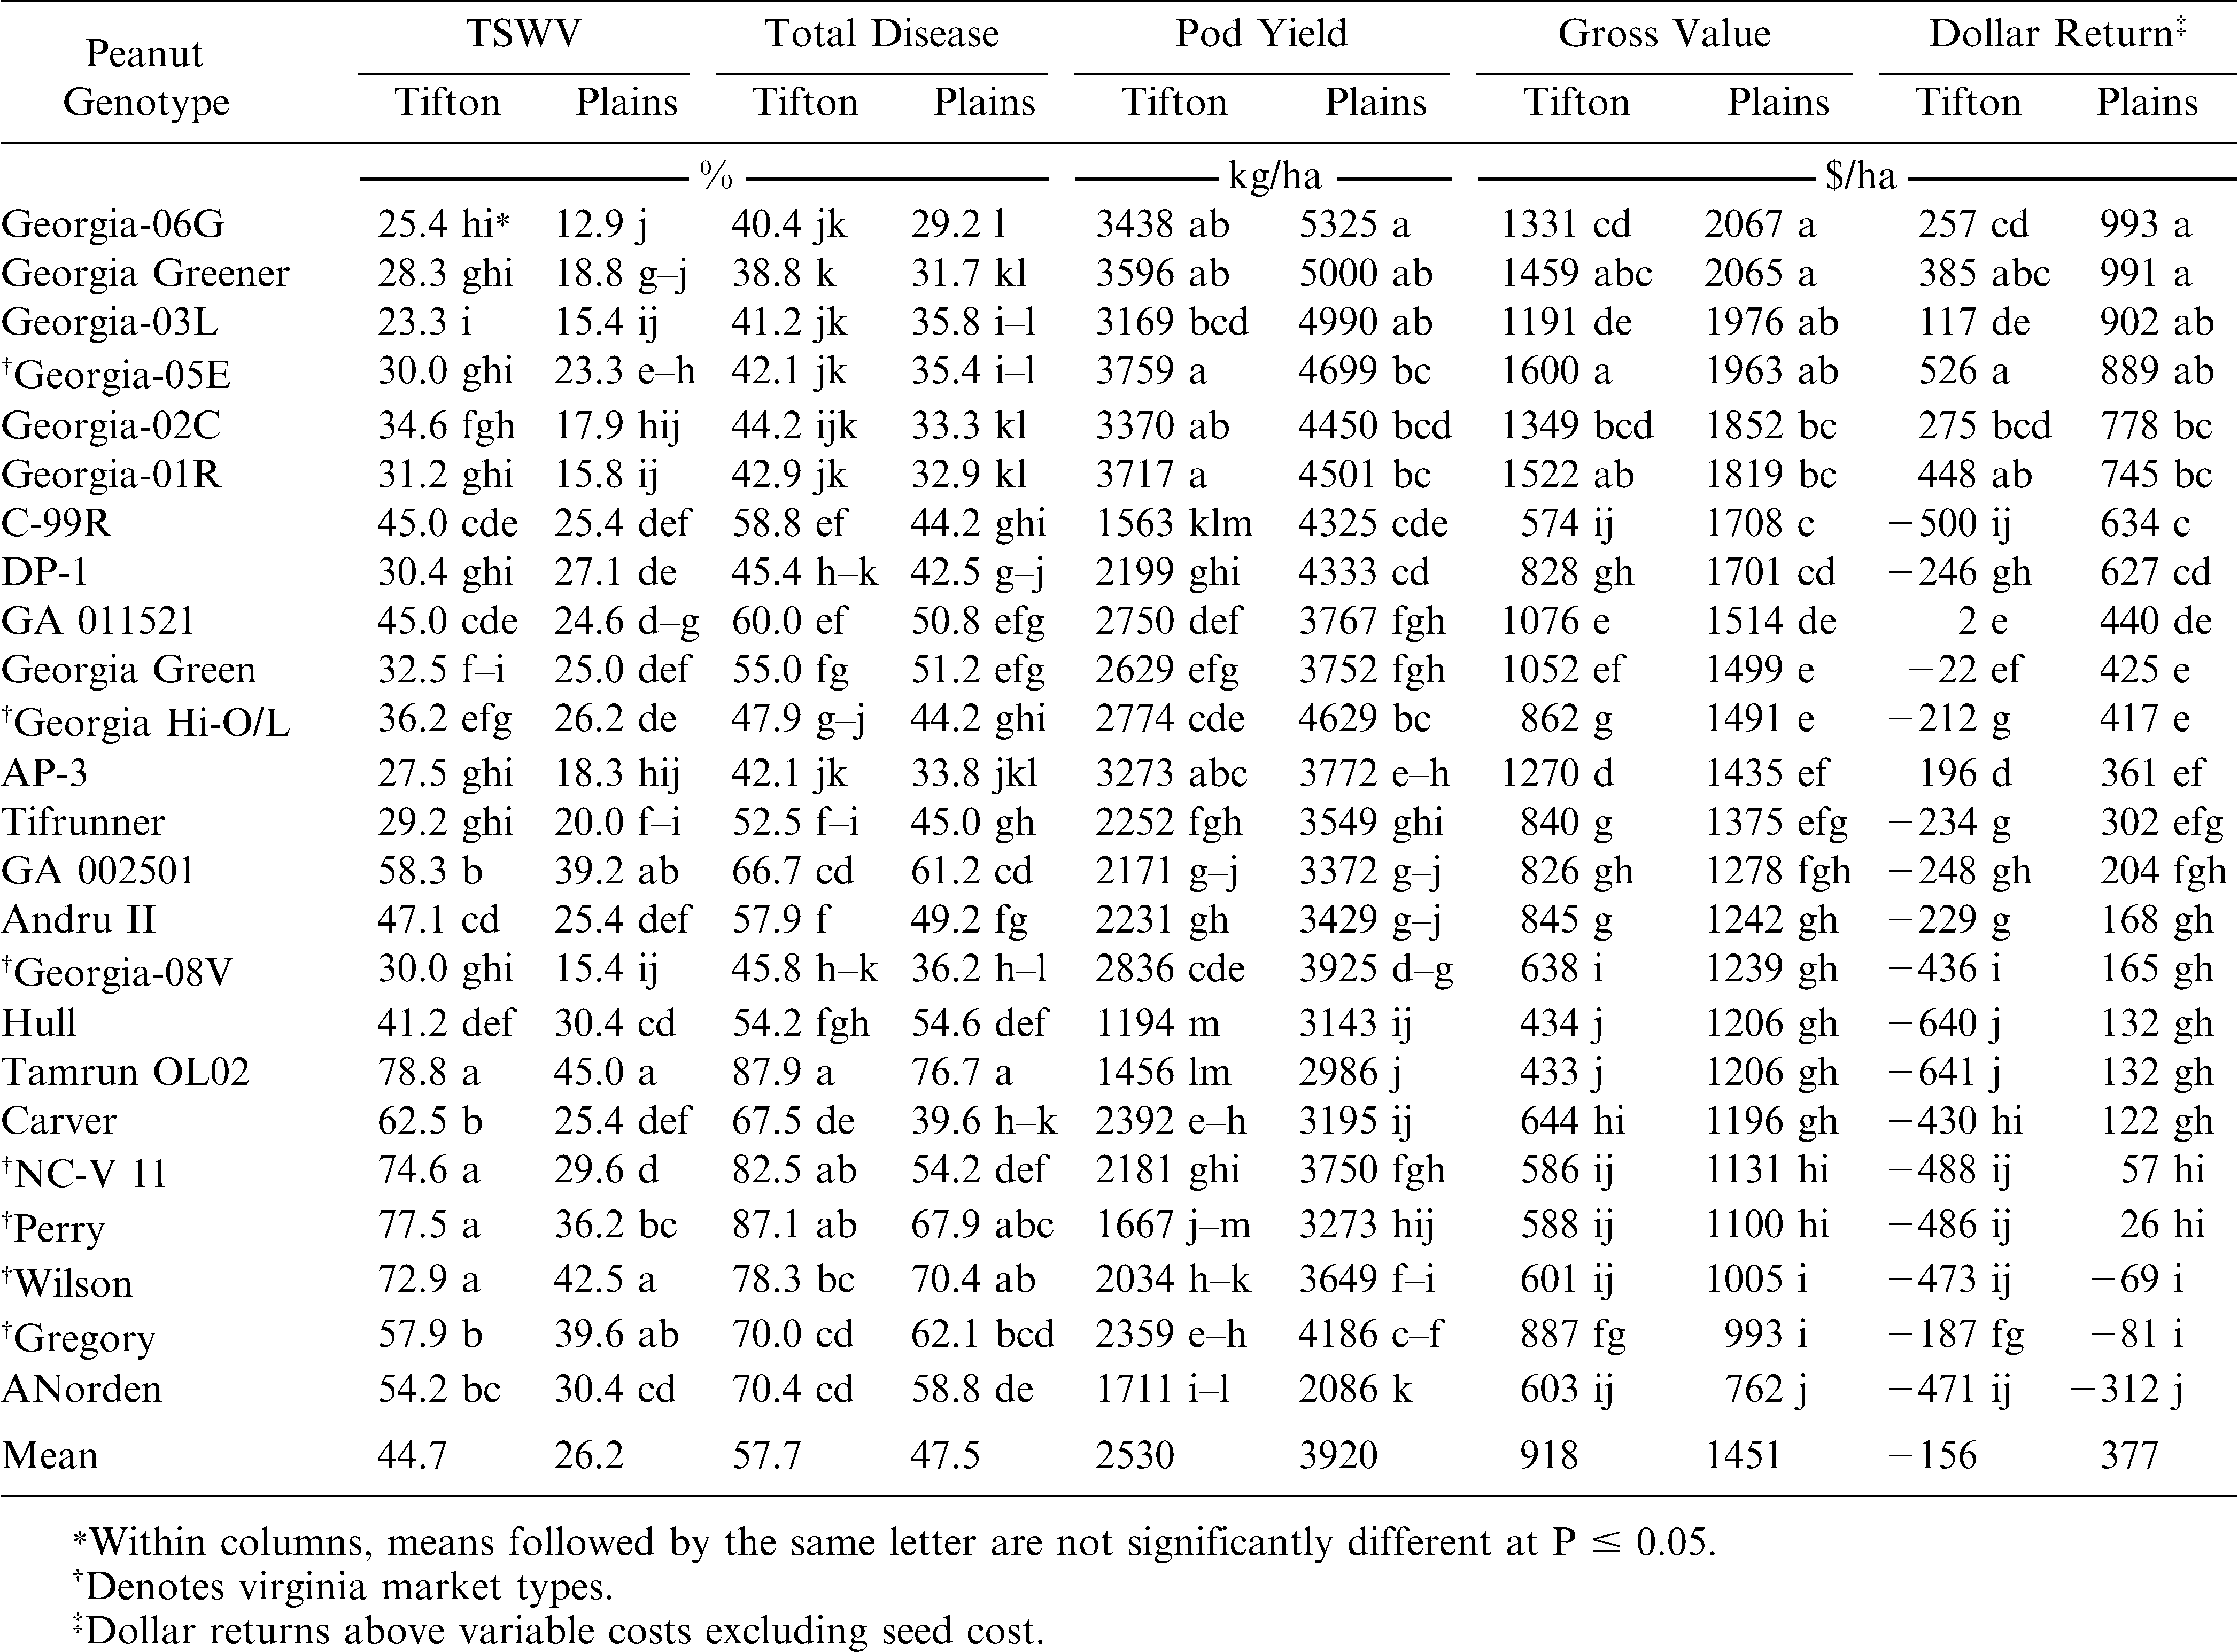
Evaluation of TSWV and total disease incidence, pod yield and dollar value among 24 peanut genotypes in early- planted maximum-input irrigated field trials at two Georgia locations, 2004.
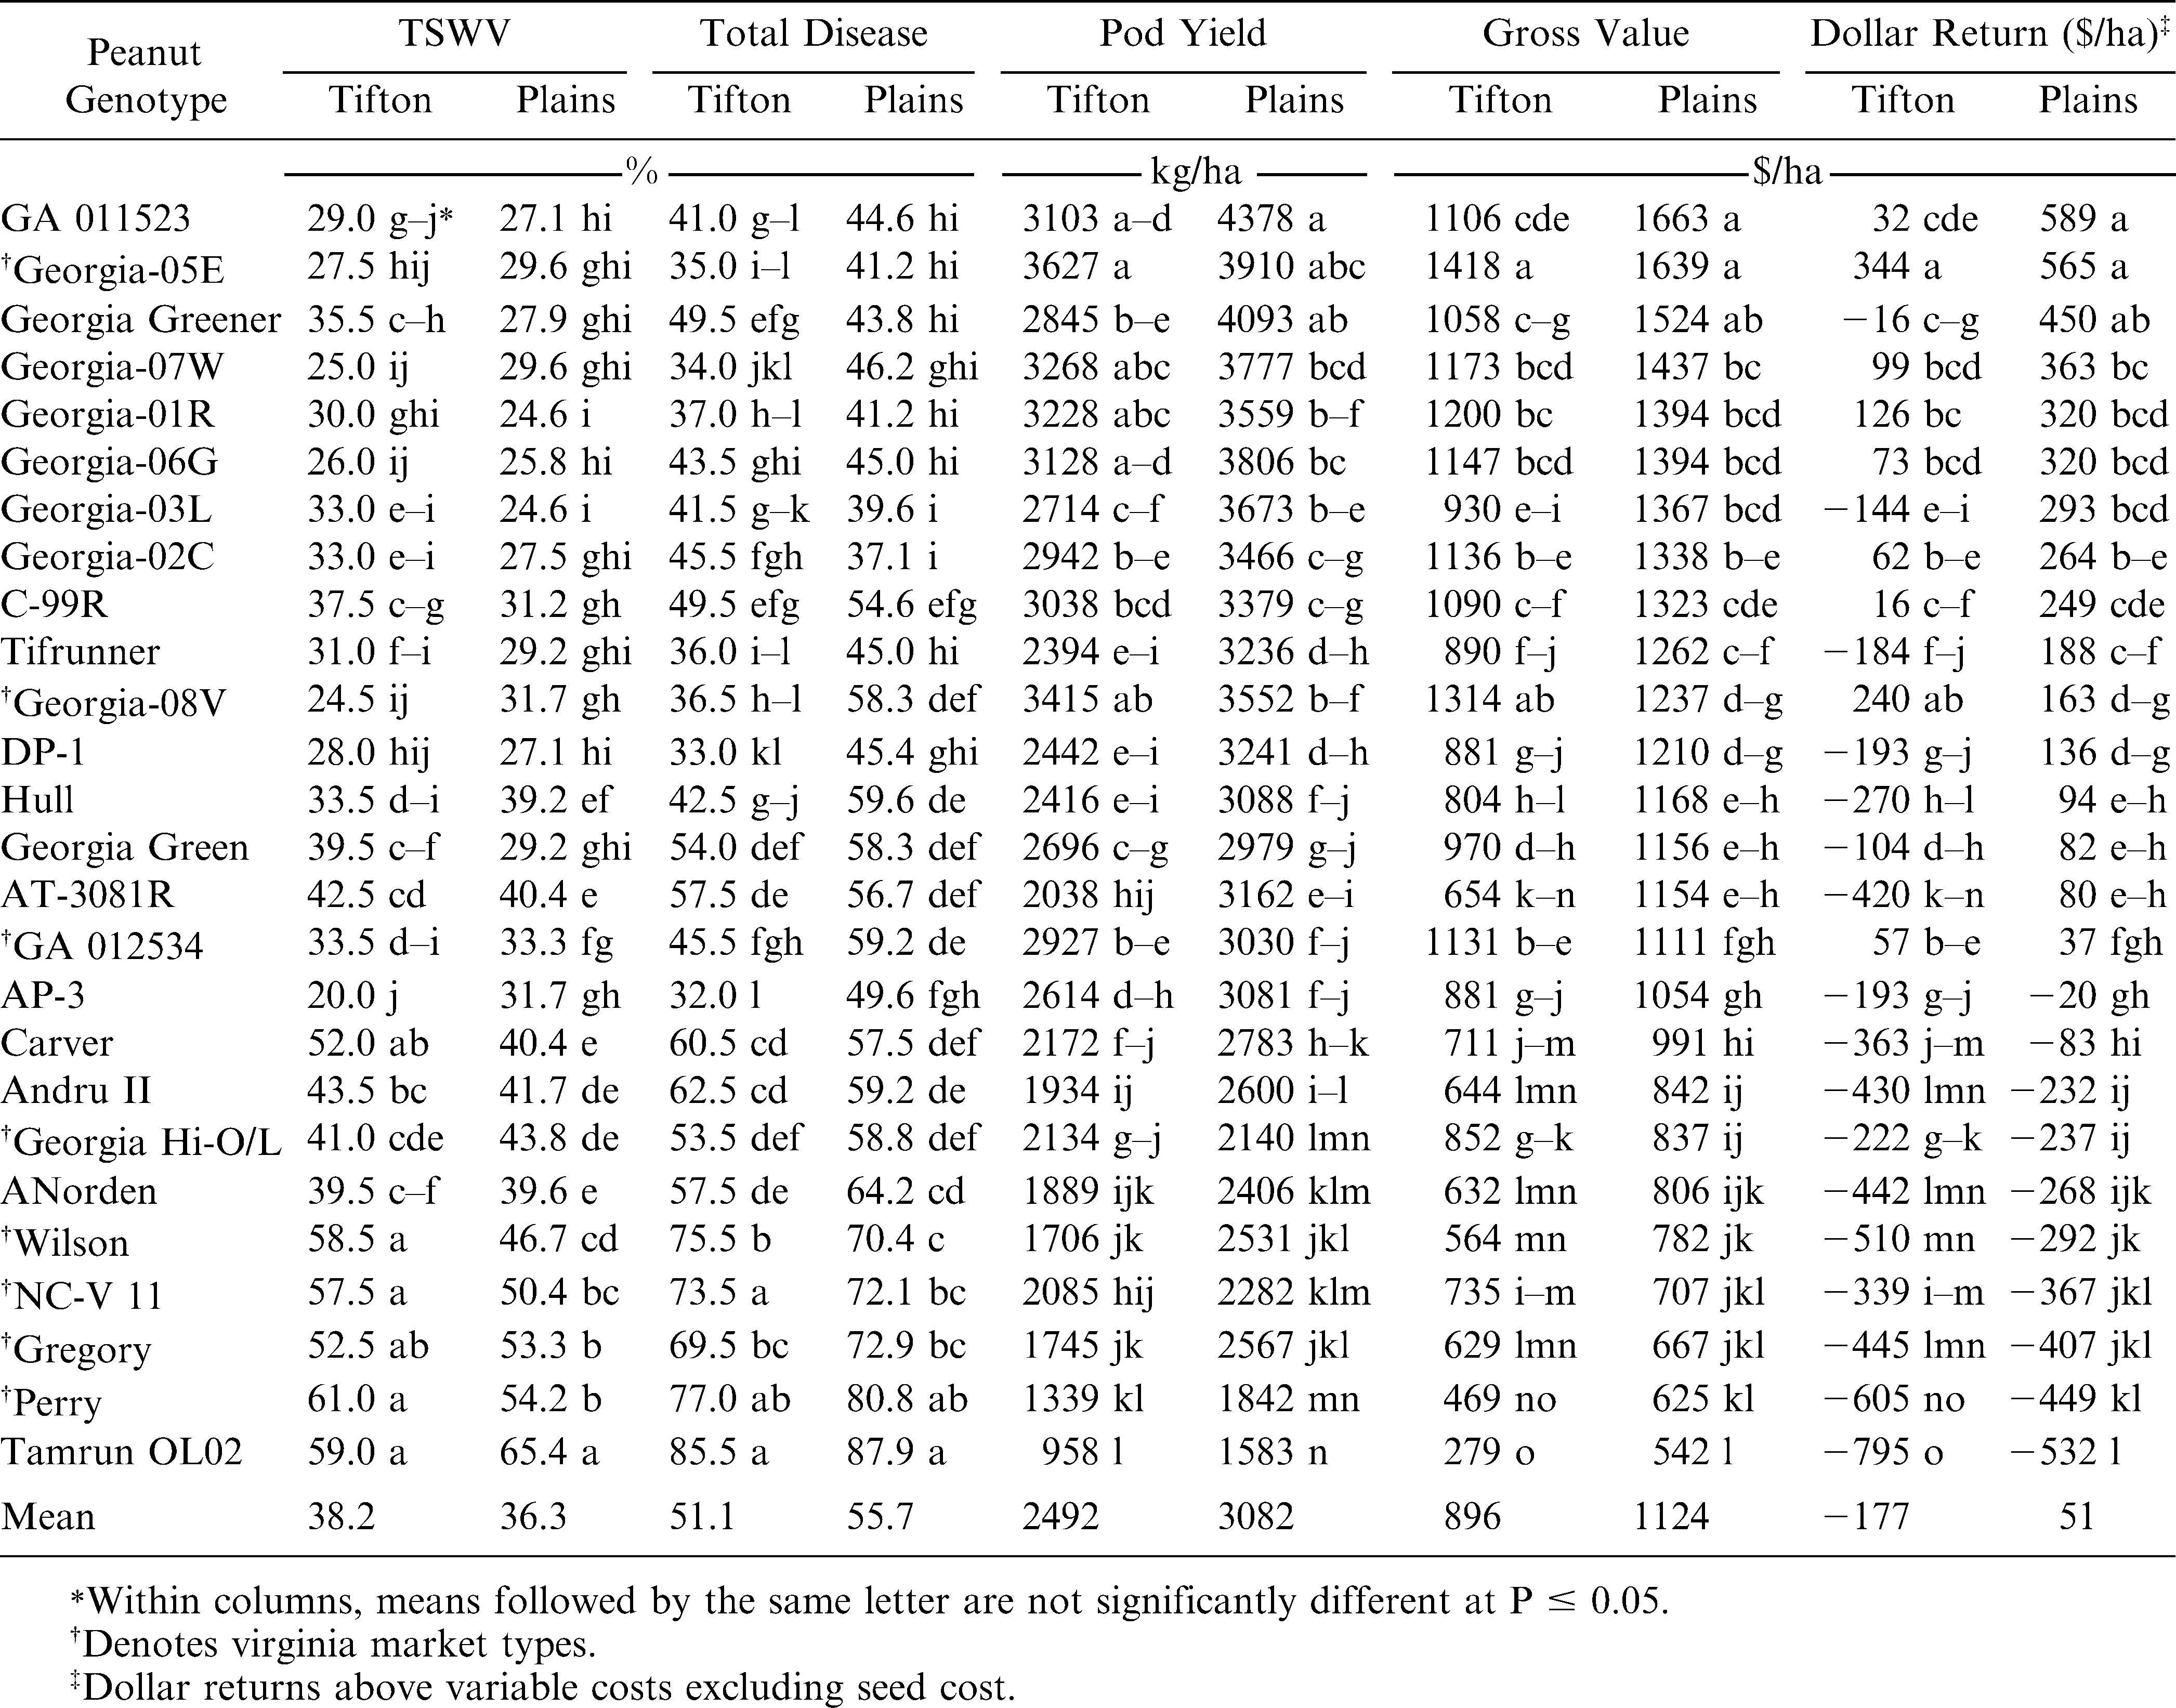
Evaluation of TSWV and total disease incidence, pod yield and dollar value among 26 peanut genotypes in early-planted maximum-input irrigated field trials at two Georgia locations, 2005.
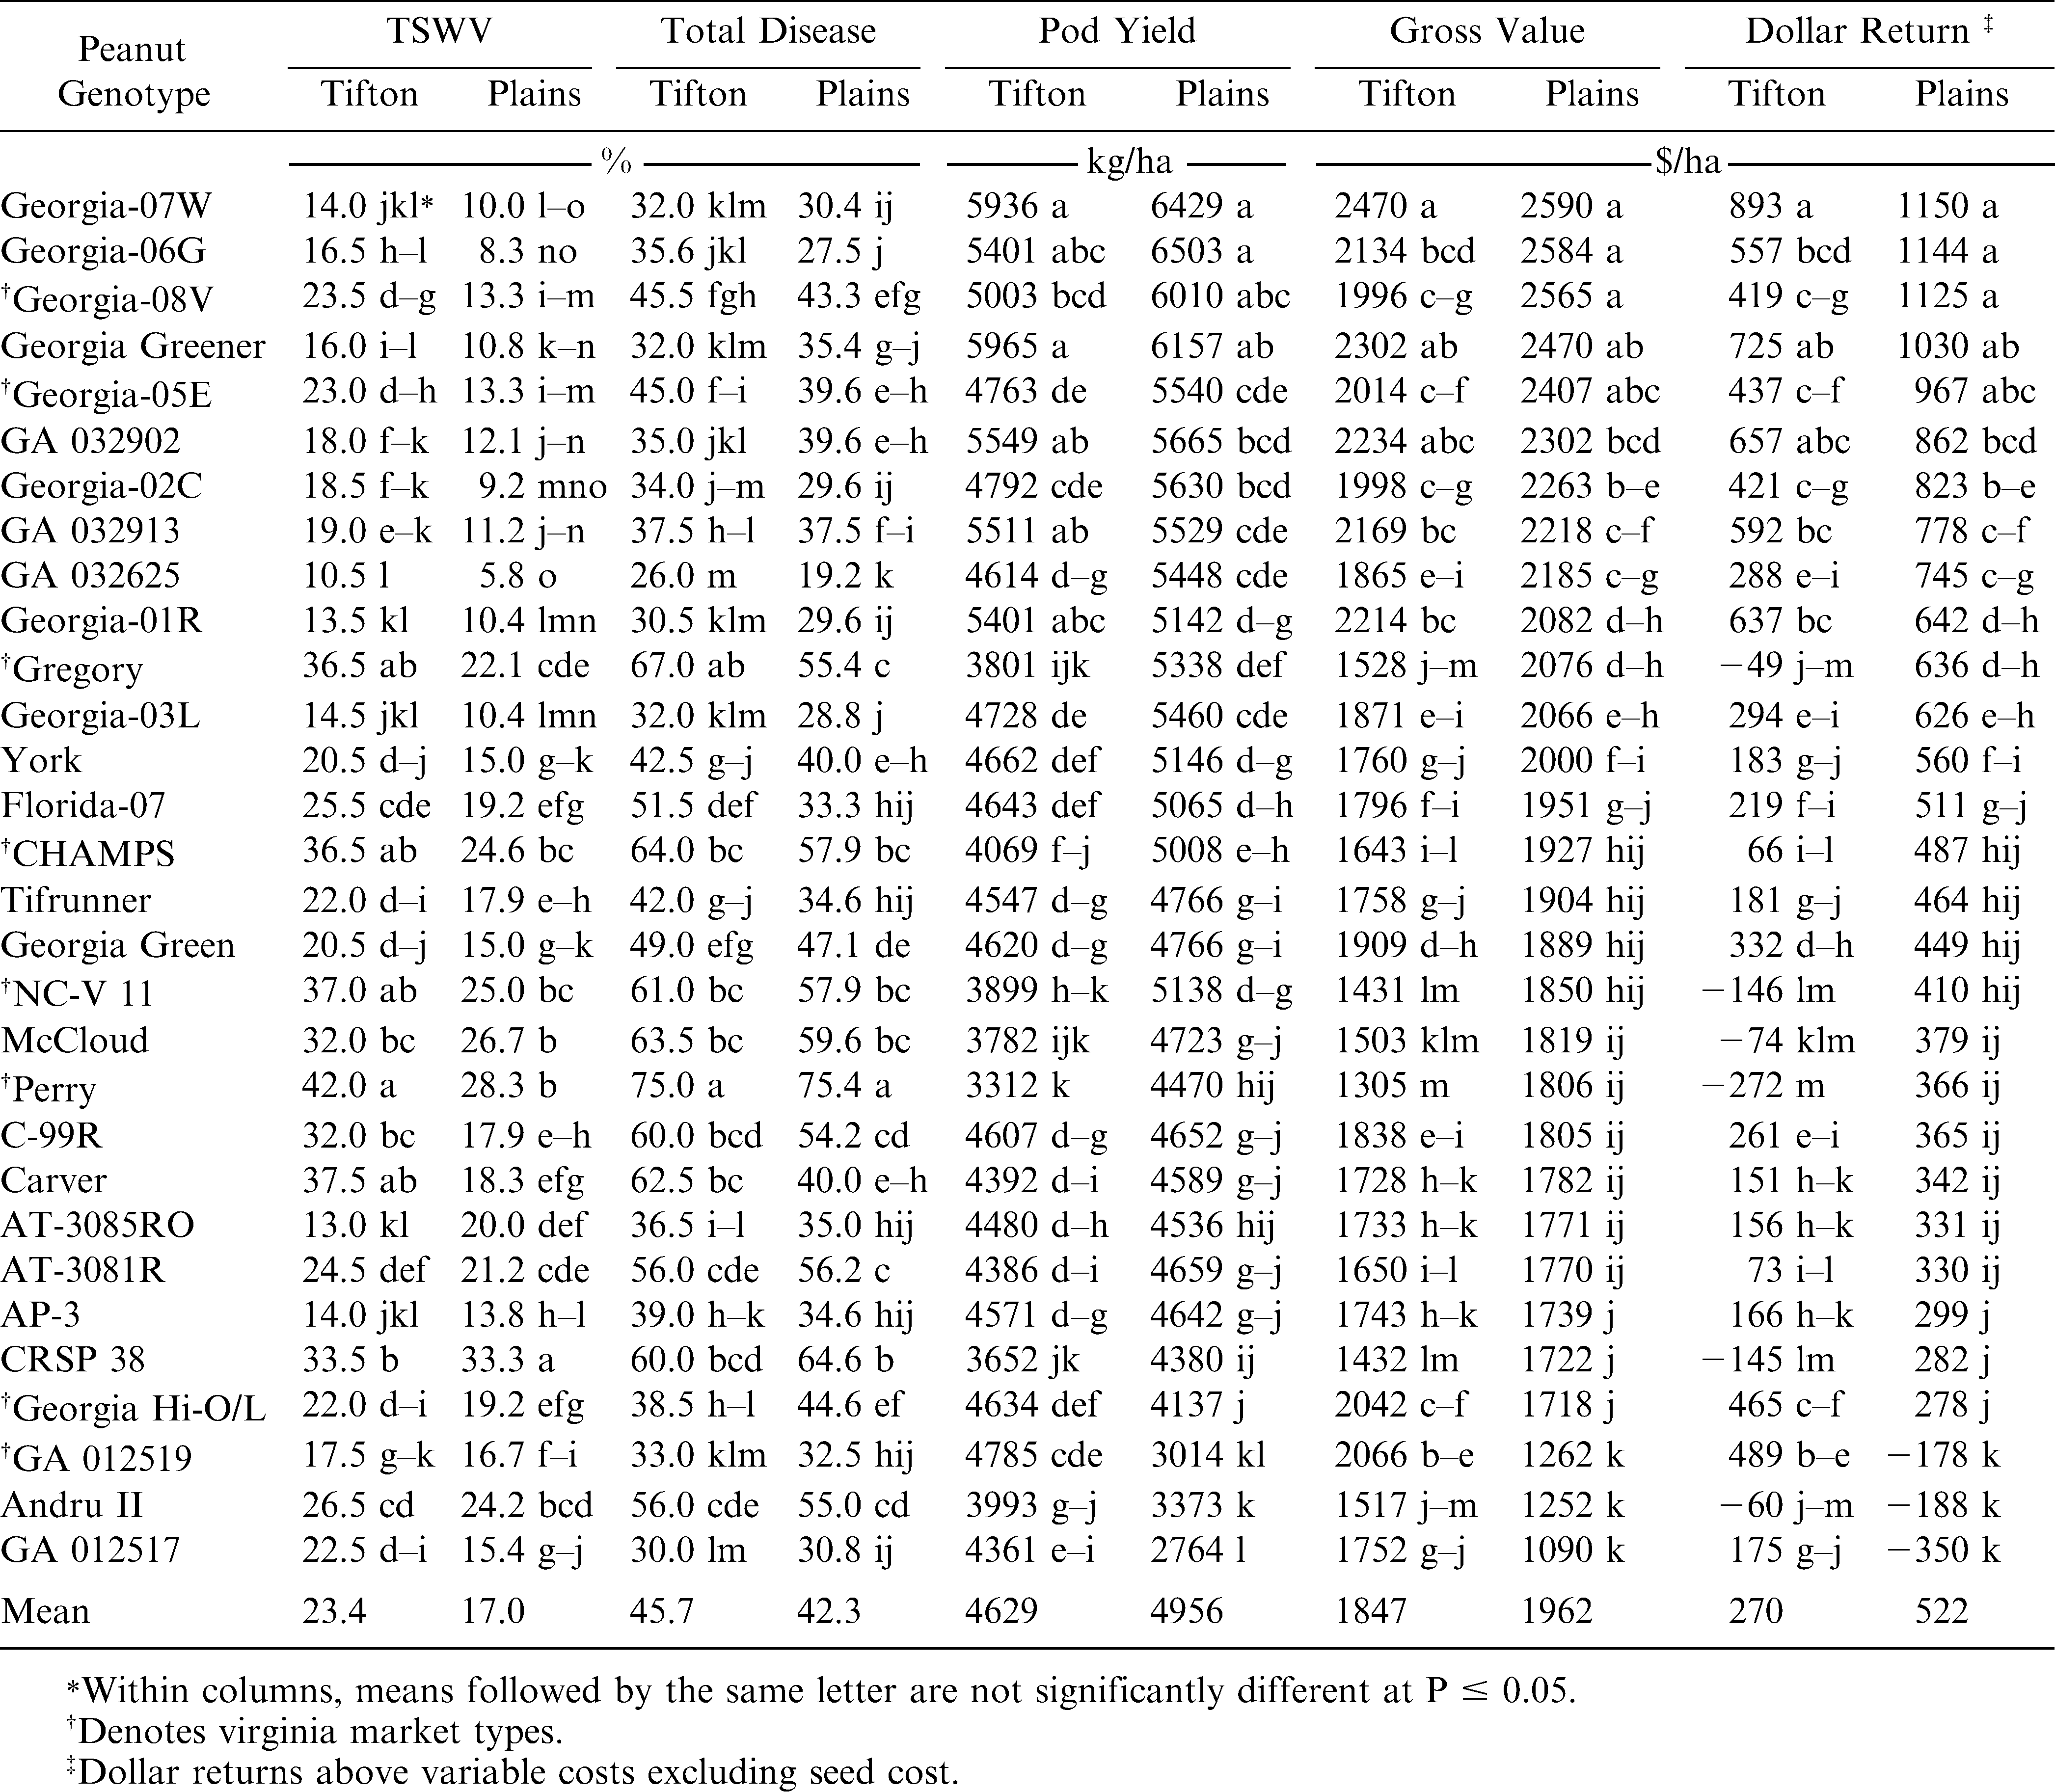
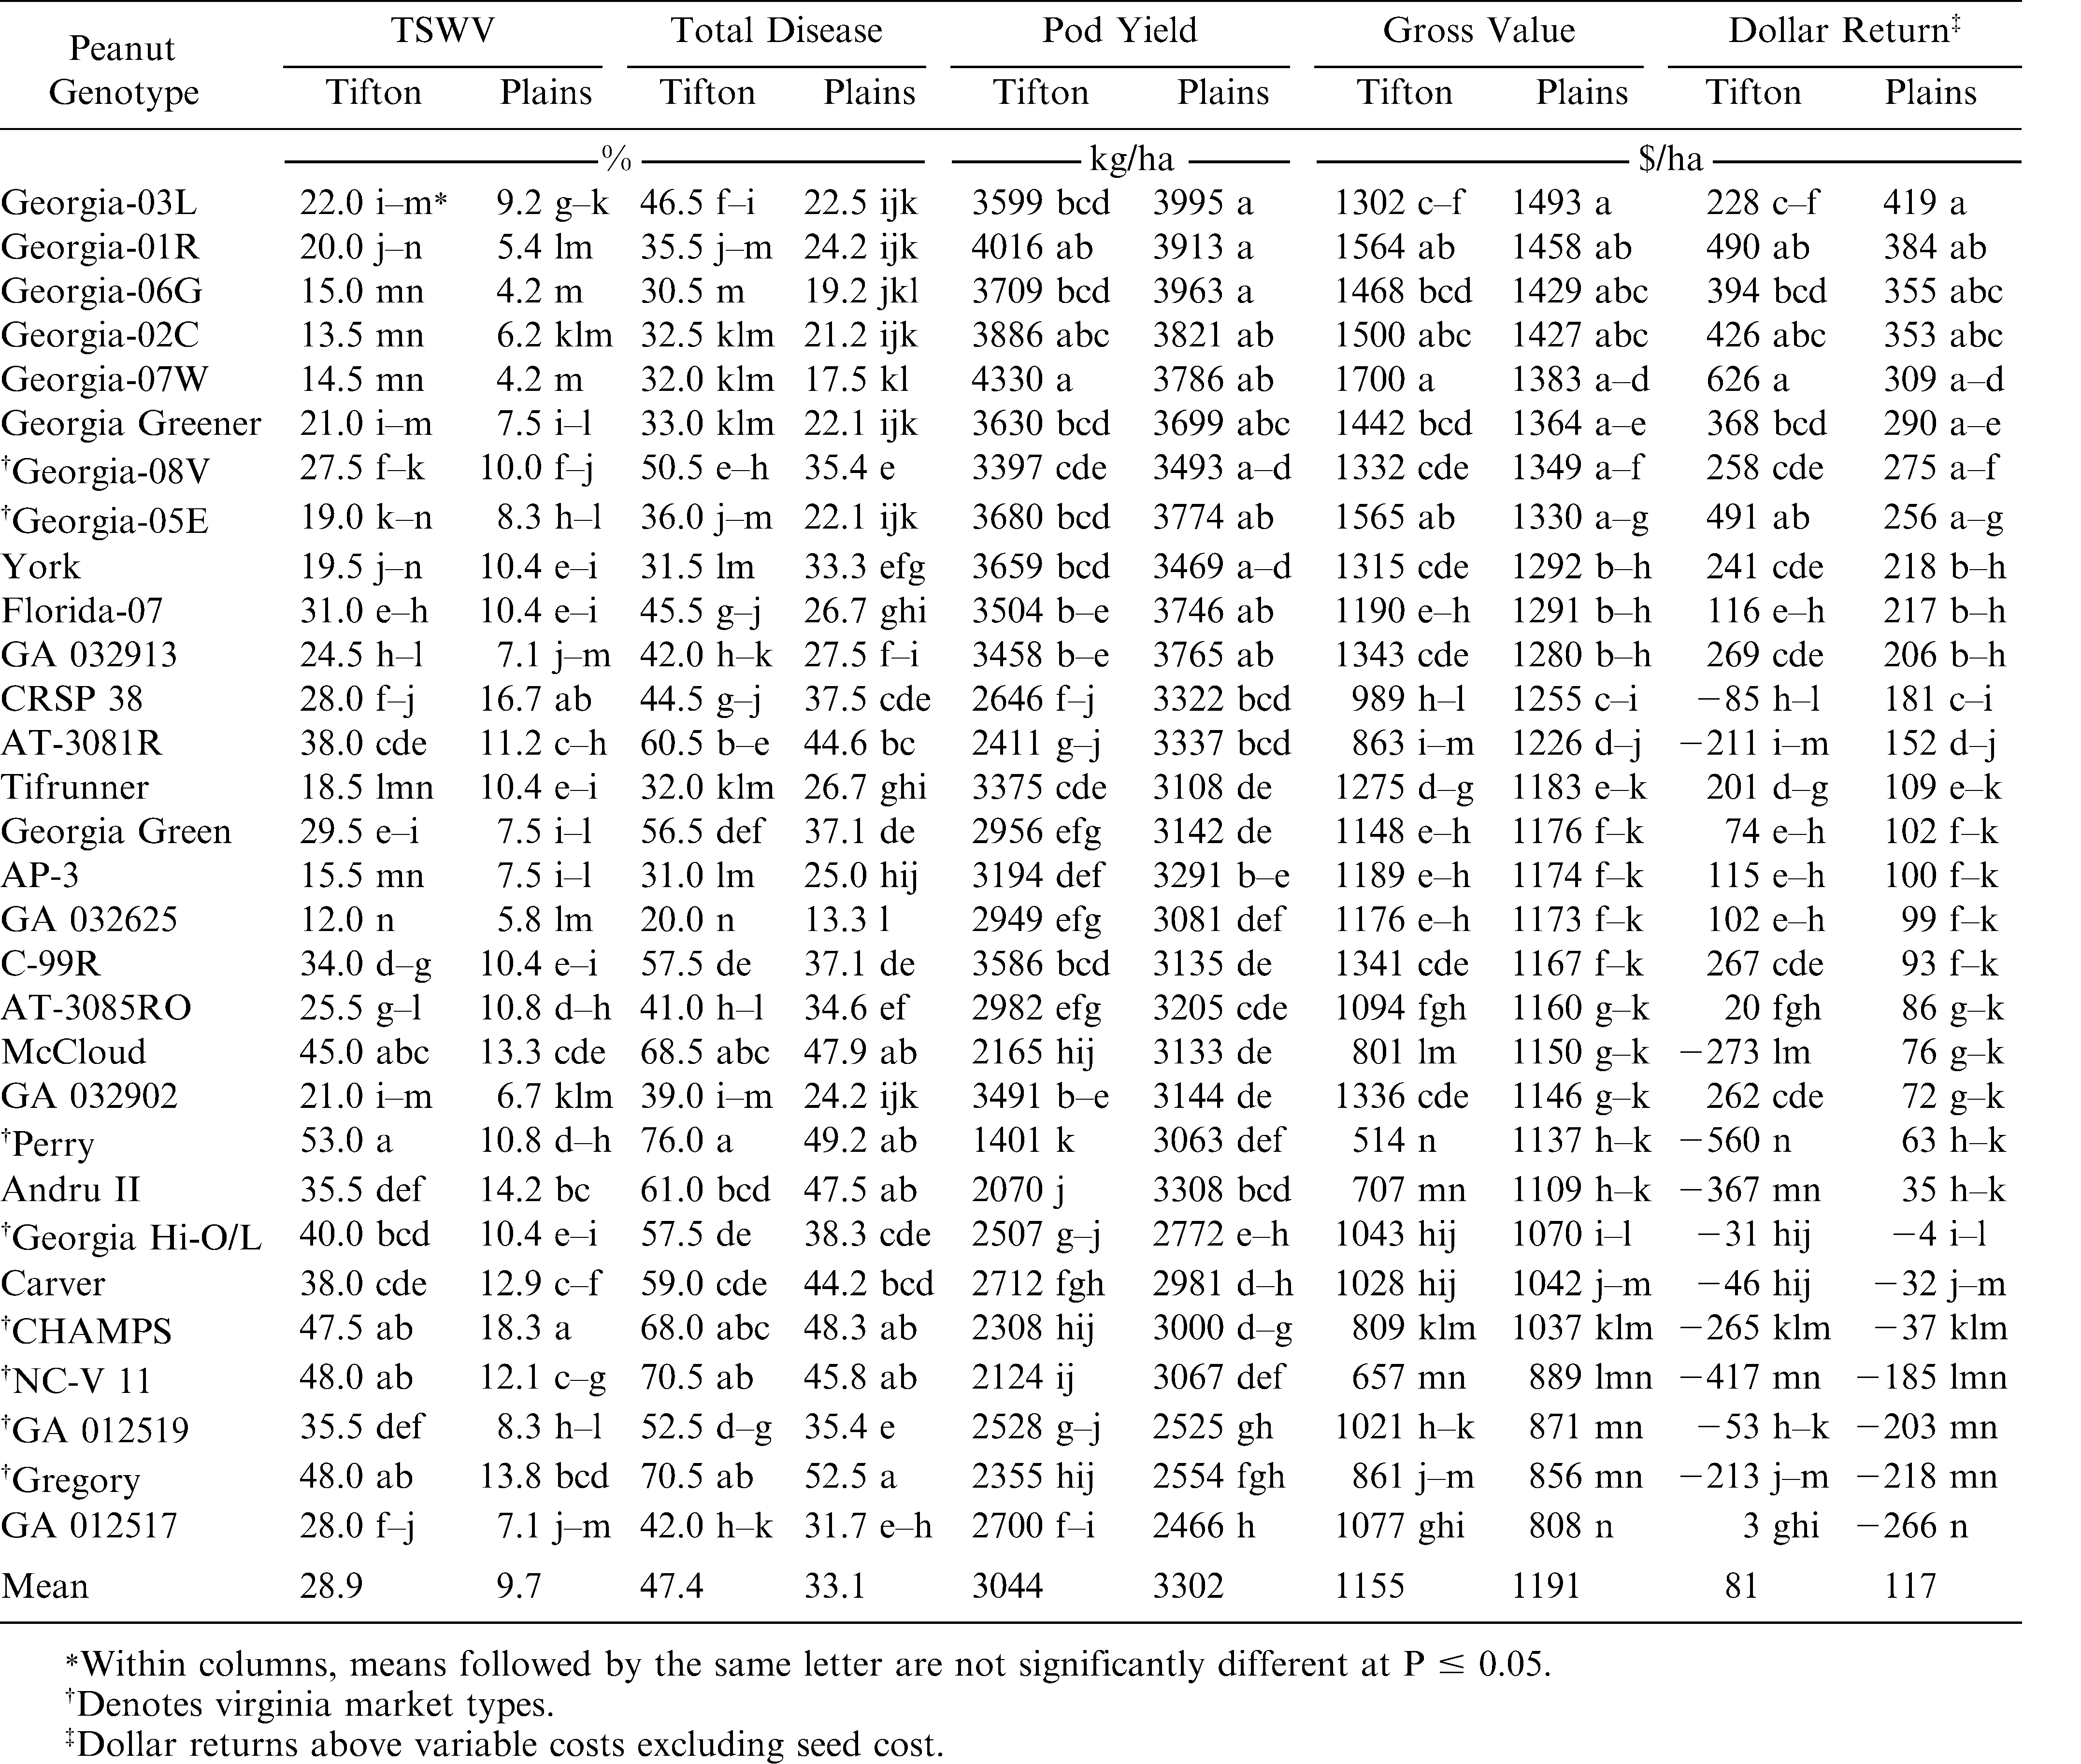
Evaluation of TSWV and total disease incidence, pod yield and dollar value among 30 peanut genotypes in early-planted maximum-input irrigated field trials at two Georgia locations, 2006.
Evaluation of TSWV and total disease incidence, pod yield and dollar value among 24 peanut genotypes in early-planted minimum-input non-irrigated field trials at two Georgia locations, 2004.
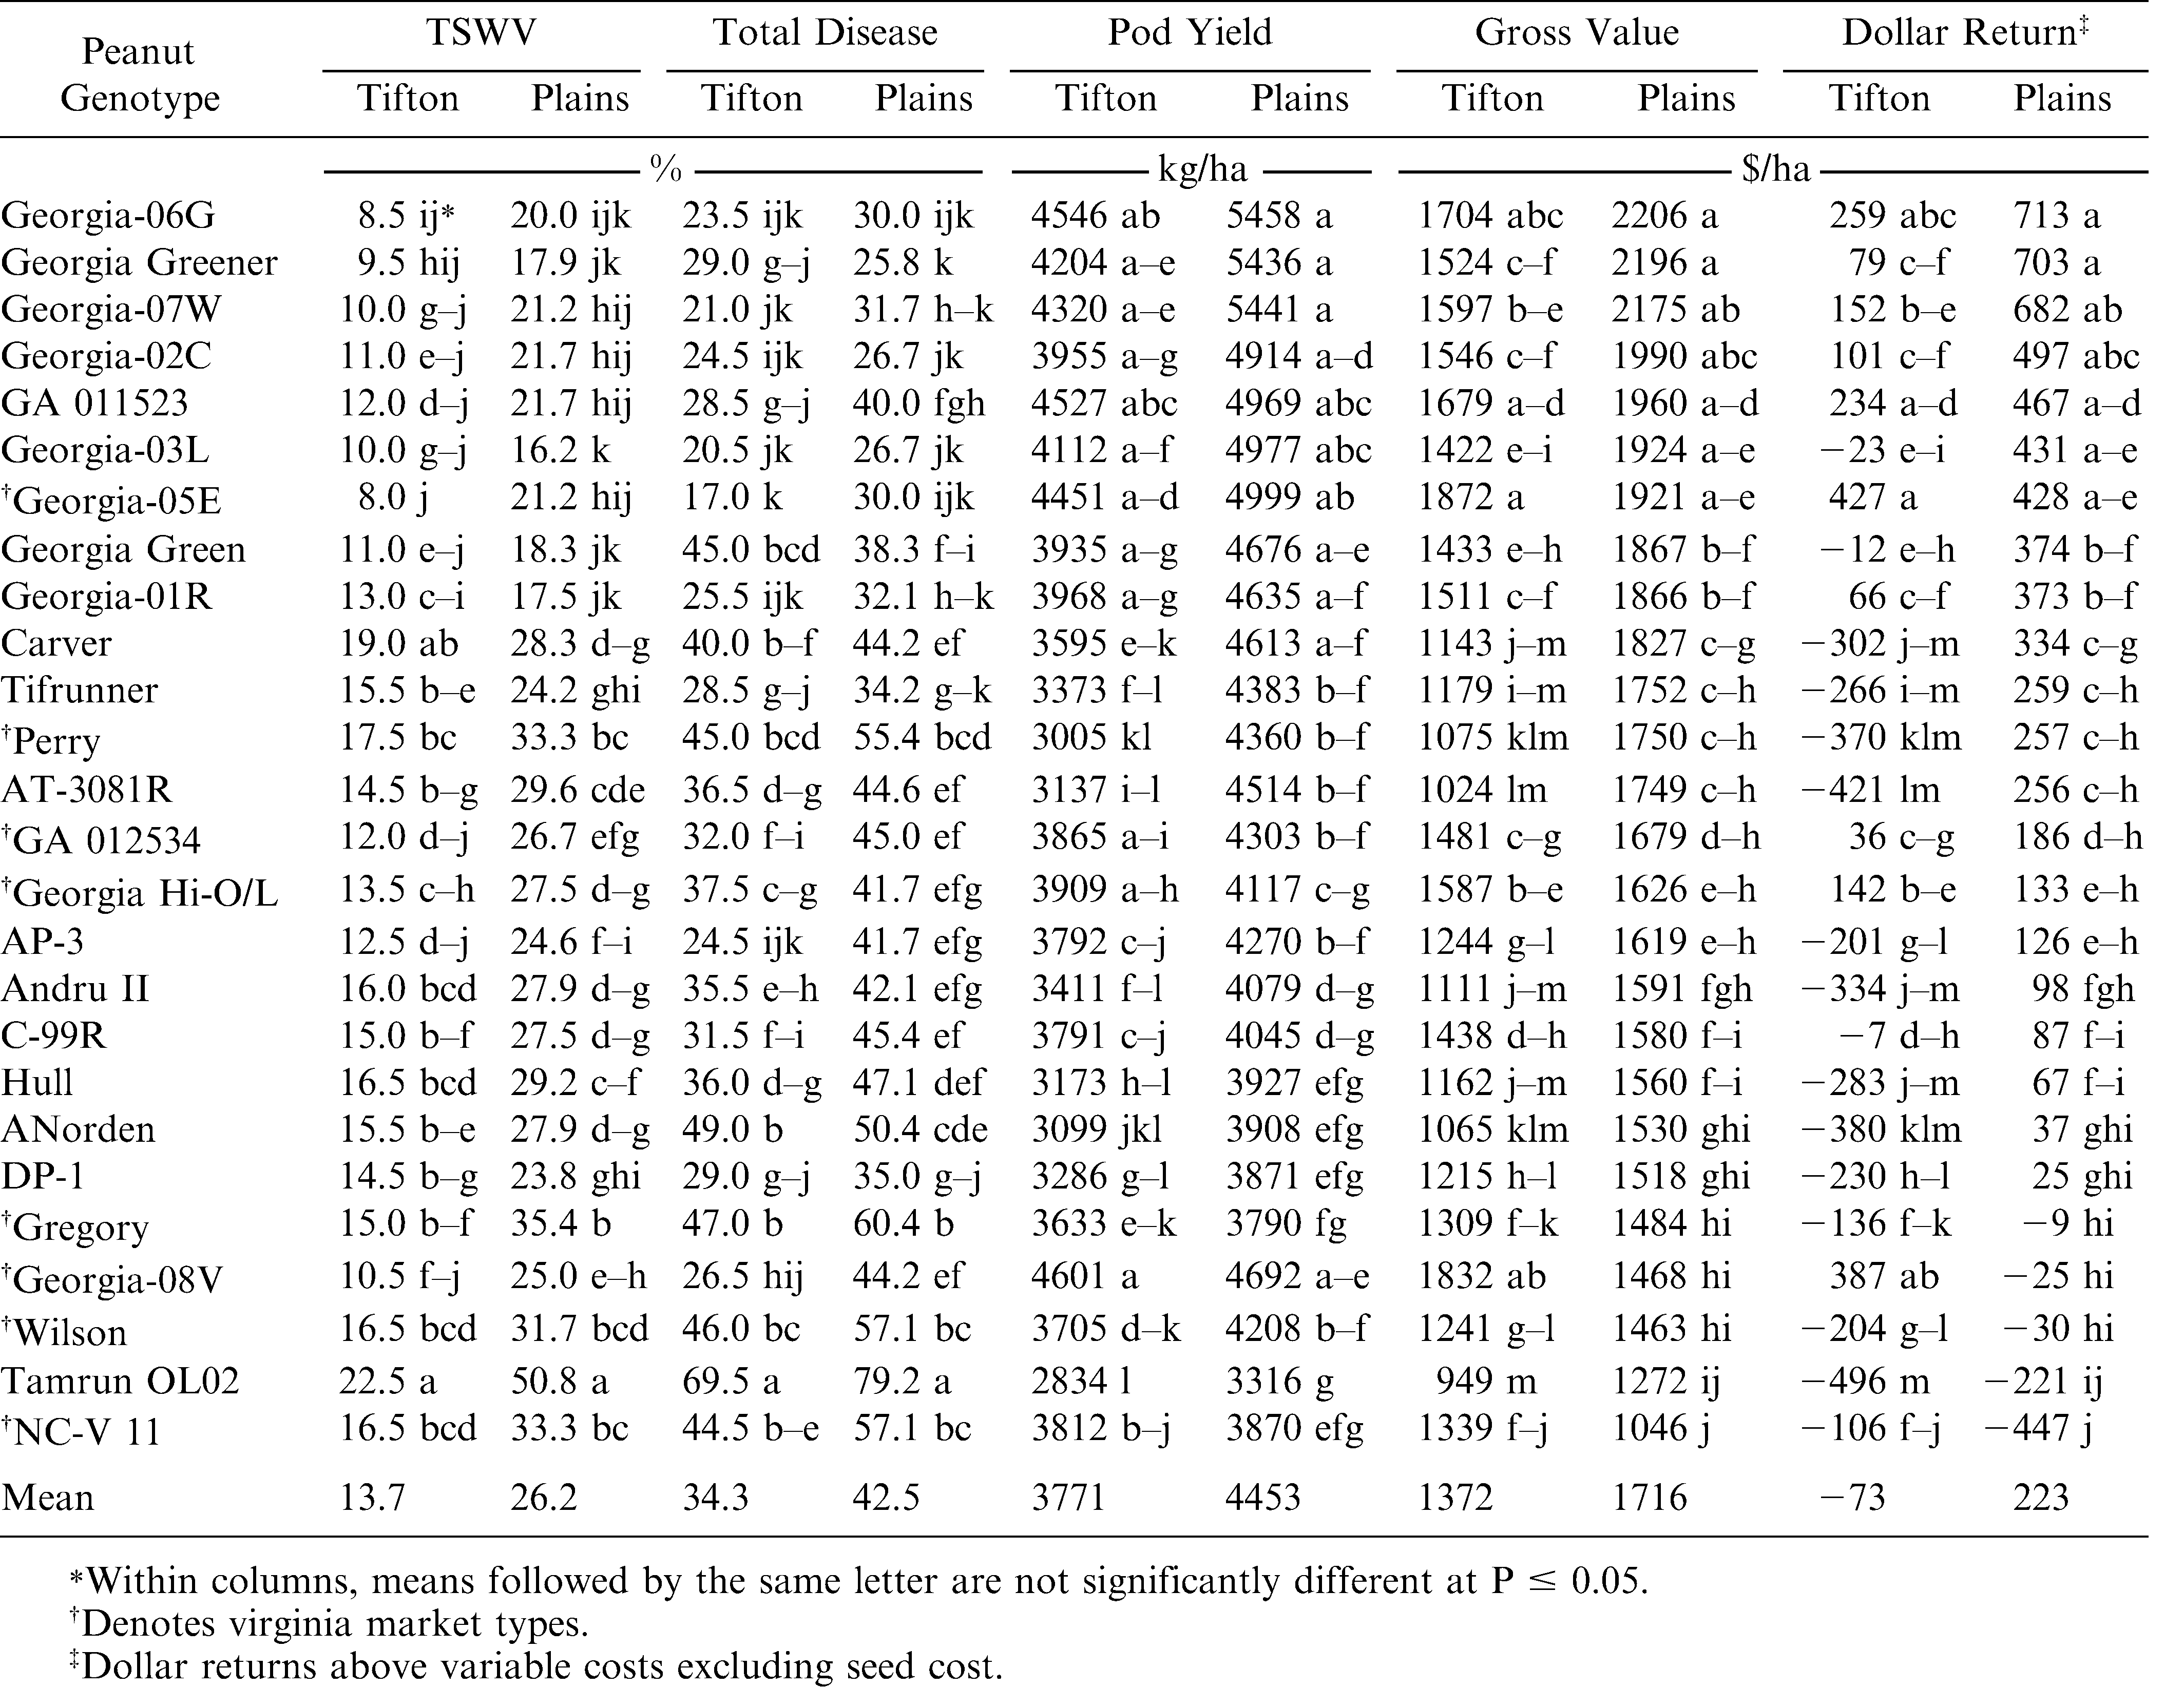
Evaluation of TSWV and total disease incidence, pod yield and dollar value among 26 peanut genotypes in early-planted minimum-input non-irrigated field trials at two Georgia locations, 2005.
Evaluation of TSWV and total disease incidence, pod yield and dollar value among 30 peanut genotypes in early-planted minimum-input non-irrigated field trials at two Georgia locations, 2006.
At midseason, incidence of Tomato spotted wilt virus (TSWV) varied from year to year (Tables 2– 7). In the Max test, the lowest TSWV incidence (best resistance) was found in ‘Georgia-03L’ (Branch, 2004) at Tifton and ‘Georgia-06G’ (Branch, 2007a) at Plains during 2004 (Table 2), in ‘Georgia-05E’ (Branch, 2006) at Tifton and Georgia-03L at Plains during 2005 (Table 3), and in the advanced Georgia breeding line, GA 032625 at both Tifton and Plains during 2006 (Table 4). In the Min test, the lowest TSWV incidence was again found in Georgia-03L at Tifton and Georgia-06G at Plains during 2004 (Table 5), in ‘AP-3’ (Gorbet, 2007) at Tifton and in ‘Georgia-01R’ (Branch, 2002) and Georgia-03L at Plains during 2005 (Table 6), and in GA 032625 at Tifton and ‘Georgia-07W’ (Branch and Brenneman, 2008) and Georgia-06G at Plains during 2006 (Table 7). TSWV for several genotypes was not different from these lowest TSWV incidence cultivars and breeding lines mentioned previously.
Prior to digging, percentage of total disease incidence also varied by year (Tables 2– 7). In the Max test, the lowest total disease incidence was found in Georgia-01R at Tifton and Georgia-06G at Plains during 2004 (Table 2), in Georgia-05E at Tifton and ‘Georgia Greener’ (Branch, 2007b) at Plains during 2005 (Table 3), and in GA 032625 at both Tifton and Plains during 2006 (Table 4). In the Min Test, the lowest total disease incidence was found in Georgia Greener at Tifton and Georgia-06G at Plains during 2004 (Table 5), in AP-3 at Tifton and in ‘Georgia-02C’ (Branch, 2003) and Georgia-03L at Plains during 2005 (Table 6), and in GA 032625 at both Tifton and Plains during 2006 (Table 7). Total disease for several other genotypes was also not different from these previously mentioned genotypes for lowest total disease incidence at each location and across years.
Highest pod yields among peanut genotypes likewise varied by year and location (Table 2– 7). In the Max test, the highest pod yields were noted for Georgia-06G, Georgia Greener, and Georgia-03L at Tifton and Georgia-06G and Georgia Greener at Plains during 2004 (Table 2), in ‘Georgia-08V’ (Branch, 2009) at Tifton and Georgia-06G, Georgia-07W, and Georgia Greener at Plains during 2005 (Table 3), and in Georgia Greener and Georgia-07W at Tifton and Georgia-06G and Georgia-07W at Plains during 2006 (Table 4). In the Min test, the highest pod yields were found in Georgia-05E and Georgia-01R at Tifton and in Georgia-06G at Plains during 2004 (Table 5), in Georgia-05E at Tifton and GA 011523 at Plains during 2005 (Table 6), and in Georgia-07W at Tifton and Georgia-03L, Georgia-06G, and Georgia-01R at Plains during 2006 (Table 7). Pod yield for several other genotypes was also not different from those mentioned above for highest pod yield.
The highest gross dollar values varied among genotypes, years, and location (Tables 2– 7). In the Max test, the highest gross dollar values were noted for Georgia-06G, Georgia Greener, and Georgia-05E at Tifton and Plains during 2004 (Table 2), in Georgia-05E at Tifton and Georgia-06G and Georgia Greener at Plains during 2005 (Table 3), and in Georgia-07W at Tifton and in Georgia-07W, Georgia-06G, and Georgia-08V at Plains during 2006 (Table 4). In the Min test, the highest gross dollar values were found in Georgia-05E at Tifton and Georgia-06G and Georgia Greener at Plains during 2004 (Table 5), in Georgia-05E at Tifton and GA 011523 and Georgia-05E at Plains during 2005 (Table 6), and in Georgia-07W at Tifton and Georgia-03L at Plains during 2006 (Table 7). Again, dollar values for several other genotypes were not different from those mentioned above for highest gross dollar values at each location and across years.
While gross dollar value is important, dollar value return above variable cost is the key economic indicator. Thus, variable cost estimates were then calculated to address the question of which genotype and input combination results in the greatest dollar return above variable cost. When seed, fungicide, insecticide, and irrigation costs were excluded, since these differed by location in the Max and Min tests, all other variable costs were the same. Based on the 2009 UGA extension service budget, the irrigated peanut variable costs less seed, fungicide, insecticide and irrigation was $985/ha. The non-irrigated peanut variable costs less seed, fungicide and insecticide was $943/ha. The 2009 fungicide, insecticide and irrigation variable cost estimates were as follows: 2004 Max tests at Tifton and Plains = $525/ha and $535/ha; 2005 Max tests at Tifton and Plains = $460/ha and $508/ha; and 2006 Max tests at Tifton and Plains = $592/ha and $455/ha, respectively (Table 8). Both Tifton and Plains were fairly similar in 2004 and 2005. However during 2006, considerably more irrigation was needed at Tifton compared to Plains due to lower rainfall (Table 1). Thus, irrigation increased the variable cost at the Tifton location and resulted in reduced dollar return above the variable costs as compared to the Plains location.
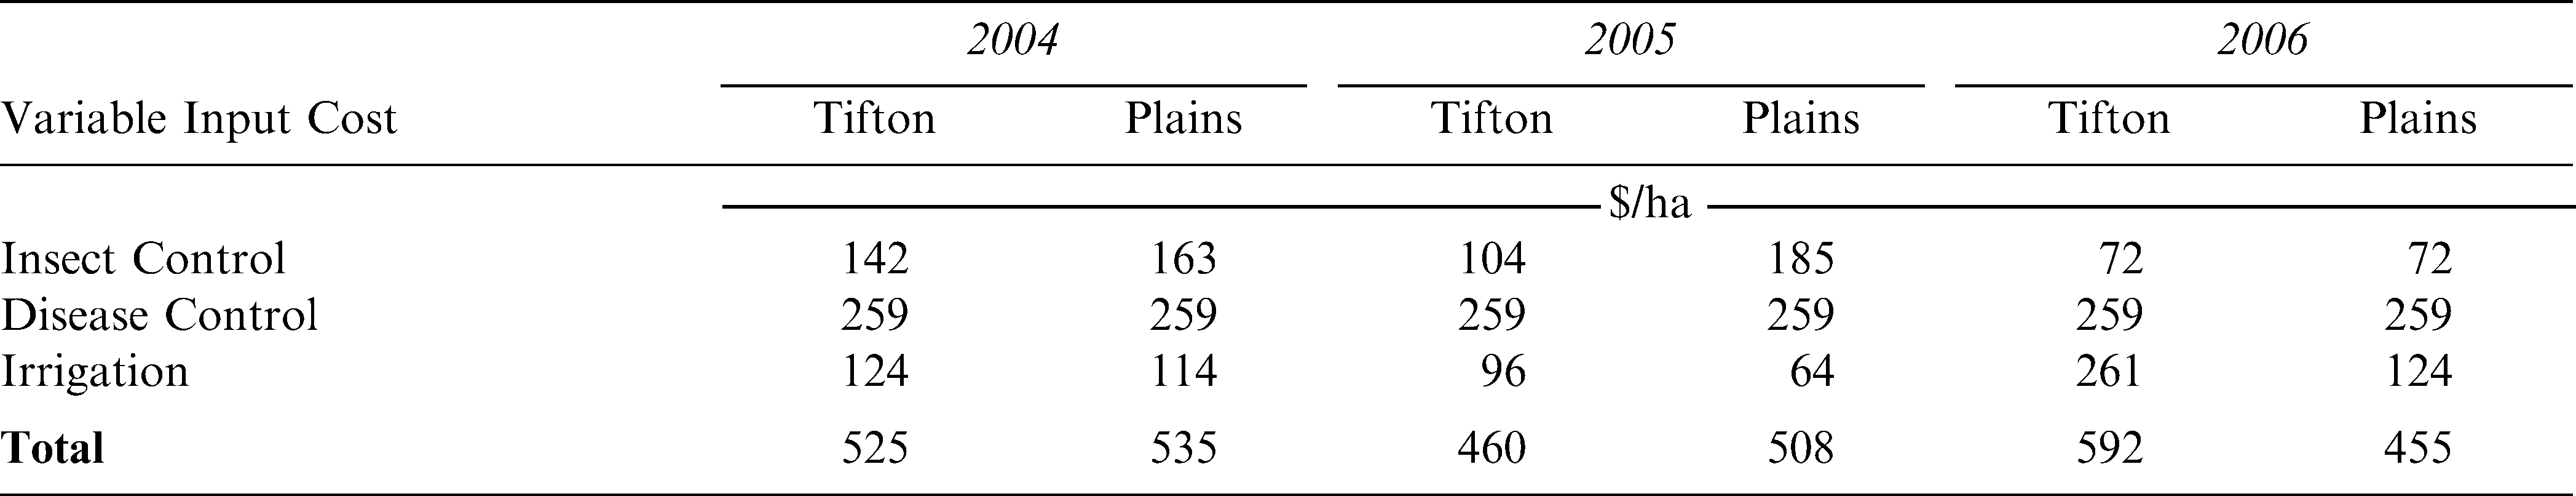
Three-year variable costs within the maximum-input irrigated field tests for insect control, disease control, and irrigation at two Georgia locations, 2004–06.
The 2009 fungicide variable cost was also calculated similarly for the Min tests but with reduced inputs compared to the Max tests. The fungicide variable cost was as follows: 2004, 2005, and 2006 Min tests at Tifton and Plains = $130/ha and $130/ha, respectively (Table 9). All of these calculated variable costs are constant within each test and location since seed cost is not included, the ranking means and significant differences (P ≤ 0.05) remained the same for both gross dollar values and dollar value returns above variable costs excluding seed cost in Tables 2– 7. While the ranking means and significant differences remain the same, a key fact is that many of the genotypes had negative dollar value returns above variable costs excluding seed cost. Another interesting finding, in general, is that the highest average dollar value returns above variable cost were found in the Max test as compared to the Min test.
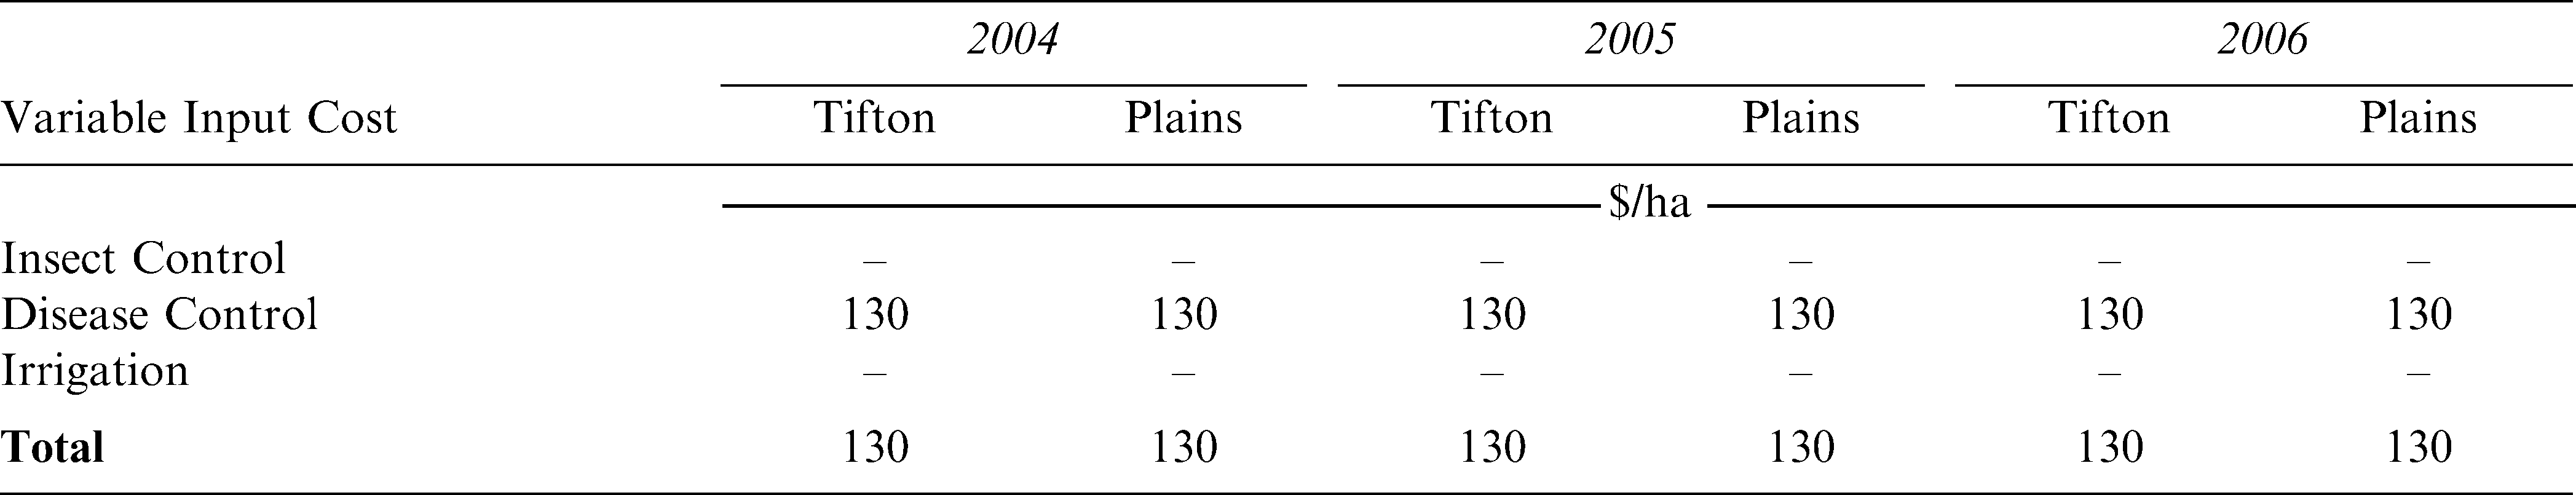
Three-year variable costs within the minimum-input non-irrigated field tests for disease control at two Georgia locations, 2004–06.
In the 2006 Max test, several newly released runner-type cultivars were compared (Table 4). Georgia-07W, Georgia-06G, Georgia Greener, and GA 032902 had significantly higher dollar value return above variable cost per hectare compared to ‘Florida-07’ (Gorbet and Tillman, 2009), ‘York’, ‘McCloud’, ‘Tifrunner’ (Holbrook and Culbreath, 2007), ‘C-99R’ (Gorbet and Shokes, 2002), ‘Carver’ (Gorbet, 2006), ‘AT-3085RO’, ‘AT-3081R’ (Anderson and Harvey, 2006), ‘AP-3’, and ‘Andru II’ (Gorbet, 2006). Also in the same 2006 Max test (Table 4), Georgia-08V had significantly higher dollar value return above variable cost per hectare compared to the other virginia-type cultivars: ‘Gregory’ (Isleib et al., 1999), ‘CHAMPS’ (Mozingo et al., 2006), ‘NC-V 11’ (Wynne et al., 1991), and ‘Perry’ (Isleib et al., 2003). Similar results were found in the 2006 Min test.
Another variable cost that must be considered is for the seed. Because peanut genotypes have different seed size, it will cost more for large-seeded genotypes to plant the same fixed number of seed per area as compared to smaller-seeded genotypes.
After deducting seed cost from the dollar return above variable cost, the highest 3-yr average return above variable cost was found with Georgia-06G and Georgia Greener in the Max tests at approximately $500/ha. However, Georgia-05E, Georgia Greener, Georgia-01R, Georgia-06G, and Georgia-02C had the highest average return above variable cost in the Min tests but at only about $200/ha which for the same cultivars is approximately half of the Max tests dollar return.
Summary
The results from this study show the variation from year-to-year, location-to-location, and genotype-to-genotype for disease incidence, pod yield, gross dollar values, and dollar value return above variable costs. The performance results likewise show the potential benefit to growers from agronomic and economic improvement with many of the newly released runner and virginia-type peanut cultivars in Georgia. Peanut growers competitiveness should be enhanced with utilization of these new and improved cultivars in both maximum and minimum production input scenarios.
Literature Cited
Anderson W. F. and Harvey J. E. 2006 Registration of ‘AT 3081R’ peanut. Crop Sci 46 : 467 – 468 .
Beasley J. P. 2008 Peanut planting dates. In Prostko E. P. (ed.) 2008 Peanut Update. Univ. of Georgia Coop. Ext. Rept CSS-08-0114 : 6 – 9 .
Branch W. D. 2002 Registration of ‘Georgia-01R’ peanut. Crop Sci 42 : 1750 – 1751 .
Branch W. D. 2003 Registration of ‘Georgia-02C’ peanut. Crop Sci 43 : 1883 – 1884 .
Branch W. D. 2004 Registration of ‘Georgia-03L’ peanut. Crop Sci 44 : 1485 – 1486 .
Branch W. D. 2006 Registration of ‘Georgia-05E’ peanut. Crop Sci 46 : 2305 .
Branch W. D. 2007a Registration of ‘Georgia-06G’ peanut. J. Plant Reg 1 : 120 .
Branch W. D. 2007b Registration of ‘Georgia Greener’ peanut. J. Plant Reg 1 : 121 .
Branch W. D. 2009 Registration of ‘Georgia-08V’ peanut. J. Plant Reg 3 : 143 – 145 .
Branch W. D. and Brenneman T. B. 2008 Registration of ‘Georgia-07W’ peanut. J. Plant Reg 2 : 88 – 91 .
Branch W. D. and Culbreath A. K. 2008 Disease and insect assessment of candidate cultivars for potential use in organic peanut production. Peanut Sci 35 : 61 – 66 .
Branch W. D. and Fletcher S. M. 2001 No-pesticide preliminary yield trials in peanut. Peanut Sci 28 : 21 – 24 .
Culbreath A. , Beasley J. , Kemerait B. , Prostko E. , Brenneman T. , Smith N. , Tubbs S. , Paz J. , Olatinwo R. , Tillman B. , Gevens A. , Weeks R. , and Hagan A. In Prostko E. P. (ed.) 2009 Peanut Rx-Minimizing diseases of peanut in the southeastern United States-the 2009 peanut disease risk index. 2009 Peanut Update. Univ. of GA. Coop. Ext. Rept CSS-09-0114 : 41 – 56 .
Gorbet D. W. 2007 Registration of ‘AP-3’ peanut. J. Plant Reg 1 : 123 – 127 .
Gorbet D. W. 2006 Registration of ‘Andru II’ peanut. Crop Sci 46 : 2712 – 2713 .
Gorbet D. W. 2006 Registration of ‘Carver’ peanut. Crop Sci 46 : 2713 – 2714 .
Gorbet D. W. and Shokes F. M. 2002 Registration of ‘C-99R’ peanut. Crop Sci 42 : 2207 .
Gorbet D. W. and Tillman B. L. 2009 Registration of ‘Florida-07’ peanut. J. Plant Reg 3 : 14 – 18 .
Holbrook C. C. and Culbreath A. K. 2007 Registration of ‘Tifrunner’ peanut. J. Plant Reg 1 : 124 .
Isleib T. G. , Rice P. W. , Mozingo R. W. , Mozingo R. W. , and Pattee H. E. 1999 Registration of ‘Gregory’ peanut. Crop Sci 39 : 1526 .
Isleib T. G. , Rice P. W. , Mozingo R. W. , Bailey J. E. , Mozingo R. W. , and Pattee H. E. 2003 Registration of ‘Perry’ peanut. Crop Sci 43 : 739 – 740 .
Mozingo R. W. , Coffett T. A. , Phipps P. M. , and Coker D. L. 2006 Registration of ‘CHAMPS’ peanut. Crop Sci 46 : 2711 – 2712 .
Smith N. B. 2006 Peanut cost analyses for 2006. In Prostko E. P. (ed.) 2006 Peanut Update. Univ. of GA. Coop. Ext. Rept CSS-06-0112 : 58 – 65 .
Smith N. B. and Smith A. R. 2008 Peanuts, irrigated and non-irrigated south Georgia 2009 – estimated costs and returns. UGA Ext. Ser. Budget (http://www.ces.uga.edu/agriculture/agecon/printedbudgets.htm).
Tillman B. L. , Gorbet D. W. , and Anderson P. C. 2007 Influence of planting date on yield and spotted wilt of runner market type peanut. Peanut Sci 34 : 79 – 84 .
USDA-Agricultural Marketing Service 1998 Farmer's stock peanuts inspection instructions U.S. Dept. of Agric. - Agric. Mkt. Ser. Fruit and Veg. Div., USDA-ARS Washington, DC .
Warren R. L. , Weber J. B. , and Davidson L. E. 1995 Pesticide behavior in soils and groundwater protection in peanut management systems. 245 – 285 IN Pattee H. E. and Stalker H. T. (eds.) Advances in Peanut Science Amer. Peanut Res. Educ. Soc. Inc Stillwater, OK .
Williams J. E. and Drexler J. S. 1981 A non-destructive method for determining peanut pod maturity. Peanut Sci 8 : 134 – 141 .
Wynne J. C. , Coffelt T. A. , Mozingo R. W. , and Anderson W. F. 1991 Registration of ‘NC-V 11’ peanut. Crop Sci 31 : 484 – 485 .
Notes
Author Affiliations
1 Professor, University of Georgia, Dept. of Crop & Soil Sciences, Coastal Plain Experiment Station, Tifton, GA 31793-0748.
2 Professor, University of Georgia, Dept. of Agric. & Applied Economics, Georgia Experiment Station, Griffin, GA 30223-1797.
*Corresponding author (email: wdbranch@uga.edu)